Abstract—Non-homogeneous irradiation conditions due to
environmental changes introduce multiple peaks in non-linear P-V characteristics. Hence, to operate PP-V at the global power point, numerous algorithms have been proposed in the literature. However, due to the insufficient exploitation of control variables, all the MPPT methods presented in literature fail to guarantee Global Maximum Power Point (GMPP) operation. In this paper, a new detection technology to identify global MPP zones using hybrid Enhanced Leader Particle Swarm Optimization (ELPSO) assisted by a conventional Perturb and Observe (P&O) algorithm is proposed. With inherent mutations, ELPSO applied to MPPT excels in exploring global regions at initial stages to determine the global best leader; whilst, P&O is reverted back soon after global solution space is detected. The transition from ELPSO to P&O is mathematically verified and allowed only when ELPSO finds the global optimal zone. Adapting this hybrid strategy, the proposed method has produced interesting results under partial shaded conditions. For further validation, the results of the proposed hybrid ELPSO-P&O are compared with conventional ELPSO and the hybrid PSO-P&O methods. Experimental results along with energy evaluations confirmed the superiority of the ELPSO-P&O method in obtaining the maximum available power under all shaded conditions.
Index Terms— Global Power, Enhanced Leader Particle
Swarm Optimization (ELPSO), Perturb and Observe (P&O), Partial Shaded Conditions (PSC).
I. INTRODUCTION
OWER conversion from abundant solar energy is made simple with the advent of photovoltaic (PV) power conversion units [1, 2]. However, events such as PV module non-linearity, lower panel efficiency and notable power loss due to partial shading (PS) create hindrance in large solar power generation [3-5]. Here, PS denotes the occurrence of
Manuscript received April 3, 2018; revised August 2, 2018; October 16, 2018 and January 13, 2019; accepted February 16, 2019. This work was supported under the development of the Solar Energy Research Cell by the administration of Vellore Institute of Technology (VIT)-Vellore.
J.P.Ram is with the department of Electrical and Electronics Engineering, KPR Institute of Engineering and Technology (KPRIEnT), Arasur, Coimbatore- 641407, India (e-mail: [email protected])
D.S.Pillai and N. Rajasekar are with the Solar Energy Research Cell (SERC), Department of Energy and Power Electronics, School of Electrical Engineering, Vellore Institute of Technology (VIT), Vellore, 632014 India (e-mail: [email protected], [email protected] ).
Scott Strachan is with the Department of Electronic and Electrical Engineering, Strathclyde Universsity, Glasgow, Scotland. (e-mail: [email protected] ).
non-homogeneous irradiation falling over a PV array caused by bird droppings, tree shading and dust. Besides, it causes multiple power peaks in P-V characteristics and subsequent power loss. To minimize the adverse effects of PS, many MPPT methods have been devised and implemented previously to achieve better performance.
Generally, MPPT methods can be classified into: (i) conventional methods and (ii) soft computing/GMPP techniques. Other than these methods, MPPT based on modified beta algorithm and thermograph techniques also exist in literature [6, 7]. However, usage of thermal cameras [7] and complex computations followed [6] remain as a prominent drawback of these methods. Conventional MPPT methods follow simple duty cycle perturbation to track the maximum power, but, their performance is always suboptimal when PV panels are partially shaded [8, 9]. Alternatively, soft computing methods offer excellent ability to solve non-linear problems and therefore deliver superior performance compared to conventional methods. Wide variety of soft computing techniques following different tracking strategies have been evolved so far [10-15].
In addition, many hybrid methods fusing the properties of either two soft computing methods or combining conventional method with metaheuristic algorithm can also be seen [16, 17]. Hence, to recapitulate, variants of PSO and other hybrid MPPT methods are reviewed. Understanding PSO‘s potential, the authors in [5, 17 and 18] improved PSO performance by fusing it with the conventional P&O method. However, initialization constraints and high power oscillations limit the hybrid method performance during shaded conditions. Recently, a new Differential Evolution-PSO (DEPSO) method was tested for MPP tracking in [19]. Since, the adopted methodology switches between the DE and PSO method for odd and even iterations; the method show good balance between exploration and exploitation. However, this technique is highly complex and involves a large number of parameters. One of the major hindrances that exist with conventional PSO method is its velocity update; lofty velocities in particle update will guide the particles to search solutions at the boundaries; while, short velocities lead to slower convergence. Solving this issue, in [20] an adaptive velocity concept to track the MPP was followed. The approach was sensible enough to mitigate the drawback associated with conventional PSO but,
Detection and identification of global maximum
power point operation in solar PV applications
using a hybrid ELPSO-P&O tracking technique
J.Prasanth Ram, Dhanup.S.Pillai, MemberIEEE, N.Rajasekar, Member, IEEE andScott M. Strachan
the authors failed to establish the method‘s superiority on crucial shaded conditions. It is a well-known fact that PSO methods involve high oscillations in search of good solutions; to overcome this drawback as an alternative to PSO method i.e., Ant Colony Optimization (ACO) is introduced in [21]. During earlier stages of the search procedure say, for two iterations ACO method is used and later it is switched back to P&O method. However, this method still has high power oscillations when it encounters global regions during initial search. Also, the method remains unproven for complex shade conditions
From the literature, it is understood that the methods that follow soft computing may encounter any one of the following issues: 1) deficient arbitrariness in control variables, 2) Increased power fluctuations before convergence, and 3) Large parameter tuning. Therefore, research on MPPT still strive for a new/alternative method that can circumvent the problems mentioned and attain global peak (GMPP) at any given partial shading condition. Indeed, it is judicial to improve the performance of the existing methods rather than proposing a new complex algorithm. Moreover, modifications to the established methods have the additional advantage of easy practical implementation in the existing system and do not require additional spending. Hence with this view point, in this work, an attempt is made to improve the performance of the existing PSO methods by introducing new mutation factors. Even though different combinations have been tried earlier in the literature; still there exists a room for considerable improvement when mutation enriched PSO method is combined with P&O method. The first method focuses on power oscillations reduction while the latter is used for exploitation. Therefore, the conventional PSO method performance is enhanced with additional four different mutations to locate the global peak and conventional P&O method is used to avoid needless search. Addition of mutation to existing PSO methods allows faster convergence to global locations within considerable time. Further, new mathematical formulations are made with ELPSO method such that the detection of global solution space is identified in first stage and only after validation, the P&O transition is anticipated in second stage. Since, switching between the methods is based on threshold voltage and current limits; performance improvement with proposed ELPSO-P&O method is
anticipated to have a new benchmark in MPPT arena. In support of methods superiority, case study based on switching transients for different shading patterns are made.
The remainder of the paper is organized as follows: Section 2 describes the modelling of solar PV and system architecture; Section 3 describes the implementation of ELPSO-P&O for MPPT. In Sections 4 hardware results are displayed. In section 5, the energy saving and income generation of ELPSO-P&O is validated with necessary theory and is compared with the conventional ELPSO and PSO methods. The final section presents the conclusions of the work.
II. PV SYSTEM DESCRIPTION
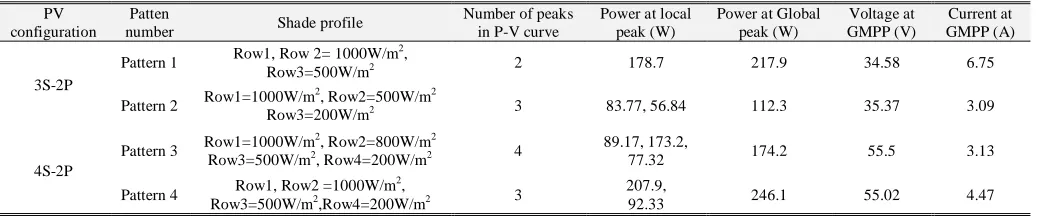
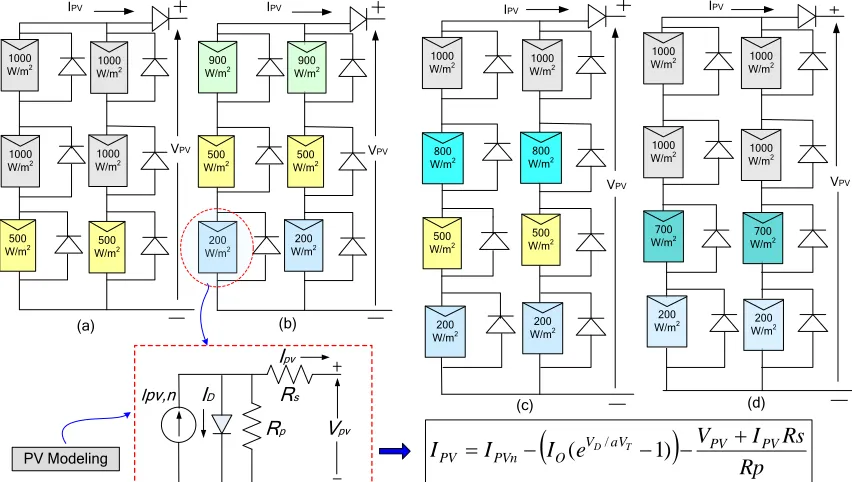
The output power restriction on a single PV panel necessitates series and parallel connection of multiple modules to form PV array. Usually, bypass diode (connected in parallel) and blocking diode (connected in series) are introduced to protect the array panels from hotspot and current reversal problems respectively [14,21,28]. But additional bypass diode introduces multiple power peaks in the P-V curve and significant power loss. To signify the importance of MPPT techniques, occurrence of multiple power peaks in P-V curve for two different PV configurations: 1) 3S-2P PV array configuration and; 2) 4S-2P PV array configuration is illustrated via I-V/P-V characteristics shown in Fig.1 and Fig.2 respectively. With four various shade patterns covering wide variety of local (LMPP) and global peaks (GMPP) is created to measure the success rate behind MPPT methods. It is noteworthy to mention that closer power peaks make identification of global peak quite challenging for any MPPT method. Therefore, the methods should posses the ability to discriminate global and local peak. Further hybridization avoid unwanted global search on temporary shading. The irradiation profile setting for the two different PV array configurations is explained further. For 3S-2P configuration, the PV array is given with two and three irradiation changes to create two and three power peaks in P-V curve. Similarly, for 4S-2P configuration, the P-V curve with four and three power peaks are exclusively created to test the veracity of the proposed MPPT technique. The detailed description in regard to shade profile and its corresponding power at local and global peaks are presented in Table I.
TABLE I
SHADE PROFILE AND ITS POWER VALUES FOR 3S-2P AND 4S-2PPV CONFIGURATION
PV configuration
Patten
number Shade profile
Number of peaks in P-V curve
Power at local peak (W)
Power at Global peak (W)
Voltage at GMPP (V)
Current at GMPP (A)
3S-2P
Pattern 1 Row1, Row 2= 1000W/m
2
,
Row3=500W/m2 2 178.7 217.9 34.58 6.75
Pattern 2 Row1=1000W/m
2, Row2=500W/m2
Row3=200W/m2 3 83.77, 56.84 112.3 35.37 3.09
4S-2P
Pattern 3 Row1=1000W/m
2, Row2=800W/m2
Row3=500W/m2, Row4=200W/m2 4
89.17, 173.2,
77.32 174.2 55.5 3.13
Pattern 4 Row1, Row2 =1000W/m
2
,
Row3=500W/m2,Row4=200W/m2 3
207.9,
[image:2.612.49.568.606.715.2](d) (c)
1000
W/m2 1000
W/m2
800
W/m2 W/m800 2
1000
W/m2 1000
W/m2
1000
W/m2 1000
W/m2
(b) (a)
1000
W/m2 1000
W/m2
1000
W/m2 W/m1000 2
500
W/m2 500
W/m2
900 W/m2
500 W/m2
500 W/m2
200
W/m2 W/m200 2
200 W/m2
200 W/m2
500 W/m2
500 W/m2
700
W/m2 700
W/m2
200
W/m2 200
W/m2 IPV
IPV
VPV
IPV
IPV
VPV
Rs
Rp
Ipv,n ID
Ipv
Vpv
Rp Rs I V e
I I
IPV PVn O( VD/aVT 1) PV PV
900 W/m2
PV Modeling
VPV
[image:3.612.98.524.53.294.2]VPV
Fig. 1.PV patterns with an equivalent single diode model, considered for testing.
Global Peaks GMPP
Local Peaks LMPP LMPP
Voltage (V)
C
ur
re
nt
(
A
)
Fig. 2(a). I-V characteristics for different PV patterns.
Global Peaks (GMPP)
Local Peaks, LMPP
LMPP
LMPP LMPP
Voltage (V)
P
o
w
er
(
W
)
Fig. 2(b). P-V characteristics for different PV patterns.
III. ELPSO-P&O AND ITS IMPLEMENTATION TO MPPT
A. Enhanced Leader-Particle Swarm Optimization:
Enhanced Leader-PSO (ELPSO) method is an incorporation of realistic mutations on the conventional PSO method to create additional randomness in control variables. This new method was first proposed by Jordehi, A. Rezaee in [22] and then well exploited in recent years. Adoption of ELSPO method is well suited to the MPPT problem in the sense that
the additional mutations not only create randomness to escape from local minima but also speeds up the convergence process. Both the above said properties are crucial for a bio inspired method when applied to MPPT applications. Benefited by the random initialization, an iterative strategy is followed to update the particle position in search space. Goodness of the particles is evaluated and the best particle (Pbest) with higher fitness is noted. Following the conventional PSO method, the velocity and positions of the control variable gets updated before mutation. This behaviour of the ELPSO and conventional PSO methods is quite similar. However, the unique benefit of ELPSO method is that it adopts different mutations such as Gaussian, Cauchy, reverse and simple mutations with respect to current global best positions. At the end of the mutation process, one iteration completes and a new leader i.e. the ‗best particle‘ emerges [15, 22]. Various mutations that help ELPSO to attain global locations are:
1) Gaussian Mutation updates the control variable based on Gaussian distribution. The mathematical representation for the Gaussian mutation is given as:
Pg1Pg(XmaxXmin)*Gaussian(o,h) (1)
Where ‗h‘ is the standard deviation of particles in the iteration and ‗o‘ is mean of all the particles in the current iteration. It should be noted that the standard deviation and mean for each iteration step varies linearly with respect to the diversity in duty ratio.
2) Cauchy Mutation is similar to Gaussian mutation and we use a scaling parameter that decreases linearly with respect to iteration time. The current global best duty (Pg) will undergo
Cauchy mutation are given by
) , ( *
)
( max min
2 P X X Cauchyo s
Pg g (2)
Where ‗Xmax, Xmin‘ is the maximum and minimum boundary
[image:3.612.48.280.319.614.2]cycles (X1-X5) in the current iteration, ‗s‘ is the scaling
parameter that decreases linearly with respect to iteration time (tmax). The scaling parameter in Cauchy distribution is given
as:
max
1 ) ( ) 1 (
t t S t
S (3)
3) Reverse Mutation is the simplest mutation that follows a transverse search for the global optimal region. Reverse mutation helps to find global regions that are totally unexplored during initial iterations. Further, this mutation earns a special mention due to its ability to comprehensively
avoid premature convergence. The mathematical
representation of Reverse mutation is given by:
g
g X X P
P3( max min) (4) 4) Simple Mutation is based on the interaction between the scaling factor ‗F=1.25‘ and current global best ‘Pg’. The
mathematical representation of Simple mutation is given by: Pg4PgF(XijXkj) (5)
Where ‗ j
k j
i X
X & ‘ are two random particles in the
population corresponding to ‗jth‘ iteration.
Thus, an intense search process via mutation is clearly possible with ELPSO method. Moreover, it is noteworthy to mention that every mutation pushes the current global best particle to explore exclusively such that accurate global best regions are attained. Therefore, at the end of the mutation process, the ELPSO method not only avoids premature convergence that exists with conventional PSO but, more importantly, reduces the convergence time to a certain extent.
B. Necessity for hybridization:
From the discussions, it can be clearly understood that the mutations present in ELPSO improves the accessibility to reach global solution space during initial iterations itself. However, the additional time taken by the particles may delay its convergence. Therefore, to avoid needless search and enhance the tracking ability, P&O method is switched once the global optimal zone is identified using ELPSO method. Further, to validate the suitability of hybridization, the performance of ELPSO method along with PSO and P&O method are simulated for different shade cases on the PV array constructed in section 2. Simulations are performed in MATLAB 2014a platform on 4 GB RAM, Intel I7 processor. All the methods are coded in the same simulation platform following a sampling rate of 0.03 sec.
C. Parameter tuning and its influence in convergence:
One of the crucial and complex tasks in improving the search ability of any optimization technique is the identification of optimal control parameters. Further, the process complexity increases with increase in number of parameters to be tuned. Therefore, to ascertain performance of ELPSO, its parameters are tuned especially social and cognitive coefficients ‗C1&C2‘ and weight factors ‗Wmax&Wmin‘. In addition, the step size of P&O method is also tuned for better convergence. Before parameter tuning,
some key points regarding the conventional PSO parameters inferred from literature are taken into account and are listed below:
(i) For proper velocity update, inertia weight is highly imperative and it needs to be decreased linearly with increase in iteration count.
(ii) The existence of cognitive and social best decides the convergence to global optimum. Further, it is experimentally proven that improper selection of ‗C1&C2‘ results in convergence to poor solutions [23]. Therefore systematic tuning is performed in the following way: 1) For tuning inertia weight 'W', the values of ‗C1&C2‘ are kept constant, 2) Velocity coefficients C1&C2are tuned with the best identified 'W' value and 3) The step size of P&O method is optimized to avoid the oscillations around MPP. It is important to note that, for parameter tuning, pattern (1) previously presented in section II is considered.
(i) Convergence characteristics and its influence due to the
variation in inertia weight (‘W’):
In order to study the impact of variations in ‘W’ on convergence to MPP, three different cases: (1) ‗W=0 to 0.3‘, (2) ‗W= 0.3 to 1‘ and (3) ‗W=0.7 to 1‘ are analyzed. Further, the values of constants ‗C1 & C2‘is judicially fixed referring to
[23, 24]. With the above set values, convergence to MPP that corresponds to aforesaid cases are simulated and presented using 3D charts in Fig.3. Further, considering sixty instances of duty cycles, ELPSO method's capability to reach GMPP is examined. In addition, the switching transients that correspond to all cases are also recorded and presented. From the characteristics, it is found that for the first case ‗W=0 to 0.3‘, the duty cycle is oscillating between the range 0.2 and 0.8 with no convergence attained. While, in the second case ‗W= 0.3 to 1‘, a perfect balance in exploration and exploitation is seen such that ELPSO method easily converges to GMPP with minimal oscillations. Further, it is important to note that power oscillations and switching transients are observed to be less for this particular case. However, for the last case ‗W=0.7 to 1‘, ELPSO method gets trapped to local MPP because of very high inertia weight. Thus, based on the analysis carried out, inertia weight ranges selected for the second case seems to be the most appropriate one for GMPP tracking. Therefore, for further experimentations, the optimal values of 'Wmax' and
'Wmin' are set to1 and 0.3 respectively. It is noteworthy to
mention here, that inertia weight is updated based on the following equation.
t T
W W W W
max min max max
(6)
Where, ‘t’ is the current iteration number and ‗Tmax‘is maximum iteration count.
(ii)Convergence characteristics and its influence due to the
variation in constant C1&C2:
In a similar way, the variations in ‗C1&C2‘ are also analysed to investigate its influence on GMPP convergence.
0.2 0.4
0.6 0.8
1
50 100 150 200 250
0 20 40 60
X: 0.8 Y: 175 Z: 58
0.2 0.4
0.6 0.8
1
50 100 150 200 250
0 20 40 60
X: 0.7466 Y: 217 Z: 58
0.2 0.4
0.6 0.8
1
50 100 150 200 250
0 20 40 60
X: 0.7164 Y: 185.9 Z: 59
N
o
o
f s
a
m
p
le
s
Duty
Power Duty=0.2,
P=70.7W Duty=0.8,
P=175W
N
o
o
f s
a
m
p
le
s
Duty
Power
Convergence
to GMPP
Initial switching transients
Inertia weight ‘W’ varying 0 to 0.3 Inertia weight ‘W’ varying 0.3 to 1
Duty
Power
Inertia weight ‘W’ varying 0.7 to 1
N
o
o
f s
a
m
p
le
s Initial Convergence to LMPP
switching transients
(a) (b) (c)
Fig. 3. Simulation test on ELPSO convergence characteristics for optimal tuning of ‗W‘ values.
For attaining optimal values of ‗C1&C2‘, simulations are performed for ELPSO method by considering three possible criterions: (1) C1C2,(2) C1C2 and (3)C1C2 .Further, for all three cases, inertia weights, 'Wmax' and 'Wmin' are kept constant and are optimally set to 1 and 0.3 respectively in accordance to the previous investigations. The simulation results obtained for sixty duty cycle samples, indicating ELPSO convergence characteristics and switching transients are plotted using 3D charts represented Fig.4. It is seen that, with the first criterionC12&C21.5, ELPSO converges to a
local MPP and is characterized by large switching transients and power oscillations. On the other hand, though the global MPP is attained by keeping ‗C1&C2‘ values identical (C1C22.0), time taken to attain convergence is very high.
Distinctively, by adopting third criterion of using a higher value for ‗C2‘ than ‗C1 ‘ (C11.4,C21.8), the convergence characteristics of ELPSO has been substantially improved; both in terms of convergence time and power value achieved. This is because, the higher value set for social constant ‗C2‘ capable for global exploration has empowered ELPSO method to locate the global zone within less number of iterations itself and subsequently, the local search component ‗C1‘ aided ELPSO to catch the GMPP accurately. In addition, for the
third criterion, the switching transients are also observed to be very low compared to the initial results. Thus, for simulation and hardware experimentations, the optimal values of
2 1&C
C compatible for ELPSO performance are fixed to 1.4 and 1.8 respectively.
(iii) Convergence characteristics of P&O method and its
influence to change in duty:
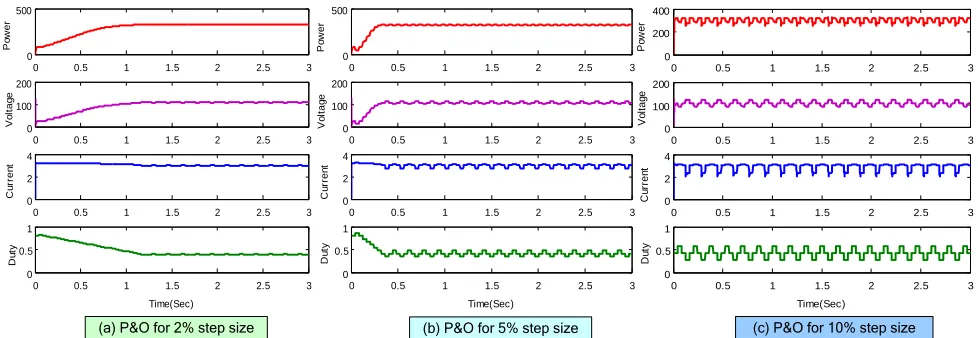
Extensive literature study states that P&O method is still one of the best suitable methods for MPPT under constant irradiation conditions. While, in most partial shade conditions, P&O method fails to locate the global maximum. However, it is important to note that, identification of duty cycles near to global power zone and initialization of P&O at such duty cycle points can guarantee GMPP operation with ease.In addition, to counteract steady oscillations of P&O, lesser step size in duty perturbations is an efficient and reliable solution [26, 27]. Therefore, it becomes crucial to identify the optimal step size required for duty cycle perturbations, such that, P&O operates with less/no oscillations around the MPP. To achieve this task, a PV array having six series connected PV modules are tested under uniform irradiation levels with 2%, 5% and 10% step sizes. The simulation results for all three cases are presented in Fig.5.
0.4 0.5
0.6 0.7
0.8
100 150 200
0 20 40 60
X: 0.7144 Y: 185.9 Z: 59
0.2 0.4
0.6 0.8
1
50 100 150 200 250
0 20 40 60
X: 0.7527 Y: 217 Z: 59
0.2 0.4
0.6 0.8
1
50 100 150 200 250
0 20 40 60
X: 0.7466 Y: 217 Z: 59
N
o
o
f
sa
m
p
le
s
Duty Power
Criterion: C1>C2, Values: C1=2, C2=1.5 Criterion C1=C2, Values: C1= C2=2.0 Criterion C1<C2, Values: C1= 1.4, C2=1.8
Switching transients
Convergence to LMPP
N
o
o
f
sa
m
p
le
s
Duty Power
Switching transients
Delayed Convergence
N
o
o
f
sa
m
p
le
s
Duty Power
Switching transients
Convergence to GMPP
(a) (b)
(c)
0 0.5 1 1.5 2 2.5 3 0
200 400
P
o
w
e
r
0 0.5 1 1.5 2 2.5 3
0 100 200
V
o
lt
a
g
e
0 0.5 1 1.5 2 2.5 3
0 2 4
C
u
rr
e
n
t
0 0.5 1 1.5 2 2.5 3
0 0.5 1
Time(Sec)
D
u
ty
0 0.5 1 1.5 2 2.5 3
0 500
P
o
w
e
r
0 0.5 1 1.5 2 2.5 3
0 100 200
V
o
lt
a
g
e
0 0.5 1 1.5 2 2.5 3
0 2 4
C
u
rr
e
n
t
0 0.5 1 1.5 2 2.5 3
0 0.5 1
Time(Sec)
D
u
ty
0 0.5 1 1.5 2 2.5 3
0 500
P
o
w
e
r
0 0.5 1 1.5 2 2.5 3
0 100 200
V
o
lt
a
g
e
0 0.5 1 1.5 2 2.5 3
0 2 4
C
u
rr
e
n
t
0 0.5 1 1.5 2 2.5 3
0 0.5 1
Time(Sec)
D
u
ty
[image:6.612.62.551.53.222.2](a) P&O for 2% step size (b) P&O for 5% step size (c) P&O for 10% step size
Fig.5. Analyzing P&O convergence characteristics for setting optimal duty cycle step size.
From Fig.5, two important observations can be made (i) P&O has almost zero oscillations for smaller step size and vice versa (ii) Unlike soft computing methods, P&O has no initial switching transients while converging to MPP. The implications drawn from the above discussion convey that, initializing P&O near to the global power zone identified by ELPSO method with an optimal step size of 2% provides GMPP operation with minimal oscillations. To summarize, hybridizing the proposed ELPSO with conventional P&O method is an excellent choice for hybrid MPP tracking and could be a viable option to enhance the performance of real-time MPPT technologies.
From the above discussion, the parameters used for PSO, ELPSO and P&O methods are evaluated and given in Table II.
TABLE II
PARAMETERS OF PSO,ELPSO AND P&O METHOD.
PSO ELPSO P&O
Wmax=1 C1=1.4 D=0.8
Wmin=0.3 C2=1.8 ∆D=0.005
C1=1.4 Wmax=1 -
C1min=1 Wmin=0.3 -
C2=1.8 F=1.25 -
C2min=1 - -
D. Simulation validation for ELPSO, PSO and P&O methods
(i)Irradiation change from pattern 1 to pattern 2:
The irradiation profile of the 3S-2P PV array configuration, corresponding to pattern (1) & (2), is programmed as shown in Fig.1. It is found that only one irradiation change is present in pattern (1), hence, two peaks in the P-V characteristics are found at 219.2 W and 178.7 W respectively. Similarly, two irradiation changes are seen with pattern (2); thereby, three power peaks emerge in which the global peak is found at 112.3 W, while the remaining local peak power are found at 93.29 W and 65.45 W respectively. The simulated power, voltage and current characteristics for ELPSO, PSO and P&O methods are shown in Fig.6. It is seen that when pattern (2), introduced at time t=2sec without much oscillation, ELPSO method survived to global peak with almost zero oscillations. Though PSO method has identified GMPP, the switching loss and convergence are found high. Since both patterns have unique difference between their shade occurrences, the swarm optimized methods converge to global peak. Having initialized
at 80% of the duty, the P&O method found global peak of 214.6 for pattern (1) since it is initialized nearer to global peak. But it failed to locate global power peak for pattern (2). Some of key points to be noted here are (i) the ELPSO method converges very quickly with minium oscillations and (ii) the PSO method converges with higher power loss when compared to ELPSO. (iii) P&O method though has a drawback of getting trapped to local peak, on comparison; the power explored by P&O was high for pattern (1).
(ii) Irradiation change from pattern 3 to pattern 4:
Here the shade patterns for pattern (3) and (4) are implemented over 4S-2P PV array. In pattern (3), three irradiation changes result at four power peaks as, 177.12 W being the global power and the remaining local power peaks can be found at 89.2W, 173.1W and 92.54W. While on the other hand, two irradiation changes in pattern (4) results in three peaks - 248.21W being global and 207.1W, 92.36 W the local maximum. Before simulation, an important inference with pattern (3) is that the power difference between the global peak and one of the local peaks is negligible. However, the ELPSO method have identified global peaks easily and converged at minimal time as well. It is seen that, PSO struggles to find the global peak due to the absence of its exploitation ability. In fact, velocity updation behind PSO causes the algorithm to fluctuate around the global power point for both shade conditions. Nevertheless, the PSO method yet again demonstrated itself to be a viable tool to track global MPP under shaded conditions. Since the global peaks for both shade patterns are far away from 80% duty, P&O method got trapped to local maxima. Simulation results for the irradiation change from pattern (3) to pattern (4) for ELPSO, PSO and P&O methods are shown in Fig.7. From the simulations performed with ELPSO, PSO and P&O methods, the following conclusions are arrived:
1. Mutations, the inherited property present in ELPSO allows the method to locate accurate global solutions space even when complex shade cases are used. However, the method requires additional time to converge towards final solutions. 2. P&O method completely rely on initialization of duty cycle
[image:6.612.110.235.430.503.2]3.
0 0.5 1 1.5 2 2.5 3 3.5 4
0 5 10 Time(sec) C u rr e n t( A )
0 0.5 1 1.5 2 2.5 3 3.5 4
100 200 P o w e r( W )
0 0.5 1 1.5 2 2.5 3 3.5 4
0 50 100 V o lt a g e (V )
0 0.5 1 1.5 2 2.5 3 3.5 4
0 100 200 P o w e r( W )
0 0.5 1 1.5 2 2.5 3 3.5 4
0 50 100 V o lt a g e (V )
0 0.5 1 1.5 2 2.5 3 3.5 4
0 5 10 Time(Sec) C u rr e n t( A )
211 W 109 W 210 W
108 W
Pattern 1 Pattern 2 Pattern 1 Pattern 2 Pattern 1 Pattern 2
0 0.5 1 1.5 2 2.5 3 3.5 4
0 100 200 P ow e r( W )
0 0.5 1 1.5 2 2.5 3 3.5 4
0 50 100 V ol ta ge (V )
0 0.5 1 1.5 2 2.5 3 3.5 4
0 5 10 Time(sec) C ur re nt (A )
212.1 W 93 W
[image:7.612.90.544.59.397.2](a) ELPSO (b) PSO (c) P&O
Fig.6. Simulated power, voltage and current curves for irradiation change from pattern (1) to pattern (2)
0 0.5 1 1.5 2 2.5 3 3.5 4
0 100 200 300 P o w e r( W )
0 0.5 1 1.5 2 2.5 3 3.5 4
0 50 100 V o lt a g e (V )
0 0.5 1 1.5 2 2.5 3 3.5 4
0 5 10 Time(Sec) C u rr e n t( A )
0 0.5 1 1.5 2 2.5 3 3.5 4
0 100 200 300 P o w e r( W )
0 0.5 1 1.5 2 2.5 3 3.5 4
0 50 100 V o lt a g e (V )
0 0.5 1 1.5 2 2.5 3 3.5 4
0 5 10 Time(Sec) C u rr e n t( A ) 173 W 240 W
172.5 W 240.2 W
Pattern 3 Pattern 4 Pattern 3 Pattern 4
(a) ELPSO (b) PSO (c) P&O
Pattern 3 Pattern 4
0 0.5 1 1.5 2 2.5 3 3.5 4
0 100 200 300 P ow e r( W )
0 0.5 1 1.5 2 2.5 3 3.5 4
0 50 100 V ol ta ge (V )
0 0.5 1 1.5 2 2.5 3 3.5 4
[image:7.612.67.544.59.212.2]0 5 10 Time(Sec) C ur re nt (A ) 93.1 W 207 W
Fig.7. Simulated power, voltage and current curves for irradiation change from pattern (3) to pattern (4).
4. Further, if initialized properly, the method shows good competence even against PSO and ELPSO with faster convergence (pattern 1). The detailed discussions pertinent to P&O duty initialization and its corresponding power oscillations can be seen in [22].
Even though PSO method has the potential to reach global power peak, the power oscillations limit its ability to reach convergence in a shorter time period. Further, in literature, this method is not recommended for crucial shade conditions as well [6, 15].
Therefore, it is judicial to fuse ELPSO method with P&O technique rather than PSO for optimal performance; since, the criterion to switch to P&O is crucial and hence, before switching it is mandatory to identify the global solution zone. This criterion is found missing in all available literatures and the hybrid approaches like PSO-P&O and ACO-P&O has switched to P&O either randomly or in even/odd iterations without assuring that one of the particles in population has identified the global region. However, with the aforementioned advantages of ELPSO, a new switching criterion is developed and is explicitly explained in the following section. Therefore, ELPSO-P&O fusion is highly compatible and well justified for MPPT application. It is worth to mention that P&O is declared with 2% step size to avoid higher oscillations at MPP. The step size of P&O is arrived based on continuous experimentations.
(iv) Criterion to switch P&O:
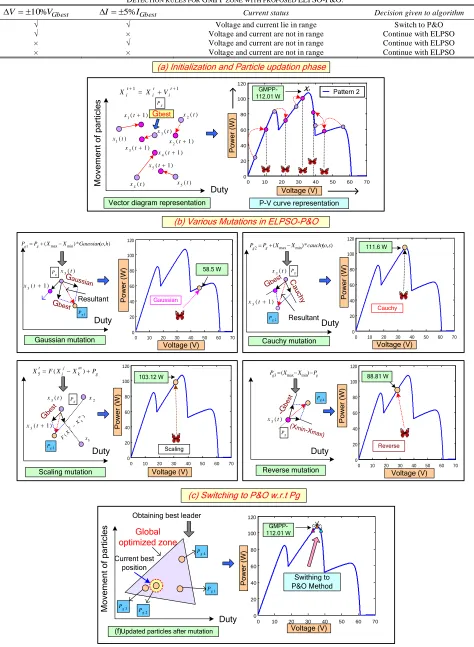
As previously said, in literature, there is no definite procedure exist to switch between the methods in a hybrid MPPT technique. For instance, the authors in [21] randomly switched to P&O after two iterations; while in [17], switching between methods is made at odd/even iterations. This random switching without any predefined criterion critically questions the method suitability for maximum power tracking applications especially at partial shading conditions. Hence, a framework is needed to perform transition between MPPT methods in any hybrid approach. Thus, a new strategy is overlaid in this work to carryout switching transition. In order to carry out the switching transition, the voltage and current readings are noted at two different valid instances i.e. at the beginning and at the end of mutation process. The key idea here is to diagnose the global optimized zone and is derived from the fact that, if the power obtained after the mutation process in the current iteration falls in line to previous iteration ‗Gbest‘ i.e., before mutation, then the voltage and
TABLE III
DETECTION RULES FOR GMPP ZONE WITH PROPOSED ELPSO-P&O.
Gbest V V10%
I5%IGbest Current status Decision given to algorithm
√ √ Voltage and current lie in range Switch to P&O
√ × Voltage and current are not in range Continue with ELPSO
× √ Voltage and current are not in range Continue with ELPSO
× × Voltage and current are not in range Continue with ELPSO
) ( 1 t x ) ( 4 t x ) ( 2 t x ) ( 3 t x ) ( 5 t x ) 1 (
1 t
x
) 1 (
3 t
x
) 1 (
2 t
x
) 1 (
4 t
x
) 1 (
5 t
x Gbest
1
1
t
i t i t
i X V
X
Vector diagram representation g
P
0 10 20 30 40 50 60 70
0 20 40 60 80 100 120 Pattern 2 GMPP-
112.01 W x Pattern 2
3 P o w e r (W ) Voltage (V)
(a) Initialization and Particle updation phase
P-V curve representation
) , ( * ) ( max min
1 P X X Gaussianoh
Pgg Pg2Pg(XmaxXmin)*cauchy(o,s)
g
P
Gaussian mutation Cauchy mutation
Reverse mutation Scaling mutation 1 g P Gbest Gaussian Resultant
Gbest Cau chy
Resultant
-Gbe
st
(Xmin
-Xmax)
) ( 3 t x ) 1 (
3 t
x 2 g P g P 3 g P 2 x ) ( m k j i X X F 5 x Gbe st 4 g P g P g P g
g X X P
P3( max min)
g m k j i t P X X F
X5 ( )
0 10 20 30 40 50 60 70 0 20 40 60 80 100 120 Pattern 2 58.5 W Gaussian P o w e r (W ) Voltage (V)
0 10 20 30 40 50 60 70
0 20 40 60 80 100 120 Pattern 2 88.81 W P o w e r (W ) Voltage (V)
(b) Various Mutations in ELPSO-P&O
0 10 20 30 40 50 60 70
0 20 40 60 80 100 120 Pattern 2 103.12 W P o w e r (W ) Voltage (V) Scaling
(c) Switching to P&O w.r.t Pg
0 10 20 30 40 50 60 70
0 20 40 60 80 100 120 Pattern 2 Swithing to P&O Method GMPP- 112.01 W P o w e r (W ) Voltage (V) Updated particles after mutation(f)
Global optimized zone 2 g P 1 g P Obtaining best leader
4 g P Current best position ) ( 3 t x ) 1 (
3 t
x ) ( 3 t x ) 1 (
3 t
x
0 10 20 30 40 50 60 70
0 20 40 60 80 100 120 Pattern 2 111.6 W Reverse P o w e r (W ) Voltage (V) Cauchy 3 g P ) ( 3 t x M o ve m e n t o f p a rt ic le s M o ve m e n t o f p a rt ic le s Duty Duty Duty Duty Duty Duty
[image:8.612.71.545.76.723.2]minimal power difference are:
VVmbest(t)Vbest(t) (5) IImbest(t)Ibest(t) (6)
Where, ‗t‘ is the iteration number, ‗Vmbest(t)‘ is the voltage
corresponding to mutation best power. ‗Vbest(t)‘ is the voltage
of ‗Gbest‘ before mutation, ‗Imbest(t)‘ is the current of mutation best power and ‗Ibest(t)‘ is the current corresponding to the
‗Gbest‘ before mutation.
The above conditions just validates the voltage and current range; but to arrive at decision of transition, the change in voltage and current values should be within the thresholds to switch either P&O or to continue with ELSPO. Verification with threshold limit becomes necessary to switch. Further, the above verification strengthens the switching process and ensures accurate detection in global regions. The threshold limits followed to identify GMPP zones are:
V10%VGbest (7) I5%IGbest (8) Where ‗VGbest‘ and ‗IGbest‘ are the voltage and current corresponding to current ‗Gbest‘. Afternumerous experiments,
the threshold percentage for equation (7) and (8) were arrived. The detection rules to switch P&O are shown in Table.III.
(iii) ELPSO assisted P&O method for MPPT:
The implementation steps of ELPSO-P&O method is given below:
Step 1: Initialization of particles: The step initiates the location of particles, boundary limits, parameters for optimization, population size and maximum number of iterations such as x1=0.15, x2=0.3, x3=0.5, x4=0.65, x5=0.82,
xmin=0.1,xmax=0.85, n=5 and Niter=30.
Step 2: Fitness evaluation and PSO particle updation: The goodness of the solutions for the initialized particles is evaluated and their positions are updated using the conventional PSO method as shown in Fig.8(a). From the initial evaluations, the particle ‗x3 ‘ is found to have position
nearer to global peak and the particle for next iterations are updated based on conventional PSO method.
Step 3: Application of mutation to (Gbest): Owing to the best value attained previously, various mutations explained in the previous section are applied to the (Gbest) to further explore the possible operating region. It is important to note that after every successful mutation, the DC-DC converter is activated to validate the fitness of generated duty. Further, if the power explored via the new control variable is higher, then the global best is replaced by the current mutated value.
These features in the ELPSO method enable the algorithm to accurately locate the duty cycle nearer to global optimal regions. Moreover, this methodology will be extremely adept to locate GMPP even with minimal power differences. With reference to current global best ‗x3 ‘, the applied mutations
with their position are explained in Fig.8(b).
Step 4: Criterion to switch P&O: With the knowledge on ‘Gbest’, the criterion for switching the P&O method is
evaluated based on the threshold limits explained in previous
section. If the criterion is satisfied, the algorithm switches to the P&O method, else continues with the conventional ELPSO method. Steps 2-4 are followed to track the MPP until the termination criterion is met. After identifying the global best particle, the switch of P&O is depicted in Fig.8(c).
Step 5: Criterion for change in irradiation conditions: Under dynamic irradiation conditions, the operating point of PV will vary. Hence the algorithm is retriggered by following the voltage and current threshold shown in [16].
E. Simulation validation for ELPSO-P&O method:
Simulation study with ELPSO–P&O hybrid method is also performed to ensure its superiority over conventional ELPSO and PSO methods. Similar shade pattern are followed for ELPSO is followed and the simulated waveforms for proposed hybrid fusion is shown in Fig.9.and Fig.10. respectively. Simulated power values clearly indicate that for all the shade cases, ELPSO-P&O method converges well before 0.45 sec. Moreover, the method locates the global solution space in first iteration itself. Further, with reduced step size declaration P&O method, has resulted in exploration of high power capability compared to ELPSO and PSO methods. In addition, almost zero steady state oscillations are observed in all the cases. From the simulation studies performed so far, two crucial factors that influence the maximum power point detection are (i) Switching transients and (ii) absence of arbitrariness. These two parameters are discussed in detail for effective understanding of its significance.
0 0.5 1 1.5 2 2.5 3 3.5 4
100 200
P
o
w
e
r
(W
)
0 0.5 1 1.5 2 2.5 3 3.5 4
0 50 100
V
o
lt
a
g
e
(
V
)
0 0.5 1 1.5 2 2.5 3 3.5 4
0 5 10
Time(sec)
C
u
rr
e
n
t(
A
)
Pattern 1 Pattern 2
[image:9.612.349.526.399.540.2]217.8 W 111.9 W
Fig.9. Simulated power, voltage and current curves from pattern (1) to pattern (2) for ELPSO method.
0 0.5 1 1.5 2 2.5 3 3.5 4
0 100 200 300
P
o
w
e
r(
W
)
0 0.5 1 1.5 2 2.5 3 3.5 4
0 50 100
V
o
lt
a
g
e
(V
)
0 0.5 1 1.5 2 2.5 3 3.5 4
0 5 10
Time(sec)
C
u
rr
e
n
t(
A
)
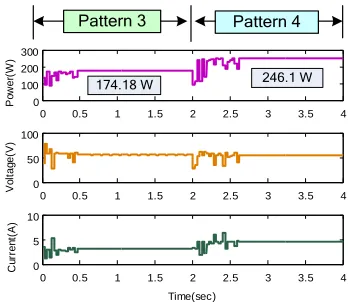
174.18 W 246.1 W
Pattern 3 Pattern 4
[image:9.612.351.525.564.715.2]F. Simulation validation of ELPSO-P&O in comparison with ABC and Firefly method:
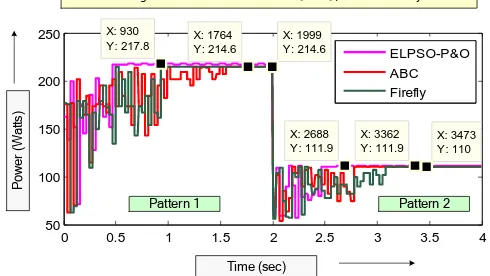
To emphasize the superiority of the proposed ELPSO-P&O method, the simulation results of ELPSO-P&O is compared with recently evolved soft computing techniques; Artificial Bee Colony (ABC) and firefly methods [24, 25]. Simulations are performed for pattern (1) and pattern (2) illustrated in Fig. 2 and the results are shown in Fig.11. For simulation analysis, the parameters Np-number of particles and - scaling factor for ABC, -random movement factor and -light intensity measurement for Firefly method are respectively tuned. From the attained results, it can be visualized that both the methods have higher oscillations in the beginning. On the other hand, ELPSO-P&O method swiftly converges to GMPP with very minimal oscillations. In addition, for pattern 1, ELPSO-P&O method acquired 217.8 W whereas, firefly and ABC methods has managed to attain 214.6W only. Note that the difference in power levels indicates the poor exploitation capability of both firefly and ABC methods. However, for pattern (2), only a negligible power difference is seen; where, ELPSO-P&O and ABC methods have produced 111.9W, while, firefly method converges to 110 W. Thus, it is evident that ELPSO-P&O method: 1) is not characterized by high initial oscillations and 2) guarantees GMPP convergence irrespective of shade severity.
0 0.5 1 1.5 2 2.5 3 3.5 4
50 100 150 200
250 X: 930
Y: 217.8 X: 1764Y: 214.6 X: 1999Y: 214.6
X: 2688 Y: 111.9
X: 3362 Y: 111.9
X: 3473 Y: 110
ELPSO-P&O ABC Firefly
Time (sec)
P
ow
er
(
W
at
ts
)
Power convergence characteristics for ELPSO-P&O, ABC and Firefly methods
Pattern 1 Pattern 2
Fig.11. Simulated power, voltage and current curves from pattern (1) to pattern (2) for ELPSO, ABSO and firefly method.
(i)Switching transients before convergence:
The oscillations before convergence characteristics have greater impact on the switching transients. Further, it is a measure of the thermal stresses occurred in power electronic switches. Therefore to quantify the amount of thermal stress that occur during transient period; number of switching transients that occur before convergence is noted and plotted in Fig.12. Further the plot can be understood in the following way. The area covered by number of transients decides the amount of switching stress. Due to the absence of mutations in PSO, the number of switching is very high which further increases the switching area. However, the presence of mutation introduce additional transient once after it converges to global solutions. Moreover, mutations in ELPSO cause particles to explore the search space with further duty cycle perturbations before convergence. Therefore, large switching
transients can be avoided when switching to P&O method once optimal zone is identified. Applying this principle, in ELPSO-P&O method, a transitory convergence occurs at 0.2 sec is attained with fewer oscillations is a noteworthy feature in new ELPSO-P&O hybrid method. This helps the proposed hybrid methodology to get rid of the higher switching steps in power convergence.
(ii)Absence of arbitrariness in control variable:
In most of MPPT methods like PSO, GA, ACO, Cuckoo search and firefly, the randomness in control variables is deficient because these methods stop the exploitation process after attaining convergence. Interestingly, the ELPSO method found in literature has mutation based evaluations that keeps alive search process even after its convergence is attained. But this results in further little oscillations if unattended. However, it ensures the accurate location of global regions. The conventional P&O method is best suited MPPT method to exploit high power when initialized properly. Hence utilizing ELPSO for initial stages of search and switching back to P&O after locating global region leads to a significantly improved system performance and helps to maintain its randomness for all situations.
TABLE IV
HARDWARE SPECIFICATIONS OF PROTOTYPE MODEL.
S.No Parameter Value
1 Switching Frequency 10KHz
2 Inductor 0.5mH
3 Capacitor 450V,100uF
4 Load Resistance 10A,100 ohm
IV. HARDWARE EXPERIMENTATION OF PROPOSED ELPSO-P&O METHOD
[image:10.612.328.549.324.385.2] [image:10.612.51.296.368.506.2]0.2 0.4 0.6 0.8 50 100 150 200 250 0 10 20 30 40 50 60 N o. of s am pl es Pow
er (W) Duty
Switching transients Global optimized zone (a) PSO 0.2 0.4 0.6 0.8 50 100 150 200 250 0 10 20 30 40 50 60 N o. of s am pl es Duty (b) ELPSO Global optimized zone Switching transients N o. of s am pl es Pow
er (W) Duty
(c) ELPSO-P&O 0.2 0.4 0.6 0.8 50 100 150 200 250 0 10 20 30 40 50 60 Global optimized zone Switching transients 0.2 0.4 0.6 0.8 60 80 100 120 0 10 20 30 40 50 60 N o. of s am pl es Pow
er (W) Duty
0.2 0.4 0.6 0.8 60 80 100 120 0 10 20 30 40 50 60 N o. of s am pl es Pow
er (W) Duty
0.2 0.4 0.6 0.8 60 80 100 120 0 10 20 30 40 50 60 N o. of s am pl es Pow er (W)
Switching transients Global optimized zone Global optimized zone Switching transients Global optimized zone Switching transients N o. of s am pl es Pow
er (W) 0.2 Duty
0.4 0.6 0.8 60 80 100 120 140 160 180 0 10 20 30 40 50 60 0.2 0.4 0.6 0.8 60 80 100 120 140 160 180 0 10 20 30 40 50 60 N o. of s am pl es 0.2 0.4 0.6 0.8 60 80 100 120 140 160 180 0 10 20 30 40 50 60 N o. of s am pl es Duty Global optimized zone Switching transients Global optimized zone Switching transients Global optimized zone Switching transients N o. of s am pl es Pow
er (W) Duty 0.2 0.4
0.6 0.8 100 150 200 250 0 10 20 30 40 50 60 N o. of s am pl es
Duty 0.2 0.4
0.6 0.8 100 150 200 250 0 10 20 30 40 50 60 N o. of s am pl es Pow
er (W) Duty
0.2 0.4 0.6 0.8 100 150 200 250 0 10 20 30 40 50 60 Global optimized zone Switchin g transient s Global optimized zone Switching transients Global optimized zone Switching transients
Fig.7(a).3-D analysis for pattern-1
(a) PSO (b) ELPSO (c) ELPSO-P&O
Fig.7(b).3-D analysis for pattern-2
Pow er (W)
(a) PSO (b) ELPSO (c) ELPSO-P&O
Fig.7(c).3-D analysis for pattern-3
Pow er (W) Pow
er (W) Duty
(a) PSO (b) ELPSO (c) ELPSO-P&O
Fig.7(d).3-D analysis for pattern-4
Pow er (W)
Duty
[image:11.612.51.563.59.716.2]PV simulator R-Load
MSO Display
V,I sensors
[image:12.612.88.261.50.178.2]Boost Converter Arduino controller
Fig.13. Hardware prototype developed in laboratory.
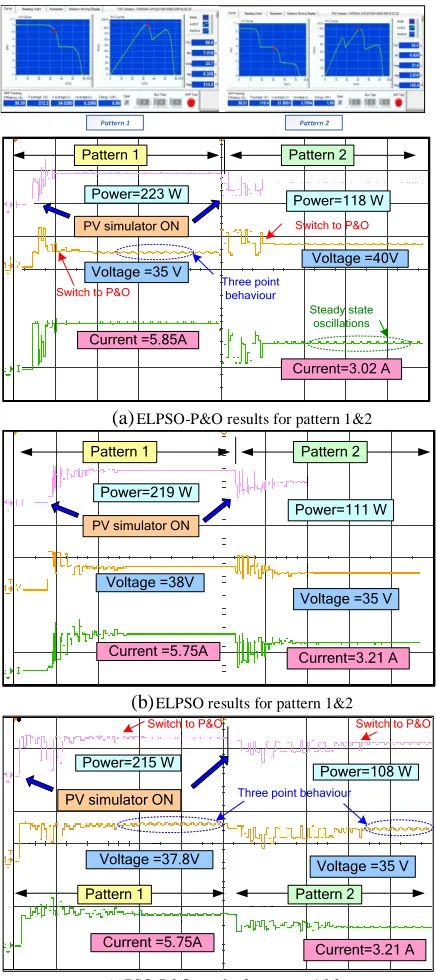
A. Hardware verification of pattern (1) and Pattern (2):
In order to test the dynamic ability of the ELPSO-P&O method under shade conditions, the PV emulator is programmed in such a way that pattern (1) runs for 50 seconds and pattern (2) for 50 seconds. After engaging the PV emulator, the ELPSO-P&O algorithm initializes its particles randomly in the problem search space. Once the global best position is identified in the first iteration and authenticated in subsequent mutations, the immediate switching of P&O is made as shown in Fig.14(a). From the figure, it is seen that the switching of P&O occurs at 10th second and momentarily, the typical three point behaviour of P&O is produced. In both the pattens, ELPSO-P&O has achieved its convergence in minimal time and more importantly with negligible oscillations. More importantly, the mutations in ELPSO have helped the proposed method to detect the global zone quickly. It is also important here to mention that ELPSO in Fig.14(b) has also converged equally as fast as its hybrid version. However, power explored by LPSO in pattern (1) and pattern (2) is only 219W and 111W whereas, ELPSO-P&O manages to get 223W & 118 W respectively. This explains the strong exploitation ability within ELPSO-P&O method and validates its suitability for MPPT applications. On the other hand, hybrid PSO-P&O has also converged to global power but switching transients in pattern (2) are found really high (Fig.14(c)). The figure represented in Fig.14(c) shows that after very long time the PSO-P&O method settles down to its global peak. Since, all the particle needs to converge for global zone, the triggering of P&O in the hybrid approach was delayed to greater extent. Unlike ELPSO, absence of mutations in PSO-P&O has made it to only attain 215 W for pattern (1) and 108W for pattern (2).
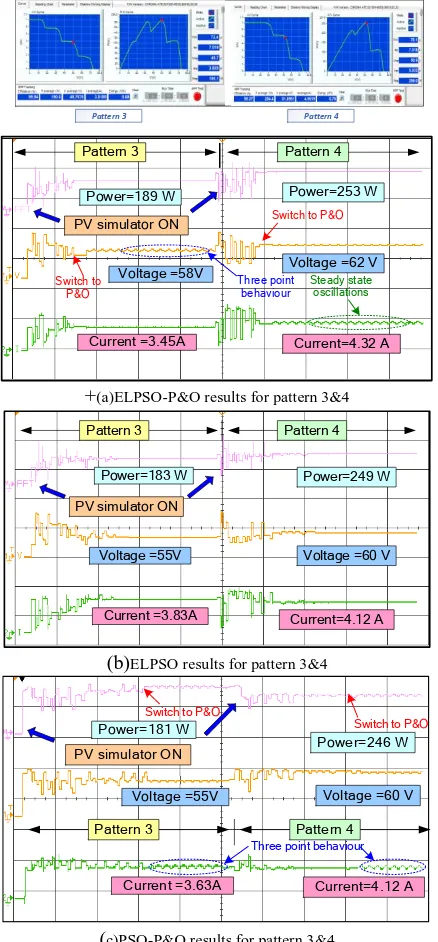
B. Hardware verification of pattern (3) and Pattern (4):
Similar PV pattern settings made in section 2 are also made here for the 4S-2P configuration of pattern (3) and pattern (4). The experimental result pertaining to ELPSO-P&O, ELPSO and PSO methods is shown in Fig.15 (a)-(c). Authenticating simulation results, the LPSO-P&O method has converged to global power for both patterns (3) and (4) and stands superior yet again. Interestingly, when positive slope irradiation changes corresponding to pattern (4) are triggered at 50 seconds, a wide search can be seen being performed by the ELPSO-P&O in initial oscillations. Power obtained using the hybrid LPSO corresponding to pattern (3)
(189W), and pattern (4) (253W), once again proves its potential in exploitation. Early detection of global zones is found as one of the key reasons for ELPSO-P&O success. In case of ELPSO, the power attained is significantly lower and settles faster whereas the hybrid PSO struggles to reach the GMPP with its initial oscillations. Soon after all the particles reach closer to global duty cycle, the P&O is switched and finally the triple point behaviour at convergence is seen. In pattern (3), huge switching transients are seen with the hybrid method because PSO method has struggled to identify GMPP in all the iterative computation.
Pattern 1 Pattern 2
Pattern 1 Pattern 2
Power=223 W Power=118 W
Voltage =40V Voltage =35 V
Current =5.85A
Current=3.02 A
PV simulator ON
Switch to P&O Three point behaviour
Switch to P&O
Steady state oscillations
(a) ELPSO-P&O results for pattern 1&2
Pattern 1 Pattern 2
Power=219 W
Power=111 W
Voltage =38V
Voltage =35 V
Current =5.75A Current=3.21 A
PV simulator ON
(b) ELPSO results for pattern 1&2
Pattern 1 Pattern 2
Power=215 W Power=108 W
Voltage =37.8V Voltage =35 V
Current =5.75A Current=3.21 A
PV simulator ON Switch to P&O
Three point behaviour
Switch to P&O
(c)PSO-P&O results for pattern 1&2
[image:12.612.327.545.193.683.2]Pattern 3 Pattern 4
Power=189 W Power=253 W
Voltage =58V Voltage =62 V
Current =3.45A Current=4.32 A PV simulator ON
Pattern 3 Pattern 4
Switch to P&O
Three point behaviour
Steady state oscillations
Switch to P&O
+(a)ELPSO-P&O results for pattern 3&4
Pattern 3 Pattern 4
Power=183 W Power=249 W
Voltage =55V Voltage =60 V
Current =3.83A Current=4.12 A
PV simulator ON
(b)ELPSO results for pattern 3&4
Switch to P&O
Three point behaviour Switch to P&O
Pattern 3 Pattern 4
Power=181 W
Power=246 W
Voltage =55V Voltage =60 V
Current =3.63A Current=4.12 A
PV simulator ON
(c)PSO-P&O results for pattern 3&4
Fig.15. Hardware results of ELPSO-P&O, ELPSO and PSO-P&O for pattern(3) and (4).
V. CONCLUSION
A hybrid version of Enhanced Leader Particle Swarm Optimization assisted by the P&O method is proposed for detecting the operation of global maximum power point under shade occurrences. It is understood that after the application of mutation in the ELPSO method, switching of P&O is immediately made to operate the system at global MPP. This transition is found to be advantageous over existing MPPT methods in following ways: (i) Reduced complexity (ii) avoids higher initial power oscillations (iii) helps to achieve faster convergence and (iv) reduced thermal stress on switches. With the demonstrations of excellent trade-offs between exploration and exploitation, LPSO-P&O has been shown to be superior in locating global solutions. More importantly, the mutations in LPSO are effectively handled to identify global solutions
where P&O, with lesser step size, is utilized to exploit more power at the GMPP. The case study performed with LPSO-P&O in terms of switching transients and thermal stress validated its success for MPPT implementation.
ACKNOWLEDGMENT
The authors would like to thank the Management, Vellore Institute of Technology (VIT) - Vellore, India for providing the support to carry out research work. This work is carried out at Solar Energy Research Cell (SERC), School of Electrical Engineering, VIT-Vellore. Further, the authors also would like to thank the reviewers for their valuable comments and recommendations to improve the quality of the paper.
REFERENCES
[1] M.G. Villalva and J.R. Gazoli. ―Comprehensive approach to modelling and simulation of photovoltaic arrays‖. IEEE Trans. Power Electron., Vol.24,no.5,pp.1198–1208.,May 2009.
[2] D. S. Pillai and N. Rajasekar, "A comprehensive review on protection challenges and fault diagnosis in PV systems." Renew. and Sust. Energy
Rev., vol. 91, pp. 18-40, Aug. 2018.
[3] Juan David Bastidas-Rodriguez, Edinson Franco, Giovanni Petrone, Carlos Andrés Ramos-Paja and Giovanni Spagnuolo. ―:Maximum power point tracking architectures for photovoltaic systems in mismatching conditions:a review‖. IET Power Electron., Vol. 7, Iss. 6, pp. 1396– 1413, Jan 2014.
[4] Ram JP, Babu TS, Rajasekar N. A comprehensive review on solar PV maximum power point tracking techniques. Renew. and Sust. Energy
Rev., Vol.67, pp. 826-47,Jan 2017.
[5] Ishaque, Kashif, and Zainal Salam. "A deterministic particle swarm optimization maximum power point tracker for photovoltaic system under partial shading condition." IEEE Trans. Ind Electron., Vol.60, no.8 (2013): 3195-3206.
[6] Y. Hu, W. Cao, J. Wu, B. Ji and D. Holliday, "Thermography-Based Virtual MPPT Scheme for Improving PV Energy Efficiency Under Partial Shading Conditions," in IEEE Trans. Power Electron., vol. 29, no. 11, pp. 5667-5672, Nov. 2014.
[7] X. Li, H. Wen, Y. Hu, L. Jiang and W. Xiao, "Modified Beta Algorithm for GMPPT and Partial Shading Detection in Photovoltaic Systems," in
IEEE Trans. Power Electron., vol. 33, no. 3, pp. 2172-2186, March
2018.
[8] Mohammed A. Elgendy, Bashar Zahawi and David J. Atkinson. ―Operating Characteristics of the P&O Algorithm at High Perturbation Frequencies for Standalone PV Systems‖ IEEE transactions on energy
conversion., Vol.30, no.1,pp.189-198, Mar2015.
[9] Azadeh Safari and Saad Mekhilef. ―Simulation and Hardware Implementation of Incremental Conductance MPPT With Direct Control Method Using Cuk Converter,‖ IEEE Trans. Ind Electron., Vol 58, no.4,pp.1154-1161. Apr 2011.
[10] D. Teshome, C. H. Lee, Y. W. Lin and K. L. Lian, ―A Modified Firefly Algorithm for Photovoltaic Maximum Power Point Tracking Control Under Partial Shading,‖ IEEE Journal of Emerging and Selected Topics
in Power Electronics , Vol.5, no.2, pp.661-671, June 2017.
[11] M. A. Ghasemi, H. Mohammadian Forushani and M. Parniani, ―Partial Shading Detection and Smooth Maximum Power Point Tracking of PV Arrays Under PSC,‖ IEEE Trans. Power Electronics, vol. 31, no. 9, pp. 6281-6292, Sept. 2016.
[12] S. Lyden and M. E. Haque, ―A Simulated Annealing Global Maximum Power Point Tracking Approach for PV Modules Under Partial Shading Conditions,‖ IEEE Trans. Power Electronics, vol. 31, no. 6, pp. 4171- 4181, June 2016.
[13] N. Kumar I. Hussain B. Singh B. Panigrahi "Rapid MPPT for uniformly and Partial Shaded PV System by using JayaDE Algorithm in Highly Fluctuating Atmospheric Conditions" IEEE Trans. Ind Informatics., vol.13, no. 5, pp.2406-2416, Oct.2017.
[image:13.612.64.283.51.522.2][15] Ram, J. Prasanth, and N. Rajasekar. "A new robust, mutated and fast tracking LPSO method for solar PV maximum power point tracking under partial shaded conditions.", Applied Energy, 201 (2017): 48-59. [16] Babu, T.S., Rajasekar, N. and Sangeetha, K., ―Modified particle swarm
optimization technique based maximum power point tracking for uniform and under partial shading condition‖. Applied Soft Computing, 34, pp.613-624,2015.
[17] K. Ishaque and Z. Salam, ―An improved particle swarm optimization (PSO)—Based MPPT for PV with reduced steady-state oscillation,‖ IEEE Trans. Power Electron., vol. 27, no. 8, pp. 3627–3638, Jan. 2012. [18] Lian, K. L., J. H. Jhang, and I. S. Tian. "A maximum power point
tracking method based on perturb-and-observe combined with particle swarm optimization." IEEE journal of photovoltaics 4, no. 2 (2014): 626-633.
[19] M. Seyedmahmoudian et al., ―Simulation and hardware implementation of new maximum power point tracking technique for partially shaded PV system using hybrid DEPSO method,‖ IEEE Trans. Sustain. Energy, vol. 6, no. 3, pp. 850–862, Jun. 2015.
[20] Pragallapati, N., Sen, T. and Agarwal, V., 2017. Adaptive Velocity PSO for Global Maximum Power Control of a PV Array Under Non uniform Irradiation Conditions. IEEE Journal of Photovoltaics, 7(2), pp.624-639. [21] K.Sundareswaran, V. Vigneshkumar, PeddapatiSankar, Sishaj P. Simon, P. SrinivasaRaoNayak, and SankaranPalani. ―Development of an Improved P&O Algorithm Assisted Through a Colony of Foraging Ants for MPPT in PV System‖. IEEE Transactions on Industrial Informatics., Vol. 12, No. 1,pp.187-200, Feb 2016.
[22] Jordehi, A. Rezaee. "Enhanced leader PSO (ELPSO): A new PSO variant for solving global optimisation problems." Applied Soft
Computing 26 (2015): 401-417.
[23] He, Yan, Wei Jin Ma, and Ji Ping Zhang. "The Parameters Selection of PSO Algorithm influencing On performance of Fault Diagnosis." In MATEC Web of Conferences, vol. 63, p. 02019. EDP Sciences, 2016. [24] K. Sundareswaran, S. Peddapati, and S. Palani, ―MPPT of PV systems
under partial shaded conditions through a colony of flashing fireflies,‖ IEEE Trans. Energy Convers., vol. 29, no. 2, pp. 1–10, Jun. 2014. [25] Sundareswaran, Kinattingal, Peddapati Sankar, P. S. R. Nayak, Sishaj P.
Simon, and Sankaran Palani. "Enhanced energy output from a PV system under partial shaded conditions through artificial bee colony."
IEEE transactions on sustainable energy Vol.6, no. 1 (2015): 198-209.
[26] C. Sullivan, J. Awerbuch, A. Latham, "Decrease in photovoltaic power output from ripple: Simple general calculation and the effect of partial shading", IEEE Trans. Power Electron, vol. 28, no. 2, pp. 740-747, Feb. 2013.
[27] F. Paz and M. Ordonez, "Zero Oscillation and Irradiance Slope Tracking for Photovoltaic MPPT," in IEEE Transactions on Industrial
Electronics, vol. 61, no. 11, pp. 6138-6147, Nov. 2014.
[28] Pillai, Dhanup S., and N. Rajasekar. "An MPPT based Sensorless Line-Line and Line-Line-Ground Fault Detection Technique for PV systems."
IEEE Transactions on Power Electronics (2018).
J. Prasanth Ram received his B.E. degree in Electrical and Electronics Engineering in 2012 from Bannari Amman Institute of Technology, Sathyamangalam, India and M.E. degree in Power Electronics and Drives in 2014 respectively from Kumaraguru College of Technology, Coimbatore, India. In 2018, he received his Ph.D degree from Vellore Institute of Technology-Vellore. He is currently working as Assistant professor in KPR Institute of Engineering and Technology-(KPRIEnT) - coimbatore. He has worked with various researchers around the universe like Korea, Japan, Denmark, Malaysia and Italy. His areas of interest include Power Electronics, Optimization techniques and Applications of power electronics in renewable energy systems.
Dhanup S. Pillai (M‘19) received his B.Tech degree in Electrical and Electronics Engineering and ME degree in Power Electronics and
Drives from Mahatma Gandhi
University, Kerala, India and Anna
University, Tamilnadu, India
respectively. He was an Assistant Professor with Musaliar College of Engineering & Technology, Kerala, India from 2011 to 2016. Currently, he is working towards his Ph.D. degree at Vellore Institute of Technology-Vellore. His areas of interest include Protection and Fault detection in PV systems, Optimization techniques, Power Electronics and Applications of power electronics to renewable energy systems.
N.Rajasekar (M‘13) received the B.E Degree in Electrical and Electronics Engineering from University of Madras and the M.Tech degree in power electronics & Drives from SASTRA University, Thanjavur, Tamil Nadu respectively. and the Ph.D. degree in electrical engineering
from National Institute of
Technology, Trichy, Tamil Nadu, India, in 2007. From 2005-2010 he was working with Institute of Road and Transport Technology, Erode. Currently, he is a professor in Department of energy and power electronics, School of Electrical Engineering (SELECT), Vellore Institute of Technology-Vellore. He has recently received "SOPHIA LECTURING - RESEARCH GRANT," from Sophia University, Japan. His research interests include Solar PV system, Power Electronics, application of power electronics in renewable energy sources and DC–DC converters.