Advanced Defect Detection Algorithm Using Clustering in
Ultrasonic NDE
Rui Gongzhang
a)and Anthony Gachagan
Centre for Ultrasonic Engineering, University of Strathclyde, Glasgow, G1 1XW
a)Corresponding author: [email protected]
Abstract. A range of materials used in industry exhibit scattering properties which limits ultrasonic NDE. Many algorithms have been proposed to enhance defect detection ability, such as the well-known Split Spectrum Processing (SSP) technique. Scattering noise usually cannot be fully removed and the remaining noise can be easily confused with real feature signals, hence becoming artefacts during the image interpretation stage. This paper presents an advanced algorithm to further reduce the influence of artefacts remaining in A-scan data after processing using a conventional defect detection algorithm. The raw A-scan data can be acquired from either traditional single transducer or phased array configurations. The proposed algorithm uses the concept of unsupervised machine learning to cluster segmental defect signals from pre-processed A-scans into different classes. The distinction and similarity between each class and the ensemble of randomly selected noise segments can be observed by applying a classification algorithm. Each class will then be labelled as 'legitimate reflector' or 'artefacts' based on this observation and the expected probability of defection (PoD) and probability of false alarm (PFA) determined. To facilitate data collection and validate the proposed algorithm, a 5MHz linear array transducer is used to collect A-scans from both austenitic steel and Inconel samples. Each pulse-echo A-scan is pre-processed using SSP and the subsequent application of the proposed clustering algorithm has provided an additional reduction to PFA while maintaining PoD for both samples compared with SSP results alone.
INTRODUCTION
In ultrasonic non-destructive evaluation (NDE), many materials, such as concrete, austenitic steels, alloys and carbon-reinforced composites, exhibit acoustically scattering properties which degrades the inspection resolution. Target echo pulses can be embedded in a strong grain noise background, even when the defect is much larger in size than the grain boundaries surrounding it. This structure noise, sometime referred as grain noise or speckle noise, is time invariant hence cannot be eliminated by traditional time averaging techniques. Additionally, this grain noise is difficult to remove by applying filtering, since it is distributed irregularly in a wide frequency band. Lowering the transducers frequency can avoid this but the system resolution will suffer from a corresponding reduction in resolution.
Many techniques have been developed to reduce this grain noise and enhance the detectability. Most of the algorithms are based on either spatial diversity or frequency diversity. With the introduced of phased array transducers in recent years, spatial diversity based techniques can be easily applied since different array elements can observe a target from different orientations. Algorithms such as Focused B-scans [1], Total Focusing Method (TFM) [1], minimum variance beamforming and adaptive processing [2, 3], Spatially Averaged Sub-Array Correlation Imaging (SASACI) [4], have already achieved promising success in noise reduction.
Frequency diversity based techniques such as the well-known Split Spectrum Processing (SSP) have also been developed. Importantly, unlike spatial diversity techniques, frequency diversity is suitable for both single transducer and array approaches.
SSP algorithm is based on the assumption that superposed grain noise in the received A-scans is more sensitive to frequency compared with a legitimate reflector (flaw, artificially drilled hole and back wall). It splits the signal bandwidth into several narrow sub-band signals (sub-signals), and reconstructs the signal using non-linear algorithms to reduce the coherent structural noise. The non-linear reconstruction can be either considered using amplitudes of each sub-signal (Minimization, MIN [7]) or phase information (Polarity Tresholding, PT [8]). However, due to the well-known fact in literature that SSP is highly sensitive to its parameter tuning [8], the optimal performance is hard to achieve. This may result in scattering noise not being fully eliminated, hence becoming artefacts, which can be easily confused with the echoes from legitimate reflectors.
An advanced algorithm, Moving Bandwidth Polarity Thresholding (MBPT) [9], has been developed to solve the sensitivity problems of SSP. However, MBPT also cannot fully remove such artefacts and hence, cannot maintain a high defect detectability.
Other advanced techniques have also been proposed to improve the performance of frequency diversity based algorithms. Many of them are prototype based, like Optimal Detection (OD) [10], which trains the algorithm with pre-knowledge of the tested sample, then builds a suitable model accordingly to increase the accuracy.
A recently developed prototype based algorithm name Fragment Recognition Classifier (FRC) [11] uses a supervised classification algorithm to extract the legitimate reflector signals from the grain noise. FRC is firstly trained by pre-acquired segmental signals from the tested sample, which contains a group of legitimate reflector segmental signals and a group of noise segmental signals. By learning the spectrum properties of these two groups, FRC can then classify the new input segments for raw A-scan signals into either legitimate reflector or grain noise.
Prototype based algorithms can have more accurate performance since they are able to auto adjust themselves to adapt the signals acquired from tested samples with different properties. However, high quality training data is not always available. Consequently, the performance of prototype based algorithms may be less when compared with traditional techniques, if the training is inappropriate.
For these reasons, this paper presents a new algorithm named Potential Real Defect Miner (PRDM), which can improve the accuracy of the detection without acquiring any training data in advance. The algorithm was inspired by prototype classification algorithms, like FRD. It uses an unsupervised clustering algorithm to group all the segmental artefact signals generated by traditional A-scan based noise reduction techniques, and then uses a supervised classification algorithm to extract the potential legitimate reflectors among them.
METHODOLOGY
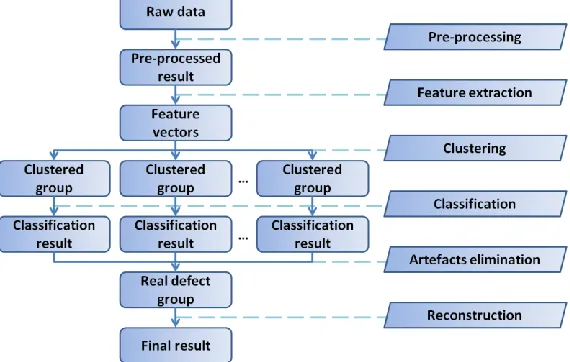
[image:2.612.171.456.485.666.2]The procedure of PRDM can be described in six steps, as illustrated in the flowchart presented in Fig. 1.
Pre-processing
Unlike a supervised algorithm, clustering algorithms are unsupervised and hence it cannot classify the input data based on one’s expectation. It can only divide the data into groups with similar characteristics. Therefore, raw A-scans are not suitable to be directly processed by PRDM. There are two reasons. Firstly, using raw A-scan data will greatly increase the potential number of clustered groups, hence significantly increasing the complexity of computation. Secondly, since most of the segments in raw A-scans only contain noise, the significant imbalance between noise and legitimate reflectors will cause the legitimate reflector segments to be easily mismatched with one of the noise groups.
Hence, pre-processing is required by other A-scan based defect detection techniques, such as SSP, to remove the majority of grain noise and only keeping echoes contain legitimate reflector along with some remaining artefacts.
Feature Extraction
After the raw A-scans have been processed, segmental signals will be selected from all the locations which have potential to be flaws. The size of the segment relies on the transducer frequency, sampling rate and emitted signal characteristic. Feature vectors can then be extracted from these segments using a range of different methods. A common way to achieve this is to apply a Short Time Fourier Transform (STFT). Extracted features can be treated as an N-dimensional vector.
}
,
,
{
1 2 Nm
v
v
v
V
(1)where 𝑉𝑚 is the extracted feature vector corresponding to a segmental signal.
Clustering
The aim of clustering is to regroup all the selected segmental signals into several groups, using their extracted feature vectors. Each group contains segmental signals with similar characteristics.
There are a lot of well-developed clustering algorithms. k-means [12] is one of the most famous and commonly used algorithms and is used in this paper. The main concept of k-means is to define k centers, one for each cluster. The algorithm then calculates the distance between each input vector point and the center point pairing and subsequently, group each input point with its nearest center. After this step, re-calculate the center of each cluster, then repeat until no more changes are required and the center of each cluster is constant.
To ensure the segments that contain real flaw signals will be separate from the artefact signals, the total number of groups should be no less than 10.
Classification
The clustered results can now be further processed using a classification algorithm. Unlike clustering algorithms, classification algorithms are supervised which requires pre-acquired data from each category to train the algorithms. In this case, there are two categories, segments contain legitimate reflector and segments contain grain noise. Since the legitimate reflector echoes should be contained in one (or more) of the clustered group and in pulse-echo mode the majority part of the received signal contains no flaw echo, the training data required for these two categories can be selected from the clustered segments and the rest part of the raw signal respectively. In other words, a large set of segments randomly selected from different signals and different locations can be trained as the 'noise' category, and then a group can be chosen that was clustered in the previous step to be trained as a 'reflector'. The entire raw dataset can then be classified using the trained data and repeated for all clustered groups.
There are a lot of well-developed pattern recognition techniques. In this paper, the support vector machine (SVM) has been used. SVM is a linear classifier that maps the sample space into a higher dimensional space or even into an infinite dimensional feature space (Hilbert space). The SVM trains and classifies the sample data using the following equation [13]:
i i i m m
A
f
S
V
B
V
C
(
)
(
,
)
(2)Artefacts Elimination
For each group, if only a small number of segments in the raw dataset have been classified as 'reflector', then the selected group contains the real flaw signals. Label this group as 'legitimate reflector'. Otherwise, label it as ‘artefact’. The decision that a classified 'reflector' group is small or not is based on the detection rate of the pre-processed algorithm. The detection rate is define as,
%
100
segments
all
segments
detected
of
number
detect
P
(3)Since the proposed algorithm aims to remove artefacts from the pre-processed results, the classified 'defect' number should not exceed the detected echoes number in the pre-processed results. Hence, if the percentage rate of segments being classified as a 'reflector' using a group over all segments in raw data is larger than 𝑃𝑑𝑒𝑡𝑒𝑐𝑡, then this group is most likely to belong to artefact. If more the one group has been labelled as ‘legitimate reflector’, these groups should be combined and steps D and E repeated.
Reconstruction
The classified 'legitimate reflector' is labelled as 1 and noise as 0. Hence, after all segments in an A-scan signal have been classified, a binary signal will be generated. This binary signal can be used to imply the position of the legitimate reflectors. However, this binary signal is too dictatorial for saying a fragment in the A-scan trace belongs to a legitimate reflector or noise. An improved method is to consider all the segments that contain this point and average their classification results.
L
V
C
n
P
n L n
m m
{
}
)
(
(4)where 𝑃 is the probability profile, 𝑛 is a point in the A-scan trace, 𝑉𝑚 is the feature vector of a segment which has a starting point at 𝑚 and a length of 𝐿. 𝐶 is the classification result of the vector, either ‘0’ or ‘1’.
After the binary signal has been smoothed, it can be used to reduce the artefact noise by weighting the raw signal. This will indicate the location of legitimate reflectors, while keeping their original information like amplitude / shape.
EXPERIMENTAL RESULTS
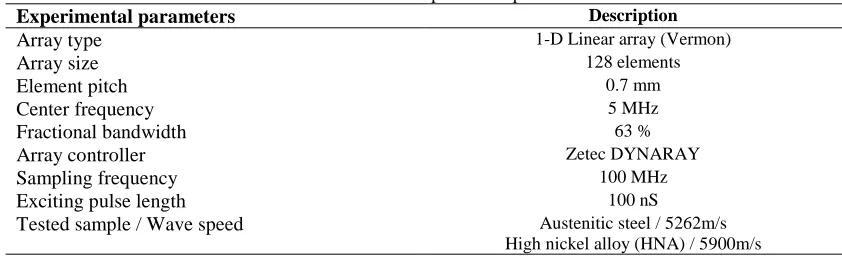
[image:4.612.94.515.552.681.2]To validate the proposed algorithm, experimental data was acquired from two different samples. A High Nickel Alloy (HNA) sample with a 46 mm back wall and an austenitic steel sample with a 78 mm back wall, as shown in Fig. 2. A-scans data was captured by a 5MHz linear array to facilitate data collection, using a commercial ultrasonic phased array controller, Zetec DYNARAY which is controlled by a MATLAB (The MathWorks, Inc., Natick, MA) script. Details of the samples are provided in Table 1 along with details of the experimental configuration.
TABLE 1. Details of experimental parameters
Experimental parameters Description
Array type 1-D Linear array (Vermon)
Array size 128 elements
Element pitch 0.7 mm
Center frequency 5 MHz
Fractional bandwidth 63 %
Array controller Zetec DYNARAY
Sampling frequency 100 MHz
Exciting pulse length 100 nS
FIGURE 2. Austenitic steel and HNA
In both experiments, the SSP algorithm is used for pre-processing. As introduced before, SSP splits the raw A-scan into different frequency channels and rebuilds them using different reconstruction methods. The most commonly used approaches MIN and PT are used in this work.
For a given time instance, MIN calculates the minimum absolute value among all frequency channels:
)
)
(
)
(
,
)
(
min(
)
(
n
ch
1n
ch
2n
ch
n
MIN
X (5)where 𝑐ℎ𝑋 denotes the frequency channel and its index and 𝑛 is a point in the A-scan trace.
While PT aims to find out all time instances that have coincident sign among all frequency channels, in addition to finding the minimum value. The output of PT is expressed as:
otherwise
,
0
0
)
(
all
or
0
)
(
all
if
),
)
(
)
(
,
)
(
min(
)
(
n
ch
1n
ch
2n
ch
n
ch
n
ch
n
PT
X X X (6)Spectral Analysis
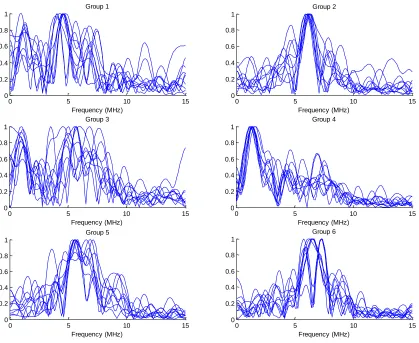
Segmental signals acquired from the austenitic steel sample are used in this section for analysis. After been processed by the PT algorithm, all segmental signals that contain echo peaks (could be either a legitimate reflector or artefact noise) were selected. STFT was used here to extract the feature from these tested segmental signals. The lowest feature extraction frequency point was to be chosen at 1MHz and the highest frequency point was chosen at 10 MHz, to ensure that more features can be extracted from the spectrum. Spectra are normalised first to remove the influence of attenuation. Feature vectors 𝑉𝑚 are conducted by points that extracted equidistantly from the spectra of segments.
Figure 3 shows the normalized spectra from 6 different groups after been clustered. 10 individual spectra were chosen from each group. It can be easily seen that the spectra in each group have a similar characteristic, which is variant between different groups. Table 2 gives the percentage of segmental signals in the raw data that been classified as a 'reflector' using each group. Only Group 4 has a significantly small percentage rate compared with the detection rate of PT, which indicates it should be the only group belongs to legitimate reflector.
Experiment 1
As discussed in the previous Section, Group 4 has the smallest percentage rate and it is most likely to belong to legitimate reflector. A PRDM processed A-scan example is shown in Fig. 4 (c), together with the raw A-scan signal, Fig. 4(a), and the corresponding PT results is presented in Fig. 4(b).
Although PT has greatly eliminated the grain noise from the raw signal and correctly shows the location of the back wall at around 78 mm, many artefacts have been retained.
It can be easily seen that after further processing by PRDM, most artefacts in the PT result have been removed, while the 78 mm back wall echo has been retained.
FIGURE 3. Spectra of different clustered groups
TABLE 2. Percentage rate of clustered groups
Detection rate of PT 29%
Group 1 64.1%
Group 2 44.3%
Group 3 81.3%
Group 4 9.1%
Group 5 57.6 %
Group 6 61.2%
The Probability of Detection (PoD) and Probability of False Alarm (PFA) of PT and the proposed PRDM algorithm are given in Table 3, to quantify and compare their performance. The PoD is the likelihood, expressed as a percentage, that an algorithm has correctly identified a legitimate reflector, while the PFA is the likelihood, again expressed as a percentage, that an algorithm has incorrectly classified a noise peak into defect. Interestingly, the PoD for both PT and PRDM is similar, but importantly the PFA for PRDM is significantly less when compared to the PT algorithm.
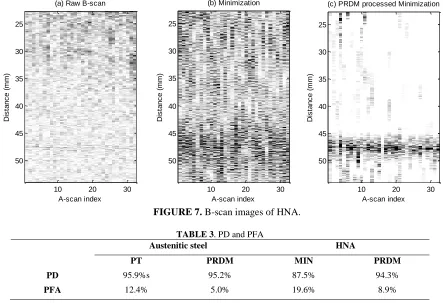
Experiment 2
Figures 6 and Fig. 7 provide additional experimental results using HNA sample and pre-processed using the Minimization algorithm. Interestingly, when compared with Fig. 5, the proposed algorithm not only reduces the artefacts, but also greatly enhanced the visibility of the back wall. As can be seen in Fig. 6 (b), the echo peak of the back wall at around 46 mm is smaller in comparison to the noise peak in the data/signal preceding it. The back wall
0 5 10 15 0
0.2 0.4 0.6 0.8 1
Frequency (MHz) Group 1
0 5 10 15 0
0.2 0.4 0.6 0.8 1
Frequency (MHz) Group 2
0 5 10 15 0
0.2 0.4 0.6 0.8 1
Frequency (MHz) Group 3
0 5 10 15 0
0.2 0.4 0.6 0.8 1
Frequency (MHz) Group 4
0 5 10 15 0
0.2 0.4 0.6 0.8 1
Frequency (MHz) Group 5
0 5 10 15 0
0.2 0.4 0.6 0.8 1
illustrated in Fig. 7 (c) is much clearer than observed in Fig. 7 (b). As a comparison of the performance, PoD and PFA are also given in Table 3 and in this case, PDRM outperforms PT in terms of both PoD and PFA.
FIGURE 4. A-scan examples of Austenitic steel.
FIGURE 5. B-scan images of Austenitic steel.
FIGURE 6. A-scan examples of HNA.
30 40 50 60 70 80 90
-2000 0 2000
Distance (mm) (a) Raw A-scan
30 40 50 60 70 80 90
0 20 40
Distance (mm) (b) Polarity Thresholding
30 40 50 60 70 80 90
-2000 0 2000
Distance (mm)
(c) PRDM Processed Polarity Thresholding
A-scan index D is ta n c e ( m m )
(a) Raw B-scan
10 20 30
30 40 50 60 70 80 90 A-scan index D is ta n c e ( m m )
(b) Polarity Thresholding
10 20 30
30 40 50 60 70 80 90 A-scan index D is ta n c e ( m m )
(c) PRDM processed Polarity Thresholding
10 20 30
30 40 50 60 70 80 90
25 30 35 40 45 50
-5000 0 5000
Distance (mm) (a) Raw A-scan
25 30 35 40 45 50
0 50 100
Distance (mm) (b) Minimization
25 30 35 40 45 50
-2000 0 2000
Distance (mm)
[image:7.612.84.536.103.641.2]FIGURE 7. B-scan images of HNA.
TABLE 3. PD and PFA
Austenitic steel HNA
PT PRDM MIN PRDM
PD 95.9%s 95.2% 87.5% 94.3%
PFA 12.4% 5.0% 19.6% 8.9%
CONCLUSIONS AND FUTURE WORK
An advanced spectrum-based algorithm based on A-scan signal processing is presented in this paper, named Potential Real Defect Miner (PRDM). The PRDM algorithm aims to remove the artefact noise that is introduced by other traditional A-scan based defect detection algorithm, using both unsupervised and supervised machine learning techniques. Feature vectors are extracted from the spectra of the segmental signals, and are used as input arguments to the clustering and classification algorithms. Initial experimental results show the proposed PRDM technique has successfully reduced the number of artefacts compared with traditional SSP approaches. Future work will include enhance feature extraction to make the algorithm more robust and combining the approach with array imaging algorithms.
ACKNOWLEDGMENTS
The authors wish to thank E.ON for the supply of samples and for support towards this PhD studentship.
REFERENCES
1. C. Holmes, B. Drinkwater, and P. Wilcox, NDT & E International, 38, 701-711 (2005). 2. M. Li and G. Hayward, Sensors, 12, 42-54 (2012).
3. M. Li, G. Hayward and B. He, “Adaptive Array Processing for Ultrasonic Non-destructive Evaluation,” in
Proceedings IEEE International Ultrasonics Symposium (IUS), Orlando FL, 2011, pp. 2029-2032.
4. T. Lardner, M. Li, R. Gongzhang and A. Gachagan, “A New Speckle Noise Suppression Technique Using Cross-correlation of Array Sub-apertures in Ultrasonic NDE of Coarse Grain Materials,” in Review of Progress in Quantitative Nondestructive Evaluation, eds. D. O. Thompson and D. E. Chimenti, (American Institute of Physics 1511, Denver CO), 32, 865-871 (2013).
A-scan index
D
is
ta
n
c
e
(
m
m
)
(a) Raw B-scan
10 20 30
25
30
35
40
45
50
A-scan index
D
is
ta
n
c
e
(
m
m
)
(b) Minimization
10 20 30
25
30
35
40
45
50
A-scan index
D
is
ta
n
c
e
(
m
m
)
(c) PRDM processed Minimization
10 20 30
25
30
35
40
45
5. B. Xiao, M. Li, R, Gongzhang, R. L. Leary and A. Gachagan, “Image De-noising Via Spectral Distribution Similarity Analysis for Ultrasonic Non-destructive Evaluation,” in Review of Progress in Quantitative Nondestructive Evaluation, eds. D. E. Chimenti, L. J. Bond and D. O. Thompson, (American Institute of Physics 1581, Baltimore, MA), 33, 1941-1947 (2014).
6. R. Gongzhang, A. Gachagan and B. Xiao, “Clutter Noise Reduction for Phased Array Imaging Using Frequency-spatial Polarity Coherence,” in Review of Progress in Quantitative Nondestructive Evaluation, eds. D. E. Chimenti and L. J. Bond, (American Institute of Physics 1650, Boise, ID), 34, 1648-1656 (2015). 7. M. Karaoguz, N. Bilgutay, T. Akgul and S. Popovics, “Defect Detection in Concrete Using Split Spectum
Processing” in Ultrasonics Symposium-2012., IEEE International, Melville, NY, 2002, pp. 651-654.
8. M.G. Gustafsson, IEEE Transactions on Ultrasonics, Ferroelectrics and Frequency Control, 43, 109-124 (1996).
9. R. Gongzhang, M. Li, B. Xiao, T. Lardner and A. Gachagan, “Robust Frequency Diversity Based Algorithm for Clutter Noise Reduction of Ultrasonic Signals Using Multiple Sub-spectrum Phase Coherence,” in Review of Progress in Quantitative Nondestructive Evaluation, eds. D. E. Chimenti, L. J. Bond and D. O. Thompson, (American Institute of Physics 1581, Baltimore, MA), 33, 1948-1955 (2014).
10. M. G. Gustafsson, IEEE Transactions on Ultrasonics, Ferroelectrics and Frequency Control, 43, 109-124 (1996).
11. R. Gongzhang, M. Li, T. Lardner and A. Gachagan, “Robust Defect Detection in Ultrasonic Non-Destructive Evaluation (NDE) of Difficult Materials” in Ultrasonics Symposium-2012, (IEEE International, Dresden, 2012), pp. 467-470.
12. D. Mackay, Information Theory, Inference, and Learning Algorithms (Cambridge University Press, Cambridge, 2003).