An Improvement in Outlier Detection Using
Fuzzy Eclarance Clustering Algorithm for
Data Mining
Ram Krishna Paramhans, Rupesh Kumar Jindal
Department of CSE, Sharda University, Gr. Noida, India
Asst. Professor Department of CSE, Sharda University, Gr. Noida, India
ABSTRACT: Outlier detection is very essential of any modelling exercise. A failure to detect outliers or their ineffective handling can have serious ramifications on the strength of the inferences drained from the exercise. In my paper, we present a new technique, called the Fuzzy ECLARAN Spectral, which attempts to detect projected outliers in high-dimensional data streams. F-ECLARANS employs an innovative window-based time model in capturing dynamic statistics from stream data, and a novel data structure containing a set of top sparse subspaces to detect projected outliers effectively. F-ECLARANS also employs rule based Fuzzy as an effective search method for finding the outlying subspaces where most projected outliers are embedded. The experimental results demonstrate that. F-ECLARANS is efficient and effective in detecting projected outliers for high-dimensional data streams. The main contribution of this paper is that it provides a backbone in tackling the challenging problem of outlier detection for high dimensional data streams. F-ECLARANS can facilitate the discovery of useful abnormal patterns and can be potentially applied to a variety of high demand applications, such as for sensor network data monitoring, online transaction protection, as compare to PAM, CLARA, and CLARANS etc. that optimized root mean square Error(RMSE), precision, recall and f-measure which is simulated in MATLAB 2014Ra environment.
KEYWORDS: Data mining, Outlier detection, PAM, CLARA,CLARANS, F-ECLARANS, root mean square
Error(RMSE), precision, recall and f-measure clustering, Hierarchical clustering, numerical data etc.
I. INTRODUCTION
Outlier detection is an important research problem in data mining that aims to find objects that are considerably dissimilar, exceptional and inconsistent with respect to the majority data in an input database [6]. In recent years, we have witnessed a tremendous research interest sparked by the explosion of data collected and transferred in the format of streams. This poses new opportunities as well as challenges for research efforts in outlier detection. A data stream is a real-time, continuous and ordered (implicitly by arrival sequence or explicitly by timestamp) sequence of items. Examples of data streams include network traffic, telecommunications data, financial market data, and data from sensors that monitor the weather and environment, surveillance video and so on. Outlier detection from stream data can find items (objects or points) that are abnormal or irregular with respect to the majority of items in the whole or a horizon/window of the stream. Outlier detection in data streams can be useful in many fields such as analysis and monitoring of network traffic data (e.g., connection-oriented records), web log, wireless sensor networks and financial transactions, etc.
II. RELATED WORK
the accuracy of appreciations and CLARANS moderates the while complication when paralleled with extra algorithms. Supplementary work besides lies in this presentation. We resolution use this concealment of outliers aimed at our prospect business and affectionate to decrease the phase complexity of the proposed algorithm.
Chuang-Cheng [12] projected a novel consortium scheme for shepherding the k-anonymity typical meritoriously. In the anticipated collecting method, mouth burdens are inevitably adjusted so that the evidence alteration can be concentrated. A set of experimentations show that the projected method possesses the support of scalability in accumulation computational effectiveness when likening to added popular bundling procedures. The resemblance between this technique and our application method in the intensifying the evidence alteration. The modification in clustering procedure that is castoff and discretion procedure.
Mohd - Al- Zoubi [14] This tabloid is probable a new resourceful method aimed at outlier uncovering. The projected method is grounded on fuzzy huddling performances. The c-means procedure is first implemented, and before small gatherings are unwavering and painstaking as outlier assemblies. Other outliers are formerly strong-minded based scheduled computing modifications between objectives occupation values while topics are provisionally removed since the figures set. If a perceptible change transpired on the unbiased function morals, the opinions are painstaking outliers. Examination results stood consummate on dissimilar recognized data gangs in the data excavating non-fiction. The results exposed that the planned method gave upright results. The test fallouts show that the wished-for attitude gave operative results while applied to diverse data sets. Nonetheless, their wished-for process is very stretch overriding. This is since the FCM procedure has to run n epochs, anywhere n is the character of points in a regular. This will remain our attention in the imminent work.
Barkha andH. Desai[2] paralleled the K-Mean styles crowding algorithms alike K-Mean, Weighted-K-Mean then Group-Weighted-K-Mean. A captain problematic of using the K-Mean type process cannot choice variables mechanically for the reason that they delicacy all variables likewise in the bunching procedure. Then we exist played the difficulties of outliers. To overwhelm this unruly several system has remained proposed lone of this procedure is WK-Mean. WK-Mean enlarge a novel step to the elementary K-Mean set of rules to modernize the variable weights centred on the modern partition of files. The adjustable weights fashioned by WK-Mean capacity the standing of variables in collecting. The slight weights diminish or eradicate the result of blaring variables. WK-Mean, finished it answers the problematic of capricious selection then it doesn’t sustenance for outsized dataset so additional system has been suggested by, christened GWK-Mean. GWK-Mean is superior than K-Mean and WK-Mean, for the reason that it concentrated the weight of noise variables and advances the accurateness of clustering practice.
C.Sumithiradevi[16] This paper the investigators have familiarized a Heightened K-Mean without Greedy procedure for Outlier Recognition which is an enhancement over the K-Mean process for outlier gratitude. Through the initialization segment of the grasping procedure, each chronicles is pigeonholed as non-outliers besides hash counters for potentials are also erected and modernised .In the covetous procedure, the dataset is flick through for k periods to determine exact k outliers that is, one outlier is establish and indifferent in each authorization .In each scan finished dataset, recited each highest t that is epitomised as non-outliers, its sticker is different to outlier besides the reformed entropy custody is calculated. A greatest that undertakes maximal entropy importance impact is selected as outliers in existing scan and gathered to the established of outliers. This mixture method is used to spontaneously perceive and eradicate outliers and therefore help in collective the gathering exactness. The anticipated system has less Means Sharpened Error and implementation time. Next stretch progress this method with variegated dataset.
III. METHODOLOGY
On doing the literature survey of various methods for outlier detection we come to the conclusion that to detect outlier in cluster there are multiple approaches like
PAM
CLARA
CLARANS
Fuzzy- ECLARANS Spectral
In an outlier detection application, precision is defined as the fraction of anomalies that the detection method correctly identifies, i.e.,
Precision = |{anomalies correctly detected by the detection method}| /|{anomalies detected by the detection method}| Recall is defined as the fraction of true anomalies that are successfully identified by the detection method, i.e., Recall = |{anomalies correctly detected by the detection method}|/ |{true anomalies}|
F-measure is the metric combining precision and recall into a single measure for performance evaluation. It is defined as
f= 2 × precision × recall / precision + recall
EXISTING CLUSTERING ALGORITHM PAM Procedure
1. Input the dataset D
2. Randomly select k objects from the dataset D
3. Calculate the Total Cost T for each pair of selected Si and non-selected object Sh 4. For each pair if T si< 0, then it is replaced Sh
5. Then find similar medoid for each non-selected object 6. Repeat steps 2, 3 and 4, until find the medoids.
CLARA Procedure
1. Input the dataset D 2. Repeat n times
3. Draw sample S randomly from D 4. Call PAM from S to get medoids M. 5. Classify the entire dataset D to Cost1...costk
6. Calculate the average dissimilarity from the obtained clusters
CLARANS Procedure
1. Input parameters numlocal and maxneighbour. 2. Select k objects from the database object D randomly.
3. Mark these K objects as selected Si and all other as non-selected Sh. 4. Calculate the cost T for selected Si
5. If T is negative update medoid set. Otherwise selected medoid chosen as local optimum. 6. Restart the selection of another set of medoid and find another local optimum.
7. CLARANS stops until returns the best.
ECLARANS Procedure
1. Input parameters numlocal and maxneighbour. Initialize i to 1, and mincost to a large number. 2. Calculating distance between each data points
3. Choose n maximum distance data points 4. Set current to an arbitrary node in n: k 5. Set j to 1.
6. Consider a random neighbor S of current, and based on 6, calculate the cost differential of the two nodes. 7. If S has a lower cost, set current to S, and go to Step 5
8. Otherwise, increment j by 1. If j maxneighbour, go to Step 6.
9. Otherwise, when j >maxneighbour, compare the cost of current with mincost. If the former is less than mincost, set mincost to the cost of current and set best node to current.
DATASET
Dataset which have been used in this research work is Numerical data set; it contains 500 instances and 2 attributes. Data stream is an abundant flawless sequence of data and it is not possible to storethe complete data stream, due to this reason we divide the data into chunks of same size in different result.
Table 1: Dataset
Dataset No of Point set No of sample Dataset Type
Case-1 280 30, 30, 180,40 Randomized data(Dynamic)
Case-2 500 40,30,100,30 Static data
Case-3 440 30, 150,30,200,30 Binary data(Static)
Case-4 340 40,40,40,40,160 Binary data(Dynamic)
Case-5 350 100,100,150 Randomized data(Dynamic)
Case-6 320 160,40,30,30,30,30 Randomized data(Static)
PROPOSED METHOD
FUZZY ENHANCED CLARANS (F-ECLARANS): This method is different from PAM, CLARA CLARANS AND ECLARANS. Thus method is produced to improve the accuracy of outliers. F-ECLARANS is a partitioning algorithm which is an improvement of CLARANS to form clusters with selecting proper nodes instead of selecting as random searching operations on the basis of rule base system. The algorithm is similar to ECLARANS but these selected nodes reduce the number of iterations of CLARANS ECLARANS Procedure. The Previous research established PAM, CLARA, CLARANS, and ECLARANS as an effective algorithm for outlier detection but till now it doesn’t have better time complexity thus by this research work we can also achieve this.
The modified algorithm fuzzy-ECLARNS Procedure
1. Input parameters number local and max neighbour. Initialize i to 1, and min cost to a large number. 2. Calculating distance between each data points for calculation select those points which has not been visited. 3. Select the maximum distance data points.
4. Set current to that node which is having highest distance if it is not been visited. 5. Set j to 1.
6. Consider a random neighbour S of current, and based on 6, calculate the cost differential between two nodes. 7. If S has a lower cost, set current to S, and go to Step 5.
8. Otherwise, increment j by 1. If j max neighbour, go to Step 6.
9. Otherwise, when j > max neighbour, compare the cost of current with min cost. If the former is less than min cost, set min cost to the cost of current and set best node to current.
10. Increment i by 1. If i>num local, output best node and halt. Otherwise, go to Step4.
PROPOSED DESIGN
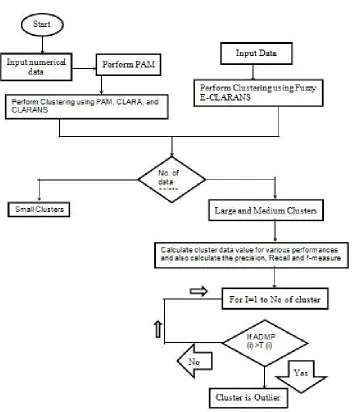
Figure 1:Process flow diagrams for proposed system.
In the next step, the average number of points in „k‟ cluster is calculated (AKN) and the clusters are segregated as small and large clusters. All those clusters which have less than half of AKN are declared as small cluster. These small clusters are removed from the datasets as outliers or noise. The outliers in the large clusters are then detected using the
following procedure. First, the Absolute Distances between the Medoid (μ) (ADMP) of the current cluster and each one
of the points (pi) is calculated. A threshold value is calculated as the average of all ADMP values of the same cluster multiplied by 1.5. When the ADMP value of a cluster is greater than T, then it is an outlier, else it is an inlier.
IV. EXPERMENTAL RESULTS
ANALYSIS ECLARANS and F-ECLARANS
Above algorithms are implemented in MATLAB. Their point valuesare compared i.e. time taken by them to detect the
outlier using above approaches. Point set taken the numerical data set and applied all above algorithms which produce
Figure 2: Cluster Model using dataset Figure 3: Data points made 6 group of cluster
In above figure 2 Numerical datagroup linkage of point at 500 data, the point starts fragmenting into smaller parts, while before it was still connected to the second largest due to the single-link effect.This information is collected for each attribute of outlier detection cluster during the learning process separately for outlier detection for data mining, and each point set precise with different number of sample values, which refine for radius in between data point to another.
The figure 3 show that the results of 6 group cluster data at iteration 1 i.e. 50 outliers detected within 12.63 second (produced by ECLARANS algorithm) at point se 500.
Each clustering technique having own group and individual processing time for reproduce different number of group in distance base alignment.
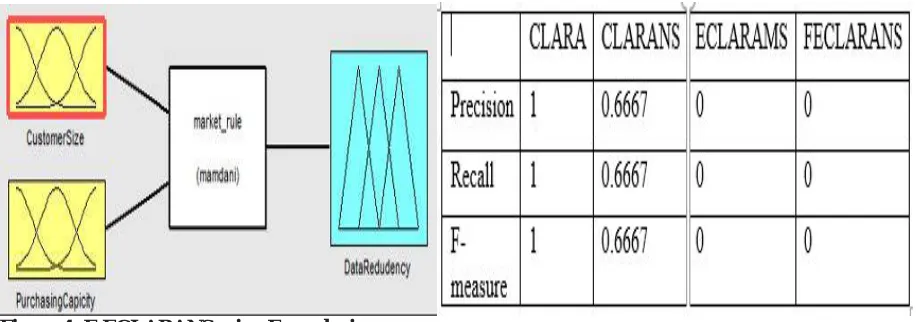
Table 2: Precision, Recall, F-measure Value.
Figure 4: F-ECLARANS using Fuzzy logic
1. If (CustomerSize is high) and (PurchasingCapicity is min) then (DataRedudency is sleep)
2. If (CustomerSize is high) and (PurchasingCapicity is max) then (DataRedudency is long)
3. If (CustomerSize is low) and (PurchasingCapicity is min) then (DataRedudency is short)
4. If (CustomerSize is low) and (PurchasingCapicity is max) then (DataRedudency is sleep)
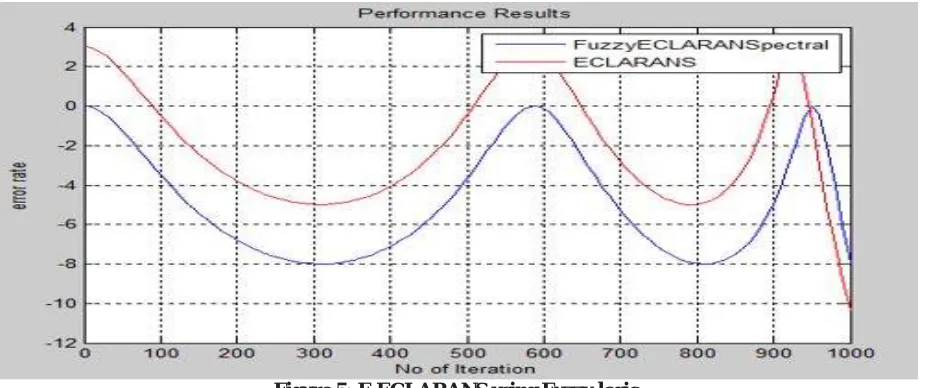
Figure 5: F-ECLARANS using Fuzzy logic
In this figure we can see that the error value of ECLARANS is more than F-ECLARANS
Performance of Proposed Clustering technique specification given below table
Table 3: RMSE Table for F-ECLARNS and ECLARNS Technique.
No of Iterations Fuzzy-ECLARNS(Proposed)
RMSE
ECLARNS
RMSE
100 -4.2 -1.1
200 -6.8 -4.1
300 -8 -4.2
400 -7.1 -4
500 -4 -1.3
600 0 3.1
700 -5 -3
800 -8 -5
900 -5 0.1
1000 -10 -8.1
The major difference in RMSE when increasing the processing rate for large data point set, above table specification in each iteration mean square error finding best difference, as per individual iteration for 900 having major accuracy i.e. in the form of percentage of 49.99% more improved as compare to ECLARNS(existing) technique.
V. CONCLUSION
The summary of this work, the outlier may be due to the unavailability or distortions in the data collection stage that consists of irrelevant or weakly relevant data objects. From the algorithms, it is shown that by choosing a valid outlier
score, the overall performance of the algorithm can be improved. The above analysis conducted using the Fuzzy
ECLARANS shows the cluster-based outlier detection algorithm producing better accuracy than distance based outlier
result of different Clustering techniques in terms of time complexity and proposed a new solution by adding fuzzy technique that minimizing root mean square error approximately 900 iterations (means maximum number of iteration when data point get large) having -4.9 minimum as compare to existing ECLARNS(that was proposed for later on author literature), it means Fuzzy-ECLARNS spectral showing 49.99% more improved compare to ECLARNS efficiency.As future lies, further advancement is going on in outlier detection methods. More work is being done on the basis offuzzy approach in clustering techniques. It helps in detection of outlier for imprecise and incomplete data set.
REFERENCES
[1] Varun Chandola and Banerjee and Kumar,” Outlier Detection: A Survey”.
[2] H. Desai, “Comparative Study of K‐means Type Algorithms”, UNIASCIT, Vol. 2, 2011.
[3] S.Vijayarni and S.Nithya, “An Efficient Clustering Algorithm for Outlier Detection”, (IJCS) Vol.32, October 2011
[4] Jae-Gil, “Trajectory Outlier Detection: A Partition-and-Detect Framework”, Department of Computer Science, University of Illinois at Urbana-Champaign Urbana, IL 61801, USA.
[5] Hendrik Fichtenberger, Marc Gillé, Melanie Schmid, in Algorithms–ESA2013,Volume 8125,2013,pp 481-492
[6] Pedro Pereir a Rodrigues, João Gama, João Pedro Pedroso, ”Hierarchical clustering of Time series Data Streams”, IEEE Transactions on Knowledge and data engineering, May 2008 vol 20,no.5,pp. 615-627.
[7] De Andrade Silva, J, extending k-Means-Based Algorithms for Evolving Data Streams with Variable Number of Clusters .IEEE, Published in: Machine Learning and Applications and Workshops (ICMLA), 2011 10th International Conference on Volume: 2
[8] Parneeta Dhaliwal, MPS Bhatia and Priti Bansal, ”A Cluster-based Approach for Outlier Detection in Dynamic Data Streams (KORM: k-median OutlieR Miner)”, Journal of Computing, Vol. 2, No. 2, 2010, ISSN 2151-9617, pp. 74-80.
[9] Ville Hautamaki, Svetlana Cherednichenko, IsmoKarkkainen,TomiKinnunen, and Pa si Fr anti, ”Improving k-Means by Outlier Removal”, SCIA, LNCS 3540, 2005, pp. 978–987
[10] Jian Wang , YongchengLuo, Yan Zhao JiajinLe. 2009” A Survey on Privacy Preserving Data Mining” , First International Workshop on Database Technology and Applications.
[11] MdZahidul Islam, LjiljanaBrankovic. (2011)”Privacy preserving data mining: A noise addition framework using a novel clustering technique”, Elsevier.
[12] Chuang-Cheng Chiu and Chieh-YuanT sai.2007 A k-Anonymity Clustering Method for Effective Data
[13] A.Mira and S.Saharia,” A Robust Outlier Detection Using Hybrid Approach”, Aamerican Journal of Intelligent System 2012. [14] Mohd - Al- Zoubi,” New Outlier Detection Method Based On Fuzzy Clustering”, (IJAR) Vol.4, October 2010.
[15] Ms.S. D.Pachgade and Ms. S.S. Dhande,”Outlier detection Over Data Set Using Cluster Based and Distance ‐ Based Approach”, (IJARCSSE), Volume 2, Issue6, June 2012
[16] C.Sumithiradevi and Punithavalli,”Enhanced K‐ Means with Greedy Algorithm For Outlier Detection”, IJARCS, Vol. 3, No.3, May ‐ June 2012. [17] ChanderSahu ,Dr. B.S Patel ”Application of Fuzzy ID3 To Forcast Seasonal Runoff”
International journal of Computer Technology And Electronics Engineering (IJCTEE) Volume 1,Issue 3.
[18] Jen-Da Shie · Shyi- Ming Chen, “Feature subset selection based on fuzzy entropy measures for handling classification problems” , ApplIntell (2008) 28: 69–82,DOI 10.1007/s10489-007-0042-6
[19] SU-YUN WUA, ESTER YEN””ELSEVIER 2009DATA MINING-BASED INTRUSION DETECTORS [20] Li Hanguang, Ni Yu” Intrusion Detection Technology Research Based on AprioriAlgorithm”Elsevier 2012
BIOGRAPHY
Mr. Ram Krishna Paramhans is M.tech Software Engineering student Department of Computer Science Engineering in Sharda University Greater Noida, India.