Distributed Intrusion Detection System Using
Clustering approach And Genetic Algorithm
Snehil Dahima
Research Scholar
Computer Science Dept., SSSTUMS
Sehore, India
Dr. Jitendra Sheetlani
Computer Science Department
SSSTUMS
Sehore, India
Abstract
—
Data mining is the method of determining
interesting patterns or knowledge from huge quantity of data.
Intrusion detection systems (IDSs) are typically diffuse along
with other preventive security mechanisms. Certain DM
techniques exploited for ID can be categorize into two classes:
misuse intrusion detection and anomaly intrusion detection.
For providing security against attacks, we introduced hybrid
approach for detecting anomaly intrusion which is the
combination of clustering techniques and optimization. In
hybrid approach, DBSCAN and K-MEANS clustering
approach of data mining is combined with genetic algorithm.
The approach is implemented on KDD99 dataset. In this
paper results are also presented and comparisons between
their base values and proposed results are also given.
Keywords—data mining;IDS;multi agent;
I. I
NTRODUCTIONData mining is the process of extracting styles from data.
Data mining is visible as an increasingly crucial device
through present day enterprise to convert data into business
intelligence giving an informational gain. It is currently
utilized in a large kind of profiling practices, inclusive of
advertising and marketing, surveillance, fraud detection,
and scientific discovery. A primary purpose for the usage
of data mining is to assist in the evaluation of collections
of observations of behavior. An unavoidable truth of data
mining is that the (sub-) set(s) of data being analyzed may
not be consultant of the whole area, and therefore won't
comprise examples of certain essential relationships and
behaviors that exist across other parts of the area.
Data mining technology is superior for: It can system large
amount of data It can find out the hidden and ignored
information Data mining usually entails 4 classes of tasks:-
1)
Clustering – it's task of coming across corporations
and systems within the statistics which are in a few
manner or another "similar", without using
acknowledged systems in the data.
2)
Classification –it is the errand of generalizing
recognized shape to use to new data. For example, a
message program may endeavor to arrange an
electronic message as legit or junk mail. Original
algorithms encompass choice tree learning, nearest
neighbor, Naive Bayesian variety, neural networks and
support vector machines.
3)
Regression - Attempts to discover a characteristic
which fashions the facts with the least error.
4)
Association rule learning - Searches for connections
between factors. For instance a supermarket retailer
would in all probability accumulate data on patron
purchasing habits. Utilizing association rule learning,
in, the supermarket can determine which merchandise
are regularly sold together and use this data for
marketing functions. This is every so often called
marketplace basket analysis [1].
II. I
NTRUSIOND
ETECTIONS
YSTEMAn IDS is a blend of software and hardware which are
used for detecting intrusion. It accumulates and analyzes
the network traffic & detects the malicious patterns and
finally alert to the proper authority. The most imperative
capacity of IDS includes:
Monitoring and analyzing the understanding gathered
from both user and process activities.
Analyzing configurations of approach and evaluating
the file integrity and approach integrity.
For static files, it finds out the abnormal sample.
To recognize irregular pattern, it use static records and
alert to procedure administrator.
Consistent with tactics utilized for intrusion detection
established on whether or not attack’s patterns are
recognized or unknown, IDS labeled into two
categories
1)
Misuse detection
2)
Anomaly detection
a)
Misuse detection: its Signature founded IDS the place
detection of intrusion is founded on the behaviors of
known attacks like antivirus software compares the
data with known code of virus. In Misuse detection,
pattern of recognized malicious activity is stored
within the dataset and pick out suspicious data by
means of evaluating new instances with the stored
pattern of attacks.
III. D
ATAM
ININGI
NI
NTRUSIOND
ETECTIONS
YSTEMData Mining refers back to the procedure of extracting
powerful, updated, latent, beneficial, and the
understandable pattern from a large incomplete, noise,
non-solid and random data. In intrusion detection system,
the records deals from more than one source which
includes network traffic or logs, device logs, software logs,
alarm messages, and so forth. Due to varied data source
and format, the complexity increased in auditing and
analysis of data. Data Mining has huge advantage in data
extraction from large volumes of data that are noisy and
dynamic, thus It's of first-rate significance in IDS.
a)
k - Means is a partitioning procedure in clustering
system of data mining. K-Means clustering
framework is utilized to parcel the training data
into k clusters with the support of Euclidean
distance similarity [4]It is an algorithm to
organize
or to categorise the objects situated on
attributes/services into k number of clusters.
Euclidean Distance condition to discover separate
between two articles is: D(a,b)= D(b,a)= |a-b|=
Basic strides for clustering the data by k-means
are:
Select a number (k) of cluster centers - centroids
(random)
Assign each dissent its nearest cluster focus (e.g.
Using Euclidean distance)
Move each cluster focus to the mean of its allotted
objects
Repeat steps 2, 3 until blending (trade cluster
assignments lower than a most remote point).
Advantage:
Effective in clustering typical or abnormal data.
Disadvantage:
Unable to handle noisy data.
b)
CART (Classification and Regression Trees)
Characterization tree analysis is utilized toidentify
the “class” to which the data belongs. Regression
tree analysis is where the data is continuous and
tree is used to predict its value. The term CART
evaluation is used to refer to both of the above
strategies. Classification and regression trees are
machine-finding out approaches for constructing
prediction units from data. The CART method is
technically called as binary recursive partitioning.
The system is binary due to the fact parent nodes
are usually cut up into precisely two child nodes
and recursive because the system is repeated via
treating every child node as a parent.The
important thing factors of CART analysis are a
collection of policies for splitting each node in a
tree; making a choice on when tree is whole and
assigning a class outcome to each and every
terminal node.
The most essential steps of CART are:
1.
Rules for splitting data at a node based on value
of a variable.
2.
Stopping when a branch becomes at the point
when a branch gets to be a leaf/terminal node and
cannot be cut up further.
3.
Eventually a prediction for target variable in
every leaf/terminal node.
Advantages:
C
ART does not depend on data having a place
with a specific kind of dispersion.
It is not significantly impacted by outliers in
input data [3].
IV.
M
ULTIA
GENTMulti Agent is a self-contained and easily detectable
computer autonomous program, outfitted with their code,
records, and execution country which can move inside a
heterogeneous network of computer systems. Such agents
are beneficial in various commercial programs like
automation of spacecraft, recreation playing, steering cars,
medical prognosis, robotics, language knowledge and
trouble fixing. Following are the benefits of the use of
multiagents in IDS.
1. Overcoming Network Latency
2 Reducing Network Load
3. Autonomous Execution
4. Platform Independence
5. Dynamic Adaptation
6. Static Adaptation
7. Scalability
V.
A
GENTB
ASEDI
DSThe execution of IDS can be increased by using an agent.
Agent Based IDS has following advantages which are
following [4]:
Decrease Network Flow: the process functions of
central node to network nodes are distributed by
systems and computed by agents in network
nodes. Malicious data package can also be
identified by means of procedure and ship
computing outcomes to different nodes in
network if there is abnormal know-how in data
flow.
Improvement Autonomous Computing and
Adaptation Capacity: Agent is autonomous
independent unit. Other agents remain effective
even though a few agents do not work for some
reasons.
Platform Irrelevance: agent established on IDS
can work in various atmospheres and implement
interoperation on the appliance layer for agents
are impartial of the computer and transformation
layer and work in nodes with agent.
VI.
L
ITERATURES
URVEYAuthor Year
Approach
Chaimae SAADI
2016
The simulation outcome acquired by implementing our process show the
high level of detecting intrusion and in addition the probability to minimize
false positive and negative rates [5].
Engy F. Ramadan
2016
A more than one learner multi-agents system (MLMAS) the place each agent
represents a classifier. Every classifier agent will work separately and
cooperatively with other agents to obtain quality results, the outcome of
classifiers are then combined either by a coordinator. Agent using a weighted
voting technique or according to the probability distribution of classifiers'
results. This system has implemented using JADE package and WEKA
classifiers [6].
ChidozieMgbemena
2016
Proposes a novel data-driven methodological strategy to investigating patron
retention within the MSI, utilizing agent situated modeling and simulation
(ABMS). The dataset for this learns is extracted from Twitter utilizing exact
key terms to acquire data from mobile services companies of interest [7].
Yanjie Zhao
2016
The experiments proved that the method is effective to detect intrusion such
as scanning and Deny of Service [8].
DikshantGupta,
2016
Includes the implementation of different data mining algorithms including
Linear regression and K-Means Clustering to routinely generate the rules for
classify network movements. A comparative evaluation of those approaches
to discover intrusions has additionally been made. To learn the patterns of the
attacks, NSL-KDD dataset has been used [9].
El
Mostapha
CHAKIR
2016
Another alert classification algorithm for IDS proposed, that makes
utilization of the algorithm reduces alerts and distinguishes serious alerts,
low importance and irrelevant one with a high performance [10].
Ibéria Medeiros
2015
Implemented within the WAP tool and an experimental evaluation had been
carried out with an enormous set of PHP purposes. Our software located 388
vulnerabilities in 1.4 million lines of
code. Its accuracy and precision had been roughly 5% better than
PhpMinerII's and 45% higher than Pixy's [12].
VII. P
ROPOSEDW
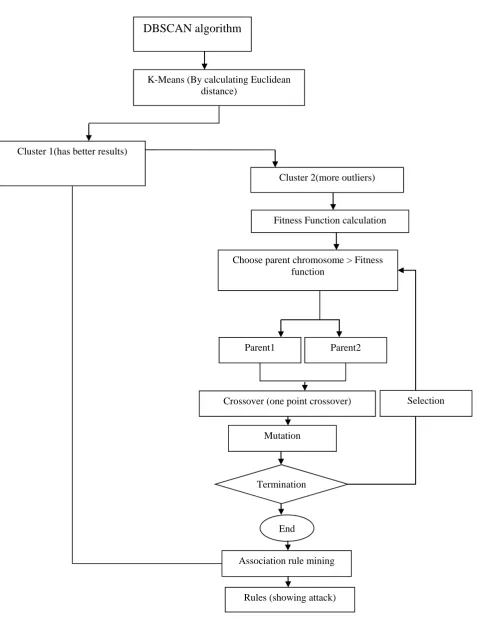
ORKWe combined two method genetic algorithm and clustering
for anomaly based IDS in our proposed work. Find out
intrusion using data mining we propose a hybrid approach.
Hybrid approach is explained by following steps.
1.
In the first step, DBSCAN is used for extracting
density based clusters. These density-based
clusters are considered as initial cluster centers.
This is the preprocessing step for hybrid
approach.
2.
In the second step, k-means is applied on the
cluster centers obtained from DBSCAN. By
computing the Euclidean distance between the
cluster centers, we computed two clusters. Out of
two clusters, one clusters has points with accurate
results, that are true attacks means truly detected
and second clusters has points in which there are
more number of outlier.
For generating more rules based on attack, we
apply
genetic
algorithm
on
the
second
clusters which has more outliers.
3.
In the third step, those points in clusters which
have higher fitness value than the fitness function
of genetic algorithm are selected as chromosome.
After selecting chromosomes, one point crossover
is applied for generating parent from
chromosome. After crossover, mutation is applied
on the parent. This process is repeated until we
get points better than the fitness function.
Figure 5.1 Flow chart of hybrid approach
DBSCAN algorithm
K-Means (By calculating Euclidean
distance)
Cluster 1(has better results)
Cluster 2(more outliers)
Mutation
Crossover (one point crossover)
Parent2
Parent1
Choose parent chromosome > Fitness
function
Fitness Function calculation
Association rule mining
Termination
End
Rules (showing attack)
1.
Genetic Algorithm
Mainly the initialization of population in genetic
algorithm is in the form of chromosomes. It can be
vary into characters and numbers according to our
needs. All chromosomes have some fitness value
which is considered to get its goodness. Then the
creation of new generation is performed by selection,
crossover and mutation and repeat until we get best
result. The chromosomes codification is associated to
solve the problem which is the main element of
genetic process. String codification is the method in
which chromosomes are a real number where it
denotes the total number of population and it can be
binary, floating point and other method.
2.
Clustering
Distance is the method which is used to form the
cluster of the population. For each chromosome, we
used CH
∈
PLN with CT centroid. Euclidean distance
calculated to find the distance between the clusters.
D =
||
||
α is the factor of normalization
which is number of
attribute. The test is performed on raw data and
standardized data and thread is assigned to each
chromosome for creating clusters. This is now useful
to find the fitness function of the chromosomes.
3.
Fitness Function
Highest fitness value is achieved by the chromosomes
which are close to optimal solution. So this individuals
can be used by the next iteration and discard the
others.
4.
Genetic Operators
i. Selectors
In process, the selection is done on the basis of the
highest fitness value by deterministic way and two
parent chromosomes are chosen from the
population. There are many methods to select best
chromosomes in which tournament selection is the
most efficient and produce optimal solution.
ii.
Crossover
This is a process of child generation from the
solution of two parents. Genetic algorithm used
crossover to attain a solution from the space.
Mainly swapping the two parents performed to
generate new solution.
iii. Mutation
But after some extent, the generation of individual
becomes less efficient by crossover. This makes the
requirement of mutation and it has a less probability
to mutate.
VIII.
R
ESULTSPropose Result
Association rules:
Antecedent->consequent (Support%, Confidence%) Duration ->Service (100%, 25143.7107%) Duration ->Flag (100%, 25143.7107%) ProtocolType ->Service (100%, 281.4%)
ProtocolType ->Flag (100%, 281.4%) ProtocolType ->Count (100%, 281.4%) Count ->ProtocolType (100%, 1940.7039%) NumFailedLogins ->Service (100%, 275713.7931%) Count ->Service (100%, 1940.7039%)
NumFailedLogins ->Flag (100%, 275713.7931%) Count ->Flag (100%, 1940.7039%)
Duration ->ProtocolType,Service (100%, 25143.7107%) ProtocolType ->Duration,Service (100%, 281.4%) Duration,ProtocolType -> Service (100%, 164.8598%) Duration ->ProtocolType,Flag (100%, 25143.7107%) ProtocolType ->Duration,Flag (100%, 281.4%) Duration,ProtocolType -> Flag (100%, 164.8598%) Duration,Flag ->ProtocolType (100%, 43932.4176%) Duration ->Service,Flag (100%, 25143.7107%) Duration,Flag -> Service (100%, 43932.4176%) Duration ->Service,Count (100%, 25143.7107%) Count ->Duration,Service (100%, 1940.7039%) Duration,Count -> Service (100%, 3825.6938%) Duration ->Flag,Count (100%, 25143.7107%) Count ->Duration,Flag (100%, 1940.7039%) Duration,Flag -> Count (100%, 43932.4176%) Duration,Count -> Flag (100%, 3825.6938%) ProtocolType ->Service,Flag (100%, 281.4%)
ProtocolType ->Service,NumFailedLogins (100%, 281.4%) NumFailedLogins ->ProtocolType,Service (100%, 275713.7931%) ProtocolType,NumFailedLogins -> Service (100%, 162.9581%) ProtocolType ->Service,Count (100%, 281.4%)
Count ->ProtocolType,Service (100%, 1940.7039%) ProtocolType,Count -> Service (100%, 15959.481%) ProtocolType ->Flag,NumFailedLogins (100%, 281.4%) NumFailedLogins ->ProtocolType,Flag (100%, 275713.7931%) ProtocolType,NumFailedLogins -> Flag (100%, 162.9581%) Flag,NumFailedLogins ->ProtocolType (100%, 42757.754%) ProtocolType ->Flag,Count (100%, 281.4%)
Count ->ProtocolType,Flag (100%, 1940.7039%) ProtocolType,Count -> Flag (100%, 15959.481%) NumFailedLogins ->Service,Flag (100%, 275713.7931%) Flag,NumFailedLogins -> Service (100%, 42757.754%) Count ->Service,Flag (100%, 1940.7039%)
NumFailedLogins ->ProtocolType,Service,Flag (100%, 275713.7931%) ProtocolType,NumFailedLogins ->Service,Flag (100%, 162.9581%) Flag,NumFailedLogins ->ProtocolType,Service (100%, 42757.754%) ProtocolType,Flag,NumFailedLogins -> Service (100%, 7995700%) ProtocolType ->Service,Flag,Count (100%, 281.4%)
Count ->ProtocolType,Service,Flag (100%, 1940.7039%) ProtocolType,Count ->Service,Flag (100%, 15959.481%) ProtocolType ->Service,NumFailedLogins,Count (100%, 281.4%) NumFailedLogins ->ProtocolType,Service,Count (100%, 275713.7931%)
Count ->ProtocolType,Service,NumFailedLogins (100%, 1940.7039%) ProtocolType,NumFailedLogins ->Service,Count (100%, 162.9581%) ProtocolType,Count ->Service,NumFailedLogins (100%, 15959.481%) NumFailedLogins,Count ->ProtocolType,Service (100%, 4248.5122%) ProtocolType,NumFailedLogins,Count -> Service (100%, 2346.1561%) ProtocolType ->Flag,NumFailedLogins,Count (100%, 281.4%) NumFailedLogins ->ProtocolType,Flag,Count (100%, 275713.7931%) Count ->ProtocolType,Flag,NumFailedLogins (100%, 1940.7039%) ProtocolType,NumFailedLogins ->Flag,Count (100%, 162.9581%) ProtocolType,Count ->Flag,NumFailedLogins (100%, 15959.481%) Flag,NumFailedLogins ->ProtocolType,Count (100%, 42757.754%) NumFailedLogins,Count ->ProtocolType,Flag (100%, 4248.5122%) ProtocolType,Flag,NumFailedLogins -> Count (100%, 7995700%) ProtocolType,NumFailedLogins,Count -> Flag (100%, 2346.1561%) Flag,NumFailedLogins,Count ->ProtocolType (100%, 43692.3497%) NumFailedLogins ->Service,Flag,Count (100%, 275713.7931%) Count ->Service,Flag,NumFailedLogins (100%, 1940.7039%) Flag,NumFailedLogins ->Service,Count (100%, 42757.754%) NumFailedLogins,Count ->Service,Flag (100%, 4248.5122%) Flag,NumFailedLogins,Count -> Service (100%, 43692.3497%) Duration ->ProtocolType,Service,Flag,Count (100%, 25143.7107%) ProtocolType ->Duration,Service,Flag,Count (100%, 281.4%) Count ->Duration,ProtocolType,Service,Flag (100%, 1940.7039%) Duration,ProtocolType ->Service,Flag,Count (100%, 164.8598%) Duration,Flag ->ProtocolType,Service,Count (100%, 43932.4176%) Duration,Count ->ProtocolType,Service,Flag (100%, 3825.6938%) ProtocolType,Count ->Duration,Service,Flag (100%, 15959.481%) Duration,ProtocolType,Flag ->Service,Count (100%, 7995700%) Duration,ProtocolType,Count ->Service,Flag (100%, 2725.1875%) Duration,Flag,Count ->ProtocolType,Service (100%, 44175.1381%) Duration,ProtocolType,Flag,Count -> Service (100%, 7995700%) ProtocolType ->Service,Flag,NumFailedLogins,Count (100%, 281.4%) NumFailedLogins ->ProtocolType,Service,Flag,Count (100%, 275713.7931%)
Count ->ProtocolType,Service,Flag,NumFailedLogins (100%, 1940.7039%)
ProtocolType,NumFailedLogins ->Service,Flag,Count (100%, 162.9581%)
ProtocolType,Count ->Service,Flag,NumFailedLogins (100%, 15959.481%)
Flag,NumFailedLogins ->ProtocolType,Service,Count (100%, 42757.754%)
NumFailedLogins,Count ->ProtocolType,Service,Flag (100%, 4248.5122%)
ProtocolType,Flag,NumFailedLogins ->Service,Count (100%, 7995700%)
ProtocolType,NumFailedLogins,Count ->Service,Flag (100%, 2346.1561%)
Flag,NumFailedLogins,Count ->ProtocolType,Service (100%, 43692.3497%)
ProtocolType,Flag,NumFailedLogins,Count -> Service (100%, 7995700%)
Duration ->ProtocolType,Count (99.3734%, 24986.1635%) ProtocolType ->Duration,Count (99.3734%, 279.6368%) Count ->Duration,ProtocolType (99.3734%, 1928.5437%) Duration,ProtocolType -> Count (99.3734%, 163.8268%) Duration,Count ->ProtocolType (99.3734%, 3801.7225%) ProtocolType,Count -> Duration (99.3734%, 15859.481%) ProtocolType ->NumFailedLogins,Count (99.3734%, 279.6368%) NumFailedLogins ->ProtocolType,Count (99.3734%, 273986.2069%) Count ->ProtocolType,NumFailedLogins (99.3734%, 1928.5437%) ProtocolType,NumFailedLogins -> Count (99.3734%, 161.937%) ProtocolType,Count ->NumFailedLogins (99.3734%, 15859.481%) NumFailedLogins,Count ->ProtocolType (99.3734%, 4221.8916%) Duration ->Count (95.4688%, 24004.4025%)
Count ->Duration (95.4688%, 1852.767%)
NumFailedLogins ->Count (94.8647%, 261555.1724%) Count ->NumFailedLogins (94.8647%, 1841.0437%) Duration ->ProtocolType (64.4634%, 16208.4906%) ProtocolType ->Duration (64.4634%, 181.4%) ProtocolType ->NumFailedLogins (64.4634%, 181.4%) NumFailedLogins ->ProtocolType(64.4634%, 177734.4828%) Elapsed time is 329.138909 seconds.
Base Rules
Association rules:
Antecedent->consequent (Support%, Confidence%) Duration ->Service (100%, 27526.9972%) Duration ->Flag (100%, 27526.9972%) ProtocolType ->Service (100%, 274.914%) ProtocolType ->Flag (100%, 274.914%) ProtocolType ->Count (100%, 274.914%) Count ->ProtocolType (100%, 1890.333%) ProtocolType ->Label (100%, 274.914%) Label ->ProtocolType (100%, 507.7904%) Count ->Service (100%, 1890.333%) Label ->Service (100%, 507.7904%) Count ->Flag (100%, 1890.333%) Label ->Flag (100%, 507.7904%) Count ->Label (100%, 1890.333%) Label ->Count (100%, 507.7904%)
Count,Label -> Flag (100%, 2370.0901%)
Duration ->ProtocolType,Service,Flag (100%, 27526.9972%) ProtocolType ->Duration,Service,Flag (100%, 274.914%) Duration,ProtocolType ->Service,Flag (100%, 161.0986%) Duration,Flag ->ProtocolType,Service (100%, 41634.5833%) Duration ->ProtocolType,Service,Count (100%, 27526.9972%) ProtocolType ->Duration,Service,Count (100%, 274.914%) Count ->Duration,ProtocolType,Service (100%, 1890.333%) Duration,ProtocolType ->Service,Count (100%, 161.0986%) Duration,Count ->ProtocolType,Service (100%, 3720.1415%) ProtocolType,Count ->Duration,Service (100%, 15232.1646%) Duration,ProtocolType,Count -> Service (100%, 2694.795%) Duration ->ProtocolType,Service,Label (100%, 27526.9972%) ProtocolType ->Duration,Service,Label (100%, 274.914%) Label ->Duration,ProtocolType,Service (100%, 507.7904%) Duration,ProtocolType ->Service,Label (100%, 161.0986%) Duration,Label ->ProtocolType,Service (100%, 125.6482%) ProtocolType,Label ->Duration,Service (100%, 126484.8101%) Duration,ProtocolType,Label -> Service (100%, 184.3258%) Duration ->ProtocolType,Flag,Count (100%, 27526.9972%) ProtocolType ->Duration,Flag,Count (100%, 274.914%) Count ->Duration,ProtocolType,Flag (100%, 1890.333%) Duration,ProtocolType ->Flag,Count (100%, 161.0986%) Duration,Flag ->ProtocolType,Count (100%, 41634.5833%) Duration,Count ->ProtocolType,Flag (100%, 3720.1415%) ProtocolType,Count ->Duration,Flag (100%, 15232.1646%) Duration,ProtocolType,Count -> Flag (100%, 2694.795%) Duration,Flag,Count ->ProtocolType (100%, 42702.1368%) Duration ->ProtocolType,Flag,Label (100%, 27526.9972%) ProtocolType ->Duration,Flag,Label (100%, 274.914%) Label ->Duration,ProtocolType,Flag (100%, 507.7904%) Duration,ProtocolType ->Flag,Label (100%, 161.0986%) Duration,Flag ->ProtocolType,Label (100%, 41634.5833%) Duration,Label ->ProtocolType,Flag (100%, 125.6482%) ProtocolType,Label ->Duration,Flag (100%, 126484.8101%) Duration,ProtocolType,Label -> Flag (100%, 184.3258%) Duration,Flag,Label ->ProtocolType (100%, 59834.1317%) Duration ->Service,Flag,Count (100%, 27526.9972%) Count ->Duration,Service,Flag (100%, 1890.333%) Duration,Flag ->Service,Count (100%, 41634.5833%) Duration,Count ->Service,Flag (100%, 3720.1415%) Duration,Flag,Count -> Service (100%, 42702.1368%) Duration ->Service,Flag,Label (100%, 27526.9972%) Label ->Duration,Service,Flag (100%, 507.7904%) Duration,Flag ->Service,Label (100%, 41634.5833%) Duration,Label ->Service,Flag (100%, 125.6482%) Duration,Flag,Label -> Service (100%, 59834.1317%) Duration ->Service,Count,Label (100%, 27526.9972%) Count ->Duration,Service,Label (100%, 1890.333%) Label ->Duration,Service,Count (100%, 507.7904%) Duration,Count ->Service,Label (100%, 3720.1415%) Duration,Label ->Service,Count (100%, 125.6482%) Count,Label ->Duration,Service (100%, 2370.0901%) Duration,Count,Label -> Service (100%, 4521.4027%) Duration ->Flag,Count,Label (100%, 27526.9972%) Count ->Duration,Flag,Label (100%, 1890.333%) Label ->Duration,Flag,Count (100%, 507.7904%) Duration,Flag ->Count,Label (100%, 41634.5833%) Duration,Count ->Flag,Label (100%, 3720.1415%) Duration,Label ->Flag,Count (100%, 125.6482%) Count,Label ->Duration,Flag (100%, 2370.0901%) Duration,Flag,Count -> Label (100%, 42702.1368%) Duration,Flag,Label -> Count (100%, 59834.1317%) Duration,Count,Label -> Flag (100%, 4521.4027%) ProtocolType ->Service,Flag,Count (100%, 274.914%) Count ->ProtocolType,Service,Flag (100%, 1890.333%) ProtocolType,Count ->Service,Flag (100%, 15232.1646%) ProtocolType ->Service,Flag,Label (100%, 274.914%) Label ->ProtocolType,Service,Flag (100%, 507.7904%) ProtocolType,Label ->Service,Flag (100%, 126484.8101%) ProtocolType ->Service,Count,Label (100%, 274.914%) Count ->ProtocolType,Service,Label (100%, 1890.333%) Label ->ProtocolType,Service,Count (100%, 507.7904%) ProtocolType,Count ->Service,Label (100%, 15232.1646%) ProtocolType,Label ->Service,Count (100%, 126484.8101%)
Count,Label ->ProtocolType,Service (100%, 2370.0901%) ProtocolType,Count,Label -> Service (100%, 126484.8101%) ProtocolType ->Flag,Count,Label (100%, 274.914%) Count ->ProtocolType,Flag,Label (100%, 1890.333%) Label ->ProtocolType,Flag,Count (100%, 507.7904%) ProtocolType,Count ->Flag,Label (100%, 15232.1646%) ProtocolType,Label ->Flag,Count (100%, 126484.8101%) Count,Label ->ProtocolType,Flag (100%, 2370.0901%) ProtocolType,Count,Label -> Flag (100%, 126484.8101%) Count ->Service,Flag,Label (100%, 1890.333%) Label ->Service,Flag,Count (100%, 507.7904%) Count,Label ->Service,Flag (100%, 2370.0901%)
ProtocolType ->Service,Flag,Count,Label (100%, 274.914%) Count ->ProtocolType,Service,Flag,Label (100%, 1890.333%) Label ->ProtocolType,Service,Flag,Count (100%, 507.7904%) ProtocolType,Count ->Service,Flag,Label (100%, 15232.1646%) ProtocolType,Label ->Service,Flag,Count (100%, 126484.8101%) Count,Label ->ProtocolType,Service,Flag (100%, 2370.0901%) ProtocolType,Count,Label ->Service,Flag (100%, 126484.8101%) Duration ->ProtocolType,Service,Flag,Count,Label (100%, 27526.9972%)
ProtocolType ->Duration,Service,Flag,Count,Label (100%, 274.914%) Count ->Duration,ProtocolType,Service,Flag,Label (100%, 1890.333%) Label ->Duration,ProtocolType,Service,Flag,Count (100%, 507.7904%) Duration,ProtocolType ->Service,Flag,Count,Label (100%, 161.0986%) Duration,Flag ->ProtocolType,Service,Count,Label (100%,
41634.5833%)
Duration,Count ->ProtocolType,Service,Flag,Label (100%, 3720.1415%) Duration,Label ->ProtocolType,Service,Flag,Count (100%, 125.6482%) ProtocolType,Count ->Duration,Service,Flag,Label (100%,
15232.1646%)
ProtocolType,Label ->Duration,Service,Flag,Count (100%, 126484.8101%)
Count,Label ->Duration,ProtocolType,Service,Flag (100%, 2370.0901%) Duration,ProtocolType,Count ->Service,Flag,Label (100%, 2694.795%) Duration,ProtocolType,Label ->Service,Flag,Count (100%, 184.3258%) Duration,Flag,Count ->ProtocolType,Service,Label (100%,
42702.1368%)
Duration,Flag,Label ->ProtocolType,Service,Count (100%, 59834.1317%)
Duration,Count,Label ->ProtocolType,Service,Flag (100%, 4521.4027%) ProtocolType,Count,Label ->Duration,Service,Flag (100%,
126484.8101%)
Duration,ProtocolType,Count,Label ->Service,Flag (100%, 3040.8704%) Duration,Flag,Count,Label ->ProtocolType,Service (100%,
60194.5783%)
Duration ->ProtocolType,Label (99.9209%, 27505.2342%) ProtocolType ->Duration,Label (99.9209%, 274.6967%) Label ->Duration,ProtocolType (99.9209%, 507.389%) Duration,ProtocolType -> Label (99.9209%, 160.9712%) Duration,Label ->ProtocolType (99.9209%, 125.5489%) ProtocolType,Label -> Duration (99.9209%, 126384.8101%) Duration ->ProtocolType,Count,Label (99.9209%, 27505.2342%) ProtocolType ->Duration,Count,Label (99.9209%, 274.6967%) Count ->Duration,ProtocolType,Label (99.9209%, 1888.8384%) Label ->Duration,ProtocolType,Count (99.9209%, 507.389%) Duration,ProtocolType ->Count,Label (99.9209%, 160.9712%) Duration,Count ->ProtocolType,Label (99.9209%, 3717.2003%) Duration,Label ->ProtocolType,Count (99.9209%, 125.5489%) ProtocolType,Count ->Duration,Label (99.9209%, 15220.122%) ProtocolType,Label ->Duration,Count (99.9209%, 126384.8101%) Count,Label ->Duration,ProtocolType (99.9209%, 2368.2163%) Duration,ProtocolType,Count -> Label (99.9209%, 2692.6645%) Duration,ProtocolType,Label -> Count (99.9209%, 184.18%) Duration,Count,Label ->ProtocolType (99.9209%, 4517.8281%) ProtocolType,Count,Label -> Duration (99.9209%, 126384.8101%) Duration ->ProtocolType,Count (99.3435%, 27346.281%) ProtocolType ->Duration,Count (99.3435%, 273.1092%) Count ->Duration,ProtocolType (99.3435%, 1877.9228%) Duration,ProtocolType -> Count (99.3435%, 160.041%) Duration,Count ->ProtocolType (99.3435%, 3695.7185%) ProtocolType,Count -> Duration (99.3435%, 15132.1646%) Duration ->Count,Label (96.3562%, 26523.9669%) Count ->Duration,Label (96.3562%, 1821.4529%) Label ->Duration,Count (96.3562%, 489.2875%) Duration,Count -> Label (96.3562%, 3584.5867%) Duration,Label -> Count (96.3562%, 121.0698%) Count,Label -> Duration (96.3562%, 2283.7287%) Duration ->Count (95.3544%, 26248.2094%) Count ->Duration (95.3544%, 1802.5161%) Duration ->Label (80.9283%, 22277.135%) Label ->Duration (80.9283%, 410.9462%) Duration ->ProtocolType (63.625%, 17514.0496%) ProtocolType ->Duration (63.625%, 174.914%) Elapsed time is 65.817168 seconds.
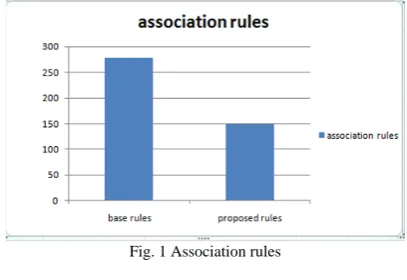
Result comparison
Comparison is given according to association rules
generated from base algorithm and propose algorithm.
Fig. 1 Association rules
Comparison is given according to elapsed time.
Fig. 2 Elapsed time
C
ONCLUSIONDM techniques essentially are clustering techniques and
association rule mining algorithms. We used DBSCAN
and K-MEANS clustering technique of data mining and
combined these techniques with optimization for detecting
intrusion attacks.DBSCAN clustering approach forms
clusters grouping points that are closely related and marked
outlier points lie apart from a particular distance by taking
some attribute of KDD 99 dataset.. Then we apply
K-MEANS clustering approach to partition attacks into
different clusters, according to their behavior. For
identifying more attack we are applying genetic algorithm
on the cluster which have more number of results. By
clustering, the categorization between type of intrusion can
be achieved.
Also association rule mining is also performed on the
clusters detected by genetic algorithm for generating rules
which represents intrusion. This makes the task of
analyzation easy for rule mining agent. Overall we are
trying to provide a secure network against intrusion.
The future directions of the work presented in this paper
would be to modify the GA in such a way that the best
value of k will be calculated automatically by the GA
model.
We can also use feature selection algorithm for selecting
appropriate feature from KDD dataset which can help to
build efficient and practical intrusion detection.
model of intrusion detection system for more accuracy and
we can use the NSL-KDD dataset benchmark because this
dataset gives more accuracy by using less number of
feature selection.
We can also plan to enhance the DBSCAN and provide its
implementation and compare its results with the different
existing DBSCAN algorithms variations.
R
EFERENCES[1] Amanpreet Chauhan, Gaurav Mishra, Gulshan Kumar “Survey on Data Mining Techniques in Intrusion Detection” International Journal of Scientific & Engineering Research Volume 2, Issue 7, July-2011 1 ISSN 2229-5518.
[2] D. Shona, A.Shobana “A Survey on Intrusion Detection using Data Mining Technique” International Journal of Innovative Research in Computer and Communication Engineering (An ISO 3297: 2007 Certified Organization) Vol. 3, Issue 12, December 2015.
[3] Jaina Patel1 , Mr. Krunal Panchal “Effective Intrusion Detection System using Data Mining Technique” June 2015, Volume 2, Issue 6 JETIR (ISSN-2349-5162).
[4] Chandrakant Jain, Aumreesh Kumar Saxena “General Study of Mobile Agent Based Intrusion Detection System (IDS)” 5 February 2016; accepted 10 April 2016; published 13 April 2016 Copyright © 2016.
[5] Chaimae SAADI, Habiba CHAOUI “Intrusion Detection System based Interaction on Mobile Agents and Clust-density Algorithm “IDS-AM-Clust” 978-1-5090-0751-6/16/$31.00 ©2016 IEEE.
[6] Engy F. Ramadan, Mohamed Shalaby, and Essam ElFakhrany, “Cooperation among Independent Multi-Agents in A Reliable Data Mining System” ISBN: 978-1-4673-7504-7 ©2016.
[7] Chidozie Mgbemena, David Bell and Nurul Saleh “A Data-driven Methodology for Agent Based Exploration of Customer Retention” 2016 IEEE/ACM 20th International Symposium on Distributed Simulation and Real Time Applications.
[8] Yanjie Zhao “Network Intrusion Detection System Model Based on Data Mining” 978-1-5090-2239-7/16/$31.00 copyright 2016 IEEE SNPD 2016, May 30-June 1, 2016, Shanghai, China.
[9] Anirudh , R. Uday Kiran , P. Krishna Reddy, Masaru Kitsuregawa “Memory Efficient Mining of Periodic-Frequent Patterns in Transactional Databases” 978-1-5090-4240-1/16/$31.00 ©2016 IEEE.
[10] El Mostapha CHAKIR, Youness IDRISSI KHAMLICHI and
Mohamed MOUGHIT “Handling Alerts for Intrusion Detection System Using Stateful Pattern Matching” 978-1-5090-0751-6/16/$31.00 ©2016 IEEE.
[11] DikshantGupta, SuhaniSinghal, Shamita Malik, Archana Singh “Network Intrusion Detection System Using various data mining techniques” International Conference on Research Advances in Integrated Navigation Systems (RAINS - 2016), April 06-07, 2016, R. L. Jalappa Institute of Technology, Doddaballapur, Bangalore, India, 978-1-4673-8819-8/16/$31.00 ©2016 IEEE.