This is a repository copy of Effect of long-term changes in soil chemistry induced by road salt applications on N-transformations in roadside soils.
White Rose Research Online URL for this paper: http://eprints.whiterose.ac.uk/3733/
Article:
Green, S.M., Machin, R. and Cresser, M.S. (2008) Effect of long-term changes in soil chemistry induced by road salt applications on N-transformations in roadside soils. Environmental Pollution. pp. 20-31. ISSN 1873-6424
https://doi.org/10.1016/j.envpol.2007.06.005
[email protected] https://eprints.whiterose.ac.uk/
Reuse
Items deposited in White Rose Research Online are protected by copyright, with all rights reserved unless indicated otherwise. They may be downloaded and/or printed for private study, or other acts as permitted by national copyright laws. The publisher or other rights holders may allow further reproduction and re-use of the full text version. This is indicated by the licence information on the White Rose Research Online record for the item.
Takedown
If you consider content in White Rose Research Online to be in breach of UK law, please notify us by
promoting access to White Rose research papers
White Rose Research Online
Universities of Leeds, Sheffield and York
http://eprints.whiterose.ac.uk/
This is an author produced version of a paper published in Environmental Pollution.
White Rose Research Online URL for this paper: http://eprints.whiterose.ac.uk/3733
Published paper
Green, S.M., Machin, R. and Cresser, M.S. (2008) Effect of long-term changes in soil chemistry
induced by road salt applications on N-transformations in roadside soils. Environmental
Pollution, Volume 152, Issue 1, pp.20-31
Title: Effect of long-term changes in soil chemistry induced by road salt applications
on N-transformations in roadside soils. 1
2
3
4
5
6
7
8
9
10
11
12
13
14
15
16
17
18
19
20
21
22
23
24
25
26
27
28
29
30
31
Sophie M. Green*, Robert Machin and Malcolm S. Cresser
Environment Department, University of York, Heslington, York, Y010 5DD, UK
Abstract:
Of several impacts of road salting on roadside soils, the potential disruption of the
nitrogen cycle has been largely ignored. Therefore the fates of low-level
ammonium-N and nitrate-ammonium-N inputs to roadside soils impacted by salting over an extended period
(decades) in the field have been studied. The use of road salts disrupts the
proportional contributions of nitrate-N and ammonium-N to the mineral inorganic
fraction of roadside soils. It is highly probable that that the degree of salt exposure of
the soil, in the longer term, controls the rates of key microbial N transformation
processes, primarily by increasing soil pH. Additional influxes of ammonium-N to
salt impacted soils are rapidly nitrified therefore and, thereafter, increased leaching of
nitrate-N to the local waterways occurs, which has particular relevance to the Water
Framework Directive. The results reported are important when assessing the fate of
inputs of ammonia to soils from atmospheric pollution.
“Capsule”: Road salting effects ammonification and nitrification in roadside soils.
Keywords: Road salt, ammonification, nitrification, roadside soils.
1. Introduction:
The application of deicing agents to roads has been widely practised in Europe and
North America during winter months since the 1960s to minimise the risk of accidents
due to ice and snow and to maintain traffic flow. Several different de-icing agents are
available, but most agencies in the UK use sodium chloride, which can be applied to
roads as a liquid or solid, depending upon the conditions (Blomqvist and Johansson,
1999). The salt may be relatively pure NaCl, or mixed with grits and sands, and
possibly an anti-caking agent such as sodium hexacyanoferrate (II) (Ohno, 1990).
*
Corresponding author: Tel: +44 1904 434790; Fax:+44 1904 432998
De-icing salts provide safer driving conditions by dissolving into precipitation, either
melting any ice or snow, or preventing the formation of ice on the roads. However,
75–90 % of the applied de-icing salt enters the roadside environment directly in runoff
and as splash or aerosol deposition (Astebol et al., 1996), via mechanical malfunction
during application or post-application ploughing, or as wash off from vegetation as
throughfall. Deposition occurs mainly within 10 m of the roadside (Astebol et al.,
1996; McBean and Al-Nassri, 1987), although elevated concentrations of Na 32
33
34
35
36
37
38
39
40
41
42
43
44
45
46
47
48
49
50
51
52
53
54
55
56
57
58
59
60
61
62
63
64
65
+
and Cl– have been observed from tens to hundreds of metres from roads (Blomqvist and
Johansson, 1999).
2. Impacts on Soils, Plants and Freshwaters:
The detrimental impacts of elevated concentrations of Na+ and Cl– on roadside soils, vegetation, and ground- and surface-waters (as well as automobiles and road surfaces)
have been well documented. Effects on soils and plants include:
Impacts on Soil:
1. Possible alterations in soil structure (Bäckström et al., 2004; Norrstrom
and Bergstedt, 2001).
2. An increased potential for colloid mobility and therefore associated
heavy metal mobility (Amrhein et al., 1992; Grolimund et al., 1996;
Norrstrom and Jacks, 1998; Shainberg and Letey, 1984).
3. Possible reductions in hydraulic conductivity as pores become blocked
by the release of fine particulates and soil colloids (Norrstrom and
Bergstedt, 2001).
4. Changes in the concentrations of cations on cation exchange sites and
in soil solution leading to changes in soil and soil solution pH and ion
concentrations, and disruption of natural and other pollutant element
biogeochemical cycling (Bäckström et al., 2004; Bauske and Goetz,
1993; Darban et al., 2000; Duckworth and Cresser, 1991; Löfgren,
2001; Norrstrom and Bergstedt, 2001; Norrstrom and Jacks, 1998;
Sarin et al., 2000; Shanley, 1994).
5. Changes in the soil microflora and microfaunal communities to ones
Impacts upon Plants:
66
67
68
69
70
71
72
73
74
75
76
77
78
79
80
81
82
83
84
85
86
87
88
89
90
91
92
93
94
Direct impacts upon roadside plant communities include leaf and needle scorch,
branch dieback, disfigurement, loss of turgidity, growth reduction and sometimes
toxicity to plant life (Bryson and Barker, 2002; Bayuelo-Jiménez et al., 2003; DOE &
DOH, 2001; Fostad and Pedersen, 2000; Kayama et al., 2003; Townsend, 1980;
Serrano and Rodriguez-Navarro, 2001; Viskari and Kärenlampi, 2000).
Plants may be affected via several mechanisms:
1. Ions may accumulate to toxic concentrations within plant tissues
(Townsend, 1980). Increasing osmotic pressure differences may cause
desiccation (Bryson and Barker, 2002; Larcher, 1995; Townsend,
1980). However, damage usually results from a specific ion effect
rather than from an increase in osmotic potential (Townsend, 1980).
2. Nutrient element imbalances (reduced levels of available ammonium,
Ca2+, and K+ within the soil) may occur (Bayuelo-Jiménez et al., 2003; Serrano and Rodriguez-Navarro, 2001).
3. Plant growth may be adversely effected by alterations to soil structure.
4. Plants that are subjected to salt stress also tend to become susceptible
to diseases (Bryson and Barker, 2002; Viskari and Kärenlampi, 2000).
Impacts upon Fresh Waters:
Several investigations have revealed increased sodium and chloride ion concentrations
in both groundwater and surface waters in the vicinity of roads (Demers and Sage,
1990; DOE & DOH, 2001; Löfgren, 2001; Ruth, 2003; Scott, 1976 Shanley, 1994).
Scott (1976) reported an increase in Na+ concentration by a factor of 50 over baseline levels in urban streams after road salt application, whilst Ruth (2003) reported a
maximum 30-fold increase in urban streams in Helsinki, Southern Finland, during
spring floods, and Demers and Sage (1990) reported chloride ion concentrations 31
times higher downstream from a major road as compared to upstream concentrations
high increases are sometimes associated with roadside salt piles. The precise
concentration increase obviously depends upon the size of unpolluted catchment
upstream, road length in close proximity to the stream and amounts of salt applied. In
the study area for the present research, for example, the Cl 95
96
97
98
99
100
101
102
103
104
105
106
107
108
109
110
111
112
113
114
115
116
117
118
119
120
121
122
123
124
125
126
127
128
increase was six-fold
during the highest pollution incident studied. Potential impacts include aquatic
chloride toxicity (DOE & DOH, 2001; Mattson and Godfrey, 1994; Mayer et al., 1999;
Williams et al., 1999) and chemical stratification (Mattson and Godfrey, 1994; Smol
et al., 1983). There may be human health implications for those on salt-restricted
diets (Amrhein et al., 1992). In the UK uplands major trunk roads often run parallel
to rivers that supply a substantial portion of UK potable waters (Smart et al., 2001).
Yet it is in these areas where de-icing salts are most likely to be needed to maintain
the flow of traffic through the winter months on roads and have been in continuous
use for tens of years, and de-icing salts have been used as a winter maintenance
practice for as long.
3. Potential Impacts on Soil N Cycling:
Few studies have focused upon the affect on the nitrogen cycle and microbial
functionality, and the potential disruption that road salts may pose. It is hypothesised
that increasing sodium concentrations may flush ammonium ions from exchange sites
or prevent ammonium retention from atmospheric inputs (Duckworth and Cresser,
1991), and this could conceivably lead to shortages of available N for some distance
down slope of salted roads.
Spatially and temporally variable pH shifts may also modify ammonification
and nitrification rates, providing another mechanism for disruption. These may be
induced either by sodium displacing H+ from cation exchange sites, and similar effects from magnesium and calcium present as impurities in commercial road salt.
They may also arise from mineral insoluble residues present in the salt (7.5 % by
mass in the salt used in the present study, including some gypsum (Kay Monaghan,
Salt Union, personnel communication), or deliberately added grit. In addition, high
concentrations of chloride can acidify soil solution down-slope by the mobile anion
effect. While soil pH does not directly control N availability per se, it does affect soil
microbial activity. Nitrifying organisms tend to be sensitive to excessive soil acidity
and their activity is markedly decreased when soil pH is less than 5.0 (Pierzynski et al.,
129
130
131
132
133
134
135
136
137
138
139
140
141
142
143
144
145
146
147
148
149
150
151
152
153
154
155
156
157
158
159
160
161
162
mineralization of N as well as nitrification. Thus, a shift in soil pH from acidic to
near neutral or above may enhance the rates or organic matter mineralization and of
nitrification due to release from acidity constraints, but may lead eventually to loss of
ammonia via volatilisation and loss of nitrate via denitrification (optimum range pH
6–8).
There is also the possibility that the ammonification process could be
enhanced due to the weakened binding of organic matter to mineral structures as a
consequence of sodium dominance in the soil. Nitrogen transformation processes
could also be disturbed through the direct effect of roadside salt contamination and the
enhanced bioavailability of heavy metals and their chloro-complexes on the microbial
community itself, depending on the ecotoxicity of the chemical species. McCormick
and Wolf (1980) demonstrated that the application of 0.25 mg g-1 of NaCl significantly reduced CO2 evolution (by 16%) in soil, and increasing the NaCl
concentration progressively reduced rate of CO2 evolution, with no CO2 evolved from
soil receiving 100 mg NaCl g-1. A decrease in O2 consumption and CO2 evolution
was also observed by Azam and Muller (2003) with increasing concentrations of
NaCl. At NaCl concentrations ≥ 0.25 mg NaCl g-1 ammonification was reduced and at 0.25 mg NaCl g-1, nitrification rate was significantly reduced (McCormick and Wolf, 1980). This supports Laura’s (1974, 1977) original findings that nitrification
can be severely retarded or even completely inhibited in saline conditions as a result
of nitrifiers being more sensitive to salinity than ammonifiers. However, such
short-term NaCl additions preclude possible compensatory longer-short-term effects of pH
increase of acid soils. This seriously limits the value of studies such as those
described above, as does their inability to take into account the highly dynamic nature
of soil and soil solution chemistry, and hence of the soil microbial environment,
during salt contamination incidents.
If nitrification is inhibited, an accumulation of ammonium may occur, though
conversely ammonium may be leached due to cation exchange competition from
sodium ions (to an extent depending on relative abundance). Additionally, a potential
decline in N mineralisation rate may counteract any such ammonium accumulation
effect by limiting the amount of ammonium released into the soil; such amelioration
would depend on the sensitivity of the micro-organisms involved within these
processes to NaCl, heavy metals and chloro-complexes, as well as the chemical
that ammonification was increasingly retarded with increasing concentration of NaCl;
beyond ≥ 25 mg NaCl g 163
164
165
166
167
168
169
170
171
172
173
174
175
176
177
178
179
180
181
182
183
184
185
186
187
188
189
190
191
192
193
194
195
196
-1
the concentration of ammonium in the soil declined
(McCormick and Wolf, 1980).
As a result of the retardation of nitrification, any input of ammonium could lead to
the accumulation of ammonium in the roadside soil. Increasing ammonia deposition
on the roadside environment results from the use of three-way catalytic converters on
cars, and the incomplete reduction of NO to N2. This leads to increased ammonia in
exhaust emissions, deposition declining with distance from the road (Cape et al., 2004;
Truscott et al., 2005). Thus, ammonium availability is enhanced in those soils that are
most effected by road salt. It is important to note that these previous studies
examined the salinity effect where a fixed concentration of salt solution is added to a
constant soil, with consistent chemical attributes.
A laboratory study was designed to study the fate of ammonium-N and nitrate-N
inputs to roadside soils that have been impacted by salting over an extended period
(decades) in the field. The objective was to quantify the extent to which microbial
functioning and N species transformation rates had been affected by the presence of
road salt contamination within the defined profiles and to identify and prioritise the
possible causes of effects observed. An area known to have lengthy area of very acid
grassland soil was explicitly chosen for the study because pH effects from salting
were likely to be greatest in such a soil. Moreover it could be confirmed that soil
above the road (upslope) was visibly uniform. This was necessary to be confident that
differences in soils below the road and an adjacent control plots were indeed due to
road runoff.
4. Materials and methods:
Field Site:
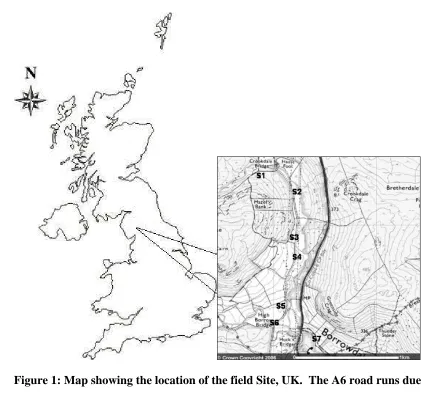
Samples of surface soil (0–10 cm) were collected from an upland site along a major
road, the A6, at Selside, Cumbria, UK (Fig. 1). The site of the present study is an area
of high relief, with altitudes up to 458 m above sea level. Soil types consist of
podzols and poorly developed podzols (limited evolution of E and B horizons) with
variable depths of organic-rich surface horizons. The bedrock in the area is primarily
Upper Ludlow, Ludlow series, Upper Silurian. The vegetation at the site consists
mainly of grasses, Juncus and some bryophytes; and the land is used for grazing cattle
197
198
199
200
201
202
203
204
205
206
207
208
209
210
211
212
213
214
215
216
217
218
219
220
221
222
223
224
225
226
227
228
229
230
opportunity as road drainage is piped directly onto the soil surface at regular intervals.
Hence this site presents three possible contamination level scenarios (a) most heavily
polluted, with drainage plus spray, (b) less polluted, with spray and some (minor) road
runoff and (c) controls on an adjacent hillside at the same attitude and aspect within
the catchment. A wall of a height of 1.5 m separates the road from the salt-affected
sampling sites. Two transects for each pollution-level scenario were sampled in
duplicate, sample sites being separated by at least 10 m to ensure that
pseudoreplication was avoided. Transects were marked out perpendicular to the road;
in the case of the drainage-impacted transects, they were along the line of the drainage
pipes (T1 & T2); spray-impacted transects (T3 & T4) were between drain-impacted
transects to the left; and control transects (T5 & T6) were away from, and well above,
the road, but with the same elevation, aspect, parent material and land use.
Soil sampling:
Soil samples from 0-10 cm were collected at 3 m from the wall, and thus 4 m from the
road itself on the 8th July 2006. In each case, the samples were encased in
polyethylene bags and placed immediately into cold storage (at 2-4ºC) in preparation
for the simulation experiment and chemical analysis.
Water sampling:
A water sampling survey was completed on the Crookdale Brook during the period
12/10/2005-08/07/2006. Conditions at the time of sampling are summarised in Table
1. Flow was not gauged on the Crookdale Brook directly, but discharge in the River
Lune, 6 km from the Crookdale, serves as a useful surrogate. Six locations were
sampled (S1-S5 + S7) along the course of the Brook, their locations being defined by
the A6 (Fig. 1). Above S1 there was negligible catchment contamination from road
runoff. Contamination risk increased steadily down to S5. S6 was an uncontaminated
tributary, which dilutes pollution impacts slightly by S7, the furthest point sampled
downstream on the main river channel. Each sampling point was sampled in
duplicate. The 140-ml polyethylene bottles were rinsed several times with the sample
water before a final collection was made by completely submerging the bottle and
capping it under water to avoid generation of headspace. Samples were placed
immediately into a cold box in preparation for chemical analysis on return to the
231
232
233
234
235
236
237
238
239
240
241
242
243
244
245
246
247
248
249
250
251
252
253
254
255
256
257
258
259
260
261
262
263
Soil Analysis:
Soil moisture content was determined by oven drying at 105°C, and LOI by ashing at
800oC. Soil pH was measured on moist soil at a 1:1 substrate:water ratio.
Ammonium-N and nitrate-N were extracted from soils with 1M KCl and
ammonium-N and nitrate-ammonium-N determined using a standard Bran and Luebbe AutoAnalyser 3
procedure. Exchangeable base cations (Na+, K+, Ca2+ and Mg2+) were determined by AAS using matrix-matched standards after extraction with 1M ammonium acetate.
CEC was determined by AutoAnalyser after washing the ammonium-saturated soils
with 80% aqueous ethanol, and leaching absorbed ammonium with 1 M acidified
NaCl. Performance of all instrumental methods was checked using synthetic
reference standard materials.
Freshwater Analysis:
Nitrate-N in the water samples was determined using a Bran and Luebbe
AutoAnalyser 3. Determinations were repeated by ion chromatography, which was
also used to quantify chloride concentrations (Dionex). There was no significant
difference between results obtained by the two methods of nitrate measurement.
Simulation Experiment:
For each soil of the three salt-impact scenarios, sixty 10-g sub-samples of freshly
collected, field-moist sorted and homogenised un-sieved soil were inserted into
140-ml polyethylene bottles. Soils in a sub-set of 20 bottles were spiked with 50 g of
ammonium-N (as ammonium chloride, added in 0.5 ml of water), soils in a second
sub-set of 20 bottles were spiked with 50 g of nitrate-N (as sodium nitrate, added in
the same volume of water), and the remaining 20 bottles were spiked with the same
volume of deionised water only (as controls). Half of the bottles from each sub-set
were incubated at room temperature and the other half at 4oC. After defined time intervals, duplicate samples for each salt-impact scenario were destructively analysed
for ammonium-N and nitrate-N by addition of 100 ml of 0.5 M KCl, shaking for 1 h,
filtration through Whatman No. 42 papers, and subsequent analysis using a Bran and
Luebbe AutoAnalyser 3. The time intervals used were 0 (immediately post spiking),
264
265
266
267
268
269
270
271
272
273
274
275
276
277
278
279
280
281
282
283
284
285
286
287
288
289
290
291
292
293
294
295
296
to spiking for the soils incubated at room temperature to allow acclimatisation to the
changed temperature conditions.
The incubations were done at two temperatures because it was necessary to
assess prior salting effects on nitrogen species transformation rates under wintry
conditions in order to establish possible links between soil processes and river water
chemistry over the winter period, as well as potential links at the higher temperatures
over the summer period.
5. Results:
Nitrate-N in Crookdale Brook:
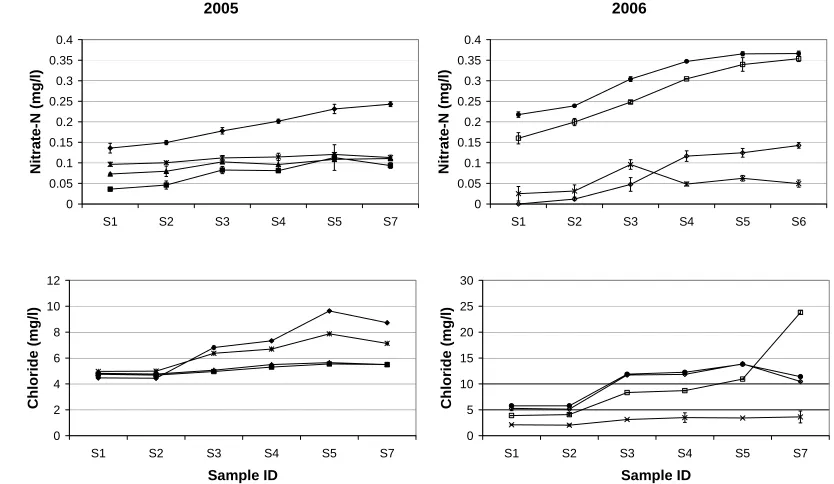
The freshwater survey showed that nitrate-N and chloride concentrations in the river
increased as the road and Crookdale Brook converged at S1, on moving downstream
towards S7 (Fig. 2), especially during periods when winter maintenance was
prominent (22/11/2005-27/01/2006). This suggests relationships between the quantity
of nitrate-N observed in Crookdale Brook and road salt application. Spatial trends for
chloride were very similar to those for nitrate, and a residual increase in chloride
along the river stretch was still seen in July. Nitrate concentrations are low in April
and July, as expected due to greater plant uptake.
Soil Chemical Composition:
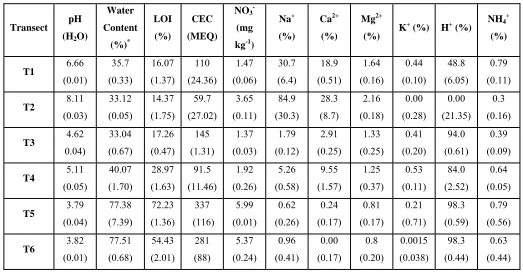
Table 2 summarises the soil chemical parameters for soils from T1-T6. It
demonstrates clearly the differences in soil pH (significant at 1%) and base saturation,
expressed here as % occupation of cation exchange sites for sodium, magnesium,
calcium, potassium and ammonium ions. The differences in % sodium, % magnesium
and % calcium between pollution scenarios were significant at 5 %, 5 % and 1 %
respectively. There is sodium dominance for T1 and T2, with declining contribution
of sodium to exchangeable cations for T3 and T4 and for the controls, T5 and T6,
thereafter. This corresponds to a higher dominance of CEC by hydrogen ions for the
control transects, and progressively lower H+ dominance for both spray contaminated transects and drain-impacted transects (significant at 1%). The proportions of
magnesium and calcium follow the same trend as that for sodium ions. Note that
because of the very high salt content in T1 and T2 soils, and possibly the presence of
297
298
299
300
301
302
303
304
305
306
307
308
309
310
311
312
313
314
315
316
317
318
319
320
321
322
323
324
325
326
327
328
329
Although on average the proportion of exchangeable ammonium-N is lower
than that of the control for both drainage- and spray-contaminated transects, because
of variation between replicates this is not significant. LOI increases, on average, from
the drainage transects to the controls.
The soil for drainage-influenced transects had a much higher pH (6.66 or 8.11)
than that from the spray-contaminated transects (4.62 or 5.11), which were in term
less acid than the control soils (3.79 or 3.82). This corresponds to the high sodium
dominance and low hydrogen content of the CEC for the salt-impacted soils.
Ammonium-N spiking at room temperature:
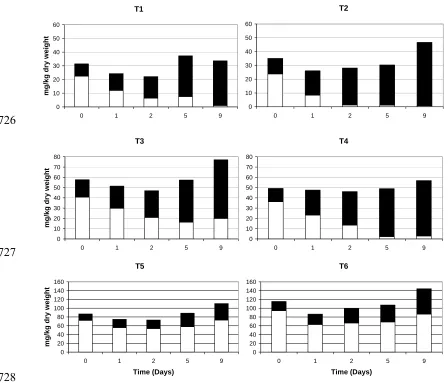
Figure 3 shows how the total extractable mineral N concentration, and the
contributions of nitrate-N and ammonium-N to the total mineral N, changed over the
nine days following the addition of the 50 μg ammonium-N spikes with incubation at
room temperature. It is immediately obvious that in the more acidic, control soils (T5
& T6), ammonium remains dominant throughout the experiment. From one-way
ANOVA, ammonium fell significantly between t0 and t9 for T1, T2, T3, and T4 (1 %),
but not change significantly in T5 and T6. Conversely nitrate increased significantly
(1 %) for all transects, although differences between adjacent pairs of times were not
always significant. In the most salt-impacted soils (T1 & T2), however, nitrate-N is
the dominant mineral N form by the second day, and nitrate becomes increasingly
dominant over time. By the end of the experiment ammonium-N is almost
undetectable. The less contaminated, splash-impacted soils (T3 & T4) display
intermediate behaviour. The declines in nitrate-N to ammonium-N ratio over time are
very consistent, as can be even more clearly seen in Fig. 4. T1 to T4 contained
significantly (1 % level) less ammonium than T5 and T6, but not significantly
different amounts of nitrate.
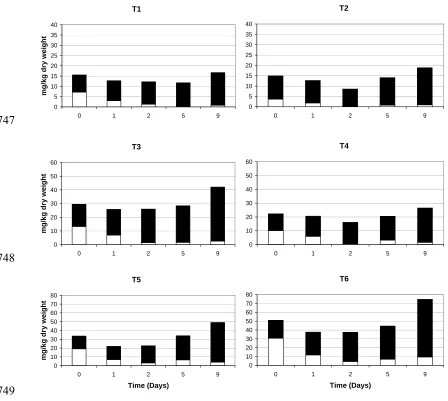
Nitrate-N spiking at room temperature:
Figure 5 shows how the total extractable mineral N concentration, and the
contributions of nitrate-N and ammonium-N to the total mineral N, changed over the
nine days following the addition of the 50 μg nitrate-N spikes with incubation at room
temperature. It is clear that in all the soils (T1 – T6), there is no evidence of nitrate
330
331
332
333
334
335
336
337
338
339
340
341
342
343
344
345
346
347
348
349
350
351
352
353
354
355
356
357
358
359
360
361
362
nitrate concentration actually slightly increased at t5 and t9 in this experiment.
However in the road salt-impacted soils (T1 – T4), ammonium appeared to decline by
nitrification over the first 1 –2 days, but this was only significant for T1. Over a
longer time scale there was evidence of nitrification in all six soils. Ammonium was
starting to accumulate by day 9, and this was especially marked and significant at 1 %
for the most acidic, control soils (T5 & T6), but this production of ammonium
resulted also in significant nitrate build up for T4 to T6. Slight accumulation might be
anticipated because of the elimination of any plant N-uptake in this experiment.
Deionised water blank spiking at room temperature:
Figure 6 shows how the contributions of nitrate-N and ammonium-N to the total
mineral N changed over the nine days following the addition of the deionised water
blank spikes with incubation at room temperature. For the most heavily impacted
soils (T1 & T2), nitrate dominated the mineral N fraction, especially after 24 h of
incubation. The contribution made by ammonium-N was much greater in the
unpolluted, control soils (T5 & T6) throughout the experiment, and the more
moderately polluted soils exhibited an intermediate trend. ANOVA showed that for
ammonium, T6 > T1 to T4, but T5 did not differ significantly from T1 to T4. In all
soils though the nitrate-N to ammonium-N ratio increased significantly over time.
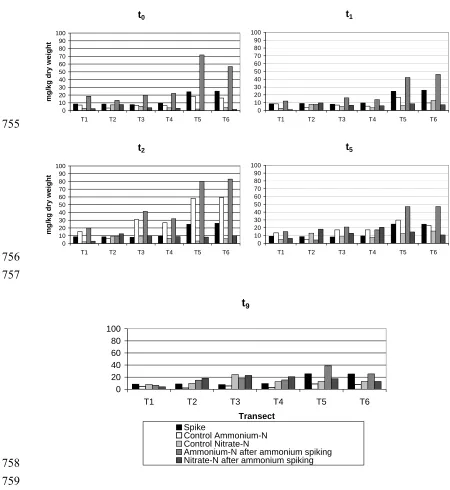
Incubations at 4 °C after ammonium-N spiking:
Figure 7 compares the nitrate-N and ammonium-N after ammonium spiking with the
nitrate-N and ammonium-N after deionised water blank spiking and with the spike
added flux. It shows how these values changed over 9 days with incubation at 4 °C.
All results are expressed on a dry weight soil basis, so although 50 μg of ammonium
N was always added, the spike size appears to vary because of variations in the soil
moisture content. The results clearly show that the spike size selected was very
appropriate.
Between t0 and t1, spike ammonium-N is lost in all soils to a significant extent
(compare bar 4 with bar 2), but interestingly not all is converted to nitrate-N (compare
bar 5 with bar 3). At the lower incubation temperature, nitrification initially seems
greater in the control soils (T5 & T6). By time t2, ammonification is extremely
ammonium-N-spiked soils (4th bars). By t5 much of the extra ammonium generated
appears to have been nitrified, however. 363
364
365
366
367
368
369
370
371
372
373
374
375
376
377
378
379
380
381
382
383
384
385
386
387
388
389
390
391
392
393
394
395
396
6. Discussion:
Variation in soil properties:
In the context of the present study, it is important to establish that the very substantial
differences in soil chemical composition for the three contamination scenarios are
primarily due to impacts of road drainage water and not just due to natural soil spatial
variations. Our preliminary field survey showed that the near-surface soils subjected
to the diverse pollution scenarios at the sampling distance from the road were all
highly organic, and when not adjacent to the road consistently very acidic (pH 3.8 to
4.3). There was no evidence however, compared with the soils further down-slope
from the road, of any foreign mineral matter from road construction. Moreover the
stones were similar in the control and roadside soils. However, the control soils were
apparently more organic rich, and was confirmed by subsequent LOI % measurement
(Table 2). It is therefore highly probable that differences between soils were
attributable not to natural variation, but to combined effects of road salt in runoff,
insoluble particulates from the salt, the additional water flux and associated soil
wetness and erosion effects, and possibly to soil particulates redistributed by vehicle
flow in both directions along the A6 being flushed from the road surface down drains.
The salt used in the area contains 7.5 % insoluble solids, which include small amounts
of gypsum and carbonate (Kay Monaghan, personnel communication).
In spite of the circum-neutral soil pH near drain outlets (Table 2), there was no
sign of well-developed cambisol formation, which might be expected if the variation
was natural. As will be seen later, and is clear in Table 2, the high sodium dominance
of CEC plays a major role in increasing the soil pH of these naturally highly acidic
soils. For one of the drain-impacted transects (T2), sodium occupied 85 % of the
CEC at 3 m from the road. For the same soil, calcium occupied much less of the CEC,
in spite of it being divalent, and the presence of significant amounts of calcium in the
road salt being used (ratio of 80:0.7:0.07 Na:Ca:Mg). Thus it seems that the sodium
in road drainage has a major impact on the soil chemistry. In addition the very high
concentrations of chloride in soil solutions at this site (up to 7 900 mg l-1 during salting, Green and Cresser, 2007) add credibility to the hypothesis that road salt is the
397
398
399
400
401
402
403
404
405
406
407
408
409
410
411
412
413
414
415
416
417
418
419
420
421
422
423
424
425
426
427
428
429
430
scenarios, as does the observation of dramatic seasonal shifts in soil pH for
salt-impacted soils only (Green and Cresser, 2007). However, as % Ca > % Na on CEC
for T3 and T4, it is clear that particulates and/or soluble calcium in splash from the
road must make an important contribution to soil partial neutralization.
Nitrate and Chloride in Crookdale Brook:
The sampling sites ranged over 1.5 km of the water course from S1, where there was
no road salt effect, to S7, with a progressive increase in the road effect. Site S7 might
be expected to have the greatest potential affect as it is closest to the road, with a
drainage pipe entering the system up slope, just prior to the river sampling point.
However, the concentration of nitrate-N at S7 is diluted by the introduction of
additional water from the Borrowdale Brook tributary prior to the sampling point.
This effect is more conspicuous for Cl- concentrations, when salting is applied after 22/11/2005. Above S1, the catchment area itself spans over ca. 7 km2; hence, the enhanced nitrate-N concentrations depicted in Fig. 2 are very significant, bearing in
mind the relative area of unaffected catchment upstream of S2. A considerable road
impact occurs within a few hundred metres, with enhancement being evident even in
mid-winter. The seasonality effect of soil microbial and plant uptake in the soil on
river water nitrate-N concentration at each sampling point is also apparent in Fig. 2.
The very wet conditions on the first two sampling dates, 12/10/2005 and
02/11/2005 would have contributed to the low river water nitrate concentrations by
dilution (Table 1). Although there was significant rainfall on 08/07/2006, much of
this was retained in dry soil, and probably plant N-uptake is more important over the
summer period.
Ammonium-N spiking:
It is clear from Figs. 3 and 4 that in the control soils (T5 & T6), if nitrification is
occurring at all, it is happening at a relatively slow rate compared with salt-affected
soils, and/or any nitrate being produced is being immobilised by soil microbial
biomass or lost by denitrification. The fact that ammonium-N concentration is
changing only slightly over time (Fig. 3) suggests that a very low nitrification rate is
the most likely cause. It is interesting however that when the soils were spiked only
with deionised water (Fig. 6), some nitrification of “native” soil ammonium-N is
431
432
433
434
435
436
437
438
439
440
441
442
443
444
445
446
447
448
449
450
451
452
453
454
455
456
457
458
459
460
461
462
463
464
pH in the control soils, then the additional chloride added with the ammonium spike
would, as a mobile anion, further lower the soil solution pH, reducing nitrification rate
even further upon ammonium-N spike addition. Although this explanation is
plausible, further experimentation, for example by NaCl spiking at corresponding
chloride concentrations, of the control soils would be needed to confirm a mobile
anion effect on pH.
The suggestion in the paragraph above that denitrification could be playing a
significant role is unlikely to be true. The nitrate concentrations over time changed
very little following spiking of the soils with nitrate (Fig. 5), which would not be the
case if denitrification rate was substantial. Moreover the soils were not particularly
wet even after spiking, and the amount of water added with the control deionised
water, ammonium-N and nitrate-N spikings was constant between treatments, so if it
occurred the denitrification rates would be similar for all treatments. Thus the
attribution of low nitrification rate to low pH is by far the most likely hypothesis.
Nitrate-N spiking:
Figure 5 showed no evidence of nitrate immobilisation by soil microbial biomass.
However in the road salt-impacted soils (T1 – T4), there was rapid decline in
ammonium-N over the first 1 –2 days. This was almost certainly by nitrification,
because total mineral N remained virtually constant over the first five days. This
suggests that the higher pH in the salt-impacted soils is again favouring nitrification.
Over a longer time scale nitrification was readily apparent in all six soils. The fact
that ammonium was starting to accumulate by day 9, especially in the most acidic,
control soils (T5 & T6), supports the hypothesis that greater acidity in the control soils
inhibits nitrification, or rather that the increase in soil pH caused by the salting impact
is greatly favouring nitrification.
Deionised water blank spiking:
The data in Fig. 6 show that nitrification is particularly dominant in the salt-impacted
soils, as nitrate dominated the mineral N fraction for the most heavily impacted soils
(T1 & T2) and for the soils experiencing intermediate salt impacts (T3 & T4). As
mentioned in the results section, the contribution of ammonium-N was much greater
in the unpolluted, control soils (T5 & T6) throughout the experiment. However, as
465
466
467
468
469
470
471
472
473
474
475
476
477
478
479
480
481
482
483
484
485
486
487
488
489
490
491
492
493
494
495
496
497
clearly nitrification is occurring in all of the soils. In all soils mineralisation proceeds
at a significant rate between days 2 and 9, but the mineral N pool consistently was
lower when the salt impact was higher. This probably reflects the lower organic
matter content that has evolved in the salt impacted soils, probably from reduced plant
growth leading to a reduced pool of mineralisable N. However we can only speculate
about the extent to which this reflects enhanced leaching losses of organic C and N
over many years, enhanced decomposition of organic matter at the higher soil pH that
is a consequence of the salting impact over several decades, or reduced input of plant
litter as a consequence of salt impacts upon vegetation growth.
Incubations at 4 °C after ammonium-N spiking:
Although nitrification still appeared to be significant even at 4 °C and in all soils, the
marked long-term salt application impacts were much less pronounced at the lower
temperature, and indeed it appeared that nitrification was more important in the most
acidic, control soils (T5 & T6). Thus it could be concluded that the influence of soil
pH upon nitrification rate is highly temperature dependent.
Possible salting effects on N cycling other than effects of increased soil pH:
It cannot be stated categorically that some residual salinity effect and other possible
effects outlined in the introduction are not occurring, but if they have adverse effects
upon relevant microbial activity they must be small compared to the acidity
neutralisation effect. This experiment points to the importance of long-term, soil pH
effects being very important over summer months. If over many years potentially
toxic heavy metals have been mobilized in the roadside soils, then in all probability
after decades they will have leached out of the roadside soil system. Heavy metals in
soil solution in these roadside soils were determined in another phase of the present
study, but no toxic metals were found at potentially toxic concentrations.
The loss-on-ignition data in Table 2 indicate much lower soil organic matter
content in the salt-impacted soils compared with the control soils, again suggesting
the importance of long-term effects. It is notable from Fig. 6 that the total mineral N
pools were lowest in the most salt effected soils (T1 & T2), and greatest in the control
soils (T5 & T6). This suggests that loss of organic matter over several decades is
498
499
500
501
502
503
504
505
506
507
508
509
510
511
512
513
514
515
516
517
518
519
520
521
522
523
524
525
526
527
528
529
530
531
This could act as a constraint to the enhanced nitrate leaching to adjacent freshwaters
to some extent.
7. Conclusions:
It is highly probable that that the degree of salt exposure of the soil, in the longer term,
controls the rates of key microbial N driven processes primarily by increasing soil pH.
With the increasing amounts of nitrate-N from nitrification of incoming ammonium
there is potential for enhanced nitrate loading of waterways in UK uplands due to
leaching, which has particular relevance to the Water Framework Directive. Figure 2
clearly illustrates a strong influence on nitrate-N concentrations along the Crookdale
Brook.
This study differs from those that preceded it in that the soils used have
chemical and physical properties that have evolved over decades of varying degrees
of salt exposure. Theories based upon salinisation processes in arid climates or upon
experiments in which previously uncontaminated soils are suddenly exposed to high
doses of road salt are inappropriate when trying to explain current soil behaviour.
Some of the effects observed were almost certainly reflect influence of particulates in
the road runoff, as well as the effect of sodium chloride in solution.
The results reported here are very relevant when assessing the fate of inputs of
ammonium to soils from atmospheric pollution. Additional influxes of ammonium-N
to salt impacted soils may lead to enhanced nitrification and thereafter, increased
leaching of nitrate-N to the local waterways, even at 4 oC. However at winter
temperatures nitrification appeared to be much less sensitive to the pH effect. The use
of road salts thus disrupts the proportional contribution of nitrate-N and ammonium-N
to the mineral inorganic fraction of roadside soils, as well as being likely to lead to
ammonium-N leaching by cation exchange.
Acknowledgements:
We are grateful to NERC, DERFA and the University of York for financial support
for this research, and to Kay Monaghan of Salt Union for helpful information about
532
533
534
535
536
537
538
539
540
541
542
543
544
545
546
547
548
549
550
551
552
553
554
555
556
557
558
559
References:
Amrhein, C., Strong, J. E. and Mosher, P. A. 1992. Effect of deicing salts on metal
and organic-matter mobilization in roadside soils. Environmental Science &
Technology 26, 703-709.
Astebol, S. O., Pedersen, P. A., Rohr, P. K., Fostad, O. and Soldal, O. 1996. Effects
of de-icing salts on soil water and vegetation. Norwegian National Road
Administration, Report MITRA, 05/96, Oslo 63pp.
Azam, F., and Muller, C. 2003. Effect of sodium chloride on denitrification in glucose
amened soil treated with ammonium and nitrate nitrogen. Journal of Plant Nutrition
and Soil Science, 166, 594-600.
Bäckström, M., Karlsson, S., Backman, L., Folkeson, L. and Lind, B. 2004.
Mobilisation of heavy metals by deicing salts in a roadside environment. Water
Research 38, 720-732.
Bauske, B. and Goetz, D. 1993. Effects of de-icing-salts on heavy-metal mobility.
Acta Hydrochimica et Hydrobiologica, 21 (1), 38 – 42.
Bayuelo-Jiménez, J. S., Debouck, D. G., and Lynch, J. P. 2003. Growth, gas exchange,
water relations, and ion composition of Phaseolus species grown under saline
conditions. Field Crops Research, 4131, 1 – 16.
Blomqvist, G. and Johansson, E. L. 1999. Airborne spreading and deposition of
de-icing salt -- a case study. The Science of The Total Environment 235, 161-168.
Bryson, G. M. and Barker, A. V. 2002. Sodium accumulation in soils and plants along
Massachusetts roadsides. Communications in Soil Science and Plant Analysis, 33 (1
– 2), 67 – 78.
Cape, J. N., Tang, Y. S., van Dijk, N., Love, L., Sutton, M. A. and Palmer, S. C. F.
2004. Concentrations of ammonia and nitrogen dioxide at roadside verges, and their
560
561
562
563
564
565
566
567
568
569
570
571
572
573
574
575
576
577
578
579
580
581
582
583
584
585
586
587
588
589
590
591
Darban, A. K., Foriero, A., and Yong, R. N. 2000. Concentrations effects of EDTA
and chloride on the retention of trace metals in clays. Engineering Geology, 57, 81 –
94.
Demers, C. L., and Sage Jr., R. W. 1990. Effects of road deicing salt on chloride
levels in four Adirondack streams. Water, Air and, Soil Pollution, 49, 369 – 373.
Duckworth, C.M.S. and Cresser, M.S. 1991. Factors influencing nitrogen retention in
forest soils. Environmental Pollution, 72, 1 – 21.
DOE & DOH. 2001. Order Adding Toxic Substances to Schedule 1 to the Canadian
Environmental Protection Act, 1999. Canada Gazette Part I, 135 (48), 4335 – 4246.
Fostad, O. and Pedersen, P. A. 2000. Container-grown tree seedling responses to
sodium chloride applications in different substrates. Environmental Pollution, 109,
203 – 210.
Green, S. M. and Cresser, M. S. 2007. Spatial and temporal variations in the effects of
road salting on the properties of upland soil and soil solutions down slope of a
highway. Submitted for publication.
Grolimund, D., Borkovec, M., Barmettler, K. and Sticher, H. 1996. Colloid-facilitated
transport of strongly sorbing contaminants in natural porous media: A laboratory
column study. Environmental Science & Technology 30, 3118-3123.
Kayama, M., Quoreshi, A. M., Kitaoka, S., Kitahashi, Y., Sakamoto, Y., Maruyama,
Y., Kitao, M., and Koike, T. 2003. Effects of deicing salt on the vitality and health of
two spruce species, Picea abies Karst and Picea glehnii Masters planted along
roadsides in northern Japan. Environmental Pollution, 124, 127 – 137.
Larcher, W. 1995. Physiological Plant Ecology, Third Edition. Springer-Verlag,
592
593
594
595
596
597
598
599
600
601
602
603
604
605
606
607
608
609
610
611
612
613
614
615
616
617
618
619
620
621
622
623
Laura, R.D. 1974. Effects of neutral salts on carbon and nitrogen mineralization of
organic matter in soil. Plant and Soil, 41, 113 - 127.
Laura, R. D. 1977. Salinity and Nitrogen Mineralization in Soil. Soil Biology and
Biochemistry, 9, 333 - 336.
Löfgren, S. 2001. The chemical effect of de-icing salt on soil and stream water of five
catchments in southeast Sweden. Water, Air, and Soil Pollution, 130, 863 – 868.
McBean, E. and Al-Nassri, S. 1987. Migration Pattern of Deicing Salts from Roads.
Journal of Environmental Management 25, 231-238.
McCormick, R. W., and Wolf, D. C. 1980. Effect of sodium chloride on CO2
evolution, ammonification and nitrification in a Sassafras sandy loam. Soil Biology
and Biochemistry, 12, 153 – 157.
Mattson, M. D., and Godfrey, P. J. 1994. Identification of Road Salt Contamination
Using Multiple Regression and GIS. Environmental Management, 18 (5), 767 – 773.
Mayer, T., Snodgrass, W. J., and Morin, D. 1999. Spatial Characterization of the
Occurrence of Road Salts and Their Environmental Concentrations as Chlorides in
Canadian Surface Waters and Benthic Sediments. Water Quality Research Journal of
Canada, 34 (4), 545 – 574.
Norrstrom, A. C. and Bergstedt, E. 2001. The impact of road de-icing salts (NaCl) on
colloid dispersion and base cation pools in roadside soils. Water Air and Soil
Pollution 127, 281-299.
Norrstrom, A. C. and Jacks, G. 1998. Concentration and fractionation of heavy metals
in roadside soils receiving de-icing salts. The Science of The Total Environment 218,
161-174.
Ohno, P. 1990. Levels of total cyanide and NaCl in surface waters adjacent to road
624
625
626
627
628
629
630
631
632
633
634
635
636
637
638
639
640
641
642
643
644
645
646
647
648
649
650
651
652
653
654
655
656
Pierzynski, G. M., Sims, J. T., and Vance, G. F. 2000. Soils and Environmental
Quality, Second Edition. CRC Press, Boca Raton, Florida.
Ruth, O. 2003. The effects of de-icing in Helsinki urban streams, Southern Finland.
Water Science and technology, 48 (9), 33- 43.
Sarin, C., Hall, J. M., Cotter-Howells, J., Killham, K., and Cresser, M. S. 2000.
Influence of complexation with chloride on the responses of a lux-marked bacteria
bioassay to cadmium, copper, lead and mercury. Environmental Toxicology and
Chemistry, 19, 259 – 264.
Scott, W. S. 1976. The effect of road deicing salts on sodium concentration in an
urban water-course. Environmental Pollution, 10 (2), 141 – 153.
Serrano, R. and Rodriguez-Navarro, A. 2001. Ion homeostasis during salt stress in
plants. Current Opinion in Cell Biology, 13, 399 – 404.
Shainberg, I. and Letey, J. 1984. Response of Soils to Sodic and Saline Conditions.
Hilgardia 52, 1-57.
Shanley, J. B. 1994. Effects of ion-exchange on stream solute fluxes in a basin
receiving highway deicing salts. Journal of Environmental Quality, 23 (5), 977 – 986.
Smart, R., White, C. C., Townsend, J. and Cresser, M. S. 2001. A model for
predicting chloride concentrations in river water in a relatively unpolluted catchment
in north-east Scotland. The Science of the Total Environment, 265, 131 – 141.
Smol, J. P., Brown, S. R., and McNeely, R. N. 1983. Cultural disturbances and tropic
history of a small meromictic lake from central Canada. Hydrobiologia, 103, 125 –
130.
Townsend, A. M. 1980. Identifying trees with tolerance to soil salts. Metro. Tree
657
658
659
660
661
662
663
664
665
666
667
Truscott, A. M., Palmer, S. C. F., McGowan, G. M., Cape, J. N. and Smart, S. 2005.
Vegetation composition of roadside verges in Scotland: the effects of nitrogen
deposition, disturbance and management. Environmental Pollution 136, 109-118.
Viskari, E. L., and Kärenlampi, L. 2000. Roadside Scots Pine as an indicator of
de-icing salt use – A comparative study from two consecutive winters. Water, Air and
Soil Pollution, 122, 405 – 419.
Williams, D. D., Williams, N. E., and Cao, Y. 1999. Road salt contamination of
groundwater in a major metropolitan area and development of a biological index to
Table 1: Precipitation (mm) at Shap weather station (MET Office) and daily
mean flows for the River Lune, proxy for the Crookdale Brook (m
668
669
670
671
672
673
674
675
676
677
678
679
680
681
682
683
684
685
686
687
688
689
690
691
692
693
694
695
696
3
s-1)
(Environment Agency) for the freshwater sampling dates.
Table 2: Chemical properties of soils for T1-T6 at 3 m from the wall. All results
are means of duplicate determinations, with standard errors within the
parentheses. Soils were sampled in July, 2006.
Figure 1: Map showing the location of the field Site. (C) Crown Copyright
Ordnance Survey. All rights reserved.
Figure 2: The change in nitrate-N and chloride concentration (mg l-1 – means of
two replicates) with time and distance along Crookdale Brook for the period
12/10/2005 – 08/07/2006. Interval bars show 95 % confidence.
Figure 3: Changes over 9 days (t0 - t9) in the total mineral N (total bars),
ammonium-N (white bars) and nitrate-N (black bars) for sites T1 – T6 for the
ammonium-N spiking experiment with incubation at room temperature. Note
the changes in vertical scales used. All results are means of two replicates.
Figure 5: Changes over 9 days (t0 - t9) in the total mineral N (total bars),
ammonium-N (white bars) and nitrate-N (black bars) for sites T1 – T6 for the
nitrate-N spiking experiment with incubation at room temperature. Note
changes in scale for T5 and T6. All results are means of two replicates.
Figure 4: Change over 9 days in the percentage contributions of ammonium-N
(white bars) and nitrate-N (black bars) to total mineral-N (complete bars)
content for the ammonium-N spiking experiment at room temperature. All
697
698
699
700
701
702
703
704
705
706
Figure 6: Changes over 9 days (t0 - t9) in the total mineral N (total bars),
ammonium-N (white bars) and nitrate-N (black bars) for sites T1 – T6 for the
deionised water spiked controls with incubation at room temperature. Note
changes in scale. All results are means of two replicates.
Figure 7. Comparison of the nitrate-N and ammonium-N after ammonium
spiking with the nitrate-N and ammonium-N after deionised water blank spiking
and with the spike size. The figure shows how these values changed over 9 days
Table 1: Precipitation (mm) at Shap weather station (MET Office) and daily
mean flows for the River Lune, proxy for the Crookdale Brook (m
707
708
709
710
3
s-1)
(Environment Agency) for the freshwater sampling dates.
Sampling Date Precipitation (mm) Daily Mean Flow (m3 s-1) Limb Status
12/10/2005 10.2 16.2 Falling
02/11/2005 22.6 16.6 Rising
22/11/2005 0.2 1.71 Falling
09/12/2005 0.4 1.99 Falling
03/01/2006 0.6 3.95 Falling
27/01/2006 0.6 2.18 Falling
20/04/2006 0.6 2.11 Falling
08/07/2006 10.6 1.43 Peak
Table 2: Chemical properties of soils for T1-T6 at 3 m from the wall. All results are means of duplicate determinations, with standard
errors within the parentheses. Soils were sampled in July, 2006.
712
713
Transect pH (H2O)
Water Content (%)* LOI (%) CEC (MEQ)
NO3
-(mg
kg-1)
Na+
(%)
Ca2+
(%)
Mg2+
(%) K
+
(%) H+ (%) NH4
+
(%)
T1 6.66
(0.01) 35.7 (0.33) 16.07 (1.37) 110 (24.36) 1.47 (0.06) 30.7 (6.4) 18.9 (0.51) 1.64 (0.16) 0.44 (0.10) 48.8 (6.05) 0.79 (0.11)
T2 8.11
(0.03) 33.12 (0.05) 14.37 (1.75) 59.7 (27.02) 3.65 (0.11) 84.9 (30.3) 28.3 (8.7) 2.16 (0.18) 0.00 (0.28) 0.00 (21.35) 0.3 (0.16)
T3 4.62
0.04) 33.04 (0.67) 17.26 (0.47) 145 (1.31) 1.37 (0.03) 1.79 (0.12) 2.91 (0.25) 1.33 (0.25) 0.41 (0.20) 94.0 (0.61) 0.39 (0.09)
T4 5.11
(0.05) 40.07 (1.70) 28.97 (1.63) 91.5 (11.46) 1.92 (0.26) 5.26 (0.58) 9.55 (1.57) 1.25 (0.37) 0.53 (0.11) 84.0 (2.52) 0.64 (0.05)
T5 3.79
(0.04) 77.38 (7.39) 72.23 (1.36) 337 (116) 5.99 (0.01) 0.62 (0.26) 0.24 (0.17) 0.81 (0.17) 0.21 (0.71) 98.3 (0.59) 0.79 (0.56)
T6 3.82
(0.01) 77.51 (0.68) 54.43 (2.01) 281 (88) 5.37 (0.24) 0.96 (0.41) 0.00 (0.17) 0.8 (0.20) 0.0015 (0.038) 98.3 (0.44) 0.63 (0.44) *
Soil water content wet weight.
715
716
717
718
[image:28.595.76.497.80.475.2]719
Figure 1: Map showing the location of the field Site, UK. The A6 road runs due
north across the centre of the insert map; S1 – S7 indicate the river sampling
2005
0 0.05 0.1 0.15 0.2 0.25 0.3 0.35 0.4
S1 S2 S3 S4 S5 S7
N
itrate-N (mg/l)
2006
0 0.05 0.1 0.15 0.2 0.25 0.3 0.35 0.4
S1 S2 S3 S4 S5 S6
N
itrate-N (mg/l)
720
0 2 4 6 8 10 12
S1 S2 S3 S4 S5 S7
Sample ID
Ch
lo
rid
e
(mg
/l)
12/10/2005 02/11/2005 22/11/2005 09/12/2005
0 5 10 15 20 25 30
S1 S2 S3 S4 S5 S7
Sample ID
Ch
lo
rid
e
(mg
/l)
03/01/2006 27/01/2006 20/04/2006 08/07/2006
721
722
723
724
[image:29.595.85.502.78.320.2]725
Figure 2: The change in nitrate-N and chloride concentration (mg l-1 – means of
two replicates) with time and distance along Crookdale Brook for the period
T1
0 10 20 30 40 50 60
0 1 2 5 9
mg/kg dry wei
ght
T2
0 10 20 30 40 50 60
0 1 2 5 9
726
T3
0 10 20 30 40 50 60 70 80
0 1 2 5 9
mg/kg dry wei
ght
T4
0 10 20 30 40 50 60 70 80
0 1 2 5 9
727
T5
0 20 40 60 80 100 120 140 160
0 1 2 5 9
Time (Days)
mg/kg dry wei
ght
T6
0 20 40 60 80 100 120 140 160
0 1 2 5 9
Time (Days)
728
729
730
731
[image:30.595.56.504.74.457.2]732
Figure 3: Changes over 9 days (t0 - t9) in the total mineral N (total bars),
ammonium-N (white bars) and nitrate-N (black bars) for sites T1 – T6 for the
ammonium-N spiking experiment with incubation at room temperature. Note
T1
0% 20% 40% 60% 80% 100%
0 1 2 5 9
% I
nor
gan
ic-N
Composi
tion
T2
0% 20% 40% 60% 80% 100%
0 1 2 5 9
733
T3
0% 20% 40% 60% 80% 100%
0 1 2 5 9
% I
nor
gan
ic-N
Composi
tion
T4
0% 20% 40% 60% 80% 100%
0 1 2 5 9
734
T5
0% 20% 40% 60% 80% 100%
0 1 2 5 9
Time (Days)
% Inor
ganic-N
Composi
tion
T6
0% 20% 40% 60% 80% 100%
0 1 2 5 9
Time (Days)
735
736
737
738
[image:31.595.53.506.74.462.2]739
Figure 4: Change over 9 days in the percentage contributions of ammonium-N
(white bars) and nitrate-N (black bars) to total mineral-N (complete bars)
content for the ammonium-N spiking experiment at room temperature. All
T1
0 10 20 30 40 50 60
0 1 2 5 9
mg/kg dry wei
ght
T2
0 10 20 30 40 50 60
0 1 2 5 9
740
T3
0 10 20 30 40 50 60
0 1 2 5 9
mg/kg dry wei
ght
T4
0 10 20 30 40 50 60
0 1 2 5 9
741
T5
0 20 40 60 80 100 120 140 160
0 1 2 5 9
Time (Days)
mg/kg dry wei
ght
T6
0 20 40 60 80 100 120 140 160
0 1 2 5 9
Time (Days)
742
743
744
745
[image:32.595.56.504.74.459.2]746
Figure 5: Changes over 9 days (t0 - t9) in the total mineral N (total bars),
ammonium-N (white bars) and nitrate-N (black bars) for sites T1 – T6 for the
nitrate-N spiking experiment with incubation at room temperature. Note
T1
0 5 10 15 20 25 30 35 40
0 1 2 5 9
mg/kg dry wei
ght
T2
0 5 10 15 20 25 30 35 40
0 1 2 5 9
747
T3
0 10 20 30 40 50 60
0 1 2 5 9
mg/kg dry wei
ght
T4
0 10 20 30 40 50 60
0 1 2 5 9
748
T5
0 10 20 30 40 50 60 70 80
0 1 2 5 9
Time (Days)
mg/kg dry wei
ght
T6
0 10 20 30 40 50 60 70 80
0 1 2 5 9
Time (Days)
749
750
751
752
[image:33.595.57.505.74.475.2]753
Figure 6: Changes over 9 days (t0 - t9) in the total mineral N (total bars),
ammonium-N (white bars) and nitrate-N (black bars) for sites T1 – T6 for the
deionised water spiked controls with incubation at room temperature. Note
754
t0
0 10 20 30 40 50 60 70 80 90 100
T1 T2 T3 T4 T5 T6
mg/
k
g dry weigh
t
t1
0 10 20 30 40 50 60 70 80 90 100
T1 T2 T3 T4 T5 T6
755
t2
0 10 20 30 40 50 60 70 80 90 100
T1 T2 T3 T4 T5 T6
mg/
k
g dry weigh
t
t5
0 10 20 30 40 50 60 70 80 90 100
T1 T2 T3 T4 T5 T6
756
757
t9
0 20 40 60 80 100
T1 T2 T3 T4 T5 T6
Transect
Spike
Control Ammonium-N Control Nitrate-N
Ammonium-N after ammonium spiking Nitrate-N after ammonium spiking
758
759
760
761
762
763
[image:34.595.52.502.91.581.2]764
Figure 7. Comparison of the nitrate-N and ammonium-N after ammonium
spiking with the nitrate-N and ammonium-N after deionised water blank spiking
and with the spike size. The figure shows how these values changed over 9 days