TRAINING, JOB SATISFACTION
AND ESTABLISHMENT PERFORMANCE
RESEARCH REPORT 22
MAY 2007
TRAINING,
JOB SA
TISF
A
CTION
AND EST
ABLISHMENT PERFORMANCE
RESEARCH REPOR
T 22 – MA
Y 2007
This report is a summary of a research report carried out by WELMERC and the University of Wales Swansea on behalf of the Sector Skills Development Agency.
To obtain copies of this document contact Sector Skills Development Agency Callflex Business Park
Golden Smithies Lane Wath-upon-Dearne South Yorkshire S63 7ER
TRAINING, JOB SATISFACTION AND ESTABLISHMENT
PERFORMANCE
Peter J. Sloane
Melanie K. Jones
Richard J. Jones
Paul L. Latreille
May 2007
University of Wales Swansea
Department of Economics
Sector Skills Development Agency: Research Series
Foreword
In October 2002 the Department for Education and Skills formally launched Skills for
Business (SfB), a new UK-wide network of employer-led Sector Skills Councils
(SSCs), supported and directed by the Sector Skills Development Agency (SSDA).
The purpose of SfB is to bring employers more centre stage in articulating their skill
needs and delivering skills-based productivity improvements that can enhance UK
competitiveness and the effectiveness of public services. The remit of the SSDA
includes establishing and progressing the network of SSCs, supporting the SSCs in
the development of their own capacity and providing a range of core services.
Additionally the SSDA has responsibility for representing sectors not covered by an
SSC and co-ordinating action on generic issues.
Research, and developing a sound evidence base, are central to the SSDA and to
Skills for Business as a whole. It is crucial in: analysing productivity and skill needs;
identifying priorities for action; and improving the evolving policy and skills agenda. It
is vital that the SSDA research team works closely with partners already involved in
skills and related research to generally drive up the quality of sectoral labour market
analysis in the UK and to develop a more shared understanding of UK-wide sector
priorities.
The SSDA is undertaking a variety of activities to develop the analytical capacity of
the Network and enhance its evidence base. This involves: developing a substantial
programme of new research and evaluation, including international research;
synthesizing existing research; developing a common skills and labour market
intelligence framework; taking part in partnership research projects across the UK;
and setting up an expert panel drawing on the knowledge of leading academics,
consultants and researchers in the field of labour market studies. Members of this
panel will feed into specific research projects and peer review the outputs; be invited
to participate in seminars and consultation events on specific research and policy
issues; and will be asked to contribute to an annual research conference.
The SSDA takes the dissemination of research findings seriously. As such it has
developed this dedicated research series to publish all research sponsored by the
SSDA and results are being made available in both hard copy and electronically on
the SSDA website.
Lesley Giles
Index of Contents
Executive Summary ... i
Chapter 1 – Introduction... 1
Chapter 2 – Literature Review... 5
2.1
Introduction ... 5
2.2
Training ... 5
2.2.1
Definition and Measurement ... 5
2.2.2
The Determinants of Training ... 5
2.2.3
The Incidence of Training ... 7
2.2.4
The Impact of Training ... 9
2.3
Job Satisfaction... 10
2.3.1
Definition and Measurement ... 10
2.3.2
The Determinants of Job Satisfaction ... 10
2.3.3
Levels of Job Satisfaction ... 12
2.3.4
The Impact of Job Satisfaction... 12
2.4
Performance ... 12
2.4.1
Definition and Measurement ... 12
2.4.2
Determinants of Performance ... 13
2.4.3
The Level of Performance... 13
2.4.4
The Longer Term Impact of Performance ... 14
Chapter 3 – The Data Sets In Detail... 15
3.1
Introduction ... 15
3.2
Skills Survey 2001 ... 15
3.2.1
Collection of Information ... 15
3.2.2
Data Description ... 16
3.2.3
Specific Features of the Data-set... 16
3.2.4
How is the Skills Survey used in this Report?... 16
3.3
The British Household Panel Survey ... 17
3.3.1
Collection of Information ... 17
3.3.2
Data Description ... 17
3.3.3
Specific Features of the Data-set... 18
3.3.4
How is the BHPS used in this Report?... 18
3.4
Workplace Employment Relations Survey (WERS) 2004 ... 18
3.4.1
Collection of Information ... 18
3.4.2
Data Description ... 19
3.4.3
Specific Features of the Data-set... 20
3.4.4
How is WERS used in this Report? ... 20
Chapter 4 – The Determinants of Training ... 21
4.1
Introduction ... 21
4.2
Types of Measures of Training in the 3 Data-sets... 21
4.2.1
Skills Survey 2001 ... 21
4.2.2
British Household Panel Survey (BHPS) ... 22
4.2.3
Workplace Employment Relations Survey (WERS 2004) ... 23
4.3
The Determinants of Training... 24
4.3.1
Skills Survey 2001 ... 25
4.3.2
British Household Panel Survey (BHPS) ... 27
4.3.3
Workplace Employment Relations Survey (WERS 2004) ... 34
4.4
Chapter Summary... 46
5.1
Introduction ... 48
5.2
Measure of Job Satisfaction in the 3 Data-sets... 48
5.2.1
Skills Survey 2001 ... 48
5.2.2
British Household Panel Survey (BHPS) ... 48
5.2.3
Workplace Employment Relations Survey (WERS) ... 48
5.3
Modelling the Determinants of Job Satisfaction ... 49
5.3.1
Skills Survey 2001 ... 49
5.3.2
British Household Panel Survey (BHPS) ... 52
5.3.3
Workplace Employment Relations Survey (WERS) ... 59
5.4
Conclusions ... 68
Chapter 6 – Establishment Performance... 70
6.1
Introduction ... 70
6.2
Measures of Establishment Performance ... 70
6.3
Modelling the Determinants of Performance ... 71
6.4
Descriptive Data... 72
6.5
Econometric Specification... 74
6.6
Econometric Results ... 75
6.7
Descriptive Statistics on Quits and Absence... 82
6.8
Econometric Results ... 84
6.9
Conclusions ... 89
Appendix ... 94
(a) Determinants of training... 95
(b) Determinants of Job Satisfaction ... 96
Executive Summary
1: Introduction
This research was commissioned by the Sector Skills Development Agency to help develop
the evidence around one of its key research themes – Understanding the demand for skills
and the link between skills and performance. The research seeks to do this by examining
three questions. First what determines the incidence of employee training in the workplace?
Second, does training affect job satisfaction? And third, does training affect workplace
performance either directly or indirectly through its affect on job satisfaction? In attempting
to answer the above questions we make use of three different data sets – the Skills Survey
2001, the British Household Panel Survey (BHPS), 1991-2004, and the Workplace
Employment Relations Survey 2004 (WERS), together with its panel of establishments
1998-2004.
2: Literature Review
The study commenced with a review of the literature. Training is normally defined in terms of
a period off-the-job either at the workplace or off the premises. It can be measured as the
proportion of workers receiving training over a defined period of time and/or by the duration
of the activity. Key factors explaining its incidence are personal characteristics of the worker
such as gender, age, qualifications, union membership and length of tenure and structural
characteristics such as whether work is full-time or part-time, the size of the employer and
the industry. Both degree of competition in the labour market and the geographical density
of employment units can influence its incidence. One study suggests that an increased
incidence of training raises value added more than it raises wages.
Virtually all studies find that most workers have high levels of job satisfaction, though women
appear to have higher levels of job satisfaction than men, at least in the UK. Other important
determinants of job satisfaction are age, education and absolute and relative pay. Fewer
studies have focused on the impact of training on job satisfaction. A number of studies
have, however, found that higher levels of job satisfaction result in reduced absenteeism, a
lower quit rate and higher productivity.
Performance is most often measured in terms of productivity and profitability. Both of these
will be influenced by market share and the degree of competition in the market-place. UK
productivity is low by international standards, though the gap has declined in recent years
examine the impact of training on performance1, for instance, one suggests that incremental
training increases the probability of long-term firm survival2 and another finds that training
can improve financial performance3.
3: The data sets
The Skills Survey 2001 involved face to face interviews with 4,470 individuals. There is a
detailed job analysis and the possibility of examining changes over a five year period.
Specific features are the possibility of examining the relationship between skills and job
satisfaction and the nature of tasks and the structure of work.
The British Household Panel Survey (BHPS) is an annual survey of 5,500 households which
has been conducted since 1991. The same individuals are, as far as possible,
re-interviewed each year, which means that one can follow individual behaviour over time.
There are questions on both training and job satisfaction.
The Workplace Employment Relations Survey (WERS) 2004 covers 2,300 workplaces and a
sample of 22,500 employees from these workplaces, with only establishments with less than
five employees being excluded from the sample. The survey of management includes
subjective performance measures and questions on training offered to the largest
occupational group. The survey of employees includes questions on training and facets of
job satisfaction. A new financial performance questionnaire provides objective data on
financial performance and productivity for a sub-sample of establishments from which data
were collected in 1998, so it is possible to examine changes in performance over time.
4: The determinants of training
The questions asked in each of the three data sets are not entirely consistent and in the
BHPS have changed over time, so that this must be borne in mind in interpreting the results
from modelling the determinants of training. The Skills Survey suggests that the varying
incidence of training across industries is a function of the specific features of jobs within
these industries. Previous qualifications increase the likelihood of training, but if the worker
is over-educated for the current job (as defined by the employee), this reduces the likelihood.
The BHPS confirms the varying incidence of training across industry with some variation
over time. The econometric analysis suggests that being young, with qualifications, in a
professional job and being a member of a trade union increases the likelihood of training,
1
See Tamkin et al., Skills Pay: The Contribution of Skills to Business Success, 2005.
2
See Collier et al., Training and Establishment Survival, 2007.
3
while being male, single, disabled and living in Scotland reduces it. WERS suggests that the
incidence of training is much higher than implied in the other two data sets with up to two
thirds of employees in the sample receiving some (non-health and safety) training in the
preceding twelve months. The variability of training across industry is confirmed both with
respect to incidence and duration. The most common subject of training is health and safety
followed by the operation of new equipment and computing skills. Organisation size is an
important determinant of the likelihood of training, as is gender. These results suggest that it
is inappropriate to assume that all types and durations of training have the same
determinants and therefore, the impacts may also be different.
5: Job satisfaction
The Skills Survey includes a question on overall job satisfaction. Job satisfaction is found to
vary across industries. Women have higher job satisfaction than men, but not significantly
so when controls for personal and employment characteristics are included. Unlike the case
in earlier studies, pay seems more important to the job satisfaction of women than of men.
For both genders being able to use acquired skills on the job raises job satisfaction, but
training appears to have no significant effect on job satisfaction.
The BHPS also has a question on overall job satisfaction, but in addition includes questions
on various facets of job satisfaction. Here, those that have been trained tend to have higher
job satisfaction, but not significantly so across all industries, and over all time periods. The
econometric analysis also suggests that women have significantly higher levels of job
satisfaction than men. Self-funded training has a negative effect on job satisfaction and
employer funded training a positive effect in waves 11-14.
WERS does not include a question on overall job satisfaction, but it does have questions on
various facets of job satisfaction. Those who have received training in the past year are
significantly more satisfied on all satisfaction indicators than those who have not. The
econometric analysis suggests that males, disabled workers, the more highly qualified, union
members, and those working in larger establishments are generally less satisfied than those
who do not fall into these categories. Having received training in the previous twelve months
is positively and significantly related to all seven facets of job satisfaction even after
controlling for other potential determinants of satisfaction. However very short periods of
training do not have such an effect. Thus, while the analysis finds a number of common
6: Establishment performance
Only WERS contains data which enable us to analyse the effect of training and job
satisfaction on performance. An extra year of education increases the earnings of an
individual by about 6 percent and having received training by a similar amount. In addition
workers benefit substantially from the education of their co-workers, but no similar spill-over
effect could be found for the training of co-workers. Using managers’ subjective evaluations
of establishment performance relative to other establishments in the same sector training
appears to have a positive effect on establishment productivity and on financial performance
(profits). However, workplace education does not have any significant effect. Using
objective data on financial performance from the financial performance questionnaire no
significant effect of training could be identified. Average years of workplace education did
have a significant effect – the reverse of the case using subjective data. Higher levels of job
satisfaction are associated with lower rates of absenteeism and quit rates. The average
amount of time spent by the largest occupational group on training has a significant effect on
reducing quite rates, but this is the only training measure which shows a significant impact
on quit or absence rates. It is also possible to link the 2004 panel with 1998 to assess
changes in performance over this period, again based on managers’ subjective
assessments. It was found that certain degrees of training intensity did have positive effects
on establishment survival and employment growth, though it is difficult to disentangle cause
and effect in this case.
7: Conclusions
In relation to the three questions raised initially we can say first that training intensity varies
considerably across industries and is influenced by personal characteristics such as gender,
age and qualifications. Second, certain types of training can raise levels of job satisfaction.
Third, training and/or job satisfaction can improve establishment performance in relation to
productivity, profits, absenteeism, quits and long-term growth. But the effects differ and
depend on the particular types and extent of training provided and on whether worker skills
are effectively utilised. It is dangerous, therefore to infer that training is homogenous and
equal, or greater, consideration needs to be given to the use of skills by workers in the
workplace. Further research is required on the differing results on subjective and objective
measures of establishment performance. It appears that they may be measuring different
things. Managers may regard their companies as competing in a narrow segment of a
particular industry, while objective data can only be assessed in terms of industries defined
Chapter 1 – Introduction
In this chapter we outline the main questions to be addressed in this report and
provide a general introduction to the research. In 2002, the Government set up the
Sector Skills Development Agency (SSDA) with responsibility for developing the new
network of 25 Sector Skills Councils (SSCs). Together they constitute the Skills for
Business network, which is leading on working with employers to equip them with the
skills they need.
Over the long term, by operating with key partners, the Skills for Business network
aims to address four strategic/high level goals:
- Improvement in productivity, business and public services performance through
specific strategic and targeted skills and productivity action;
- Reduction of skills gaps and shortages and anticipation of future needs;
- Increased opportunities to develop and improve the productivity of everyone in
the sector’s workforce, including action to address equal opportunities;
- Improvement in the quality and relevance of public learning supply, including the
development of apprenticeships, higher education and national occupational
standards.
The SSDA has commissioned a number of research projects to develop
understanding in key areas, fill gaps in knowledge and thus strengthen the evidence
base. This report presents the findings of one such project under the research theme
of ‘Understanding the Demand for Skills and the links between skills and
performance’.
An important strategic goal of the Skills for Business network is improving
productivity, business and public services’ performance through specific strategic and
targeted skills and productivity action. Recent research by the National Institute of
Economic and Social Research (NIESR) and others4 indicate that skills are an
important component of the productivity gap with the UK’s major competitors,
suggesting that as much as one-fifth of the productivity gap between the UK and
Germany could be explained by the UK’s relatively low level of skill within the
workforce. This issue was also identified by the Leitch Review of Skills in the UK
4
(2005) which noted that improving the flow of better qualified young entrants into the
labour market would be insufficient to close the productivity gap since 70 per cent of
the workforce 15 years ahead will have already finished compulsory education. This
places the focus on the need for both training and retraining of existing workers.
The aim of this project is to consider the relationship between training, job
satisfaction and economic performance at establishment level, based on the
secondary analysis of three data sets. In particular, the three main questions
investigated are:
1) What determines workplace training incidence?
2) Does training affect employee job satisfaction?
3) Does training affect company performance either directly or indirectly through
the effect of training on job satisfaction?
Investigating these questions requires us first to identify the amount of training
undertaken and the form it takes. We need also to identify how its incidence varies
across sectors and particular types of employee. A good discussion of the existing
literature is contained in Shields (1998) as outlined in Chapter 2. Training can have a
direct effect on economic performance if it serves to make the individual more
proficient at his or her job, but it can also have an indirect effect if it increases job
satisfaction by, for instance, making it easier to perform the job or making the
individual feel that the employer is providing training because he or she values the
individual worker. A more satisfied worker may put more effort into performance of
his or her duties and be more likely to stay with the firm which will then benefit from
the greater experience of its workforce. A useful survey of the job satisfaction
literature in the UK can be found in Green and Tsitsianis (2005), while the
relationship between training and business performance is detailed in Cosh et al.
(2003) and Dearden et al. (2006).
At the outset it must be recognised that training can take many forms including
induction training, on-the-job and off-the-job, formal and informal training through
work experience, training for young workers and (re-) training for adults. Its
incidence can be measured through the proportion of workers trained and/or the
duration of training. It may be paid for by the employer or the employee. We can
also distinguish between general and specific training. General training increases
providing the training as in other firms. Specific training has no effect on the
productivity of trainees that would be useful to other firms (e.g. induction training).
We would expect workers rather than firms to bear the costs of general training as
the firm would lose the benefit of the training if the worker moves. In contrast, we
would expect firms to bear the costs of specific training as they will gain the benefits
as the worker cannot use the skills received elsewhere. In analysing such issues we
are, however, constrained by the precise nature of the training questions contained in
each of our three data sets. This diversity makes interpretation of its effects
somewhat hazardous.
Job satisfaction is normally measured on a ranking scale such as 1 to 7 with 1
representing the response of a worker who is totally dissatisfied with his or her
current job and 7 representing the response of a worker who is completely satisfied
with his or her current job. However, we cannot necessarily assume that each point
on the scale represents the same thing to each or every worker or that workers are
not affected by mood swings over time. However, such measures seem to be good
predictors of worker behaviour such as likelihood of quitting the current job.
Workplace performance may be measured in terms of productivity (e.g. output per
worker or output per hour), product quality (perhaps measured in terms of the
percentage of items produced that are fit for sale) or in terms of financial
performance such as profitability. Measuring performance in terms of only one of
these measures could, therefore, fail to capture some of the benefits of training.
Three data sets are used in this study. The first of these is the Skills Survey 2001
which can be used to investigate the link between skills and job satisfaction.
Individuals were asked whether they had undertaken any job-related training since
completing full-time education and a second question asked them about different
types of training they may have undertaken. The second is the British Household
Panel Survey (BHPS) which has been carried out annually since 1991 and surveys
the same respondents at regular intervals. In the first seven waves there were two
training questions, but thereafter only one different question was asked, which means
that we must analyse waves 1-7 and subsequent waves separately. The third data
set is the Workplace Employment Relations Survey (WERS) 2004. The survey
contains both cross-section and panel elements with interviews with senior managers
and up to 25 employees in each workplace. Thus we have matched
employer-employee data. Managers were asked about the proportion of experienced staff who
covered and its objectives. Likewise employees were asked how much training they
had received in the previous 12 months, their satisfaction with it and how the work
skills they have match the skills needed to do the job. A new financial performance
questionnaire enables us to estimate the effects of training and job satisfaction on
establishment performance for a sub-sample of the establishments covered in the
main survey.
We have chosen to adopt a thematic approach in this report. After a brief literature
review we describe the three data sets in some detail. Then we examine the
determinants of training, followed by an analysis of the impact of training on job
satisfaction and its impact on establishment performance. The final chapter attempts
Chapter 2 – Literature Review
2.1 Introduction
In this chapter we consider three distinct aspects of the labour market literature. The
first relates to training in terms of its definition and measurement, its determinants,
incidence and its impact. The second aspect relates to job satisfaction, again
examining in turn its definition and measurement, its determinants, incidence and its
impact. The third element is performance. While we are again concerned with its
definition and measurement, in examining its determinants we are particularly
concerned with how training and job satisfaction impact upon it, incidence in this
case referring to the level of performance. Finally, there is the question of how
performance determines the growth and survival of the organisation.
2.2 Training
2.2.1 Definition
and
Measurement
Training is about improving the level of skill of the individual worker. This may occur
simply as a result of the worker learning by doing, but this is better regarded as a
return to experience. Thus we define training as a period off-the-job either at the
workplace or off the premises. Whether this is paid for by the employer or the
employee it represents an investment on which a return is obtained in the future.
Often data sets simply report the response to a question (yes or no) on whether an
individual has received training over a specified period of time. A question may be
asked about the duration of training specified over a range of time periods. Both
these questions are relevant in judging the impact of training as outcomes may differ
according to training duration, perhaps depending also on the mode of delivery and
the type of job or individual receiving it.
2.2.2
The Determinants of Training
The probability of training being offered by employers and undertaken by employees
is far from random. Thus, Shields (1998), reviewing the literature, reports that the
probability of an individual receiving training is positively related to the level of
negatively related to age, part-time work and length of job tenure. There is less
agreement, he suggests, over the roles of gender, stage of technological advance,
public or private sector5 and whether the incidence of training moves procyclically.
Table 2.1 reproduced from his paper reports the main findings in the British literature.
Since Shields wrote there have been a number of developments. Thus, as he
himself notes, we would expect the continued ageing of the workforce to reduce the
demand for training as this shortens the period over which the costs of training can
be recouped. In contrast, the increased level of education in the workforce should
increase the demand for training, given the positive relationship between the two.
Jones, Latreille and Sloane (2005) found that the training ‘advantage’ previously
enjoyed by men has now been reversed with women now more likely to participate in
training, and there is similar evidence for some other countries (see Arulampalam et
al., 2004). The Labour Force Survey (LFS) results for the UK show that the gender
differential in favour of women exists for several different definitions of training: any
training, on- and off-the-job training with an employer contribution, and any training
involving an employer contribution. Consideration of changes in training incidence
over the period 1995-2001 suggests that most of this change in favour of women
cannot be explained by the industrial and occupational distribution of employment by
gender. It still remains the case, however, that part-time women are less likely to
receive training than full-time women.
The incentive to train will also be a function of the degree of competition in the labour
market and the extent to which wages are compressed. Acemoglu and Pischke
(1998) developed an imperfect competition model based on the notion that the
degree of monopoly power of an employer in the local labour market will decline the
greater the employees’ probability of re-employment with other employers. The
denser or more concentrated in terms of population the local labour market the better
the matching opportunities for potential employees and the higher the probability of
re-employment either through workers changing jobs voluntarily or employers
poaching workers from other firms. This will have the effect of making training more
general and less profitable to the employer, thereby reducing the incentive to train.
Such agglomeration effects have been found for Britain by Brunello and Gambarotto
(2004) using the European Community Household Panel for 1997. Their results
suggest that a 10 per cent increase in geographic density will reduce the probability
5
of employer provided training by 0.07 (more than 20 per cent of its average
incidence). Related to these agglomeration effects is the notion that the employers’
incentive to provide training will be greater the greater the degree of wage
compression (i.e. the narrower the gap between the pay of a skilled and an unskilled
worker) as this makes skilled workers relatively more profitable. Using WERS 1998
data Almeida-Santos and Mumford (2005) found that higher levels of wage
compression (whether measured in absolute or relative terms) were, indeed,
positively related to the incidence of training.6
2.2.3 The Incidence of Training
The most recent quarterly training statistics available from the LFS are reported in
Table 2.2. These suggest that there are no strong seasonal effects on the incidence
of training measured as the receipt of job related training in the last four weeks.
These figures compare favourably with those recorded in other countries. They
confirm that the incidence is higher for women than for men, for those aged under 24,
for those in managerial and professional occupations and for those in service
industries. The BHPS has different questions on the incidence of training than the
LFS. Since 1998, respondents are asked about the number of training schemes they
have undertaken in the last 12 months, their duration, type and whether it led to a
qualification. Booth and Bryan (2005) used data from waves 8 to 10 for private
sector, full-time employees aged 16-65 years. For each wave approximately 30 per
cent of individuals received training, the vast majority of which was regarded as
general, but contrary to expectations, paid for by the employer.
6
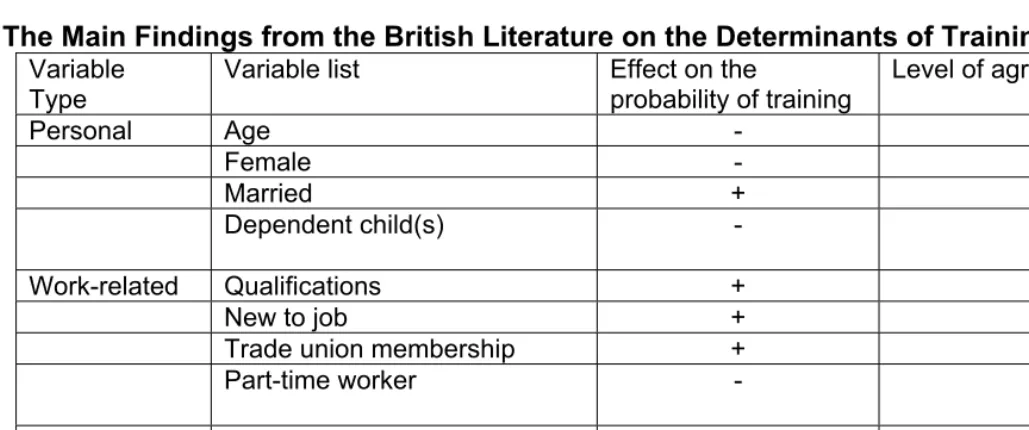
Table 2.1:
The Main Findings from the British Literature on the Determinants of Training
Variable Type
Variable list Effect on the
probability of training
Level of agreement
Personal Age - #
Female - ?
Married + ?
Dependent child(s) - ?
Work-related Qualifications + #
New to job + #
Trade union membership + #
Part-time worker - #
Employer Public sector + ?
High technology industry + ?
Small employer - #
High regional unemployment - ?
Note: A ‘#’ in the final column indicates a relationship which has a general consensus, whilst a ‘?’ refers to relationships for which conflicting findings are observed.
Source: Shields (1998)
Table 2.2:
Job Related Training in Great Britain
Sep 2003-
Aug 2004
Dec 2003- Nov 2004
Mar 2004- Feb 2005
Jun 2004- May 2005
Working-age people receiving job related training in the last 4 weeks as % of all working age people
13.4 13.6 13.6 13.7
Working-age males receiving job-related training
in the last 4 weeks as % of all working age males 12.2 12.3 12.3 12.3
Working-age females receiving job-related training in the last 4 weeks as % of all working age females
14.7 15.0 15.0 15.1
People aged 25-retirement receiving job-related training in the last 4 weeks as % of all people 25-retirement age
11.7 11.9 11.9 11.9
Employees & self-employed receiving job-related training in the last 4 weeks as % of all employed & self-employed
14.5 14.7 14.7 14.7
Employees + self-employed in
manual/professional occupations receiving job-related training in the last 4 weeks as % of all employees and self-employed
19.0 19.3 19.2 19.2
Employees & self-employed in service industries receiving job-related training in the last 4 weeks as % of all employees and self-employed
16.1 16.4 16.4 16.4
2.2.4 The Impact of Training
The link between training and productivity has been discussed comprehensively in
earlier research reports for the SSDA7, so we merely summarise some of this here.
Tamkin et al. (2004) note that most training periods are short, much of it is driven by
statutory requirements such as health and safety rather than business needs, and
only about half of it leads to formal qualifications. Therefore, it is doubtful if all
training activities impact positively or equally on performance. However they report
that several studies at the level of the firm have shown that increasing training
activity, the type of training provided and its depth can all, in practice, positively
influence performance. As Dearden, Reed and Van Reenan (2006) point out the
standard approach in the literature is to assume that wages equal marginal
productivity and, therefore, suffice to capture the impact on productivity. That is, if
wages increase after training the assumption is that this is the case because workers
are more productive as a consequence of the training. Dearden et al. are, however,
able to measure the impact on productivity directly using a panel of British industries
over the period 1983 to 1996. They find that a 1 percentage point increase in training
using the LFS measure of incidence is associated with an increase in value added
per hour of about 0.6 per cent, but an increase in wages of only 0.3 per cent due to
monopoly power of the employer in the labour market. It appears, therefore, that part
of the improvement in productivity is captured by the employer, so that using wages
to measure productivity will tend to underestimate the size of the productivity gain.
Finally, when they compare their industry and individual level wage regressions they
find that longer lengths of time in training are associated with significantly higher
wages, consistent with training externalities.
The importance of the type of training was highlighted by Barrett and O’Connell
(1998), who suggest that vocational training has the greatest impact on wages and
productivity when it is specific to the firm providing it. General training, on the other
hand, tends to have less impact on individual firm performance. Depth of training
has been examined in a series of papers by Cosh et al. in 1998, 2000 and 2003.
They conclude that training was linked to improved business performance, at least
over part of the periods they analysed. They also found a strong and significant
effect of training on employment growth for small firms which were persistent
trainers, but not for those which were ad hoc trainers. Finally, especially for larger
7
firms, there seemed to be an association between intensity of training and
profitability.
2.3
Job Satisfaction
2.3.1 Definition
and
Measurement
Job satisfaction was defined by Locke (1976) as “a pleasurable or positive emotional
state resulting from the appraisal of one’s job or job experiences” (p. 1300). This
obviously is a subjective judgement and information on it can only be obtained from
workers themselves. This is normally achieved by presenting respondents with a
ranking scale, frequently, but not always, from 1 to 7 and asking them to rank their
job on this scale in relation to the overall job aspects. Some surveys also ask them
to rank different facets of the job on such a scale, often including the nature of work
itself, the level of pay, hours of work, promotion prospects, job security and
inter-personal relations. In this way it is possible to compare job satisfaction in different
work environments, among different categories of worker and over time.
2.3.2
The Determinants of Job Satisfaction
While psychologists and sociologists have investigated various aspects of job
satisfaction over many years it is only comparatively recently that economists have
taken an interest in this phenomenon recognising that it can shed light on a number
of aspects of worker behaviour. Economists suggest there is a trade-off between
earnings and hours of work with satisfaction rising with increases in real wages and
decreasing as hours of work rise. However, there is also evidence to suggest that
these features are not the only or even the most important determinants of job
satisfaction. In particular, individuals obtain satisfaction from the nature of work itself,
from feelings of job security, from relationships with co-workers, promotion prospects
and being able to use their initiative (Clark, 1996). Both absolute and relative pay
have been found to influence job satisfaction as workers beliefs about what is
equitable are governed not first by what they earn, but also by what other workers in
comparable jobs earn (Rees, 1993; Baxter, 1973 and 1993). In the case of the UK
studies of job satisfaction generally find that women report higher levels of
determinants of overall satisfaction, with men being more concerned with pay and
promotion than women (Sloane and Williams, 2000).
Among other findings are a u-shaped relationship between overall job satisfaction
and age with those in their 20s and 30s being the least satisfied. There is a strongly
negative relationship between self-reported physical health and job satisfaction.
There is a negative relationship also between education and job satisfaction, which is
not easy to explain but may be due to rising aspirations among the more educated.
Non-white people tend to be less satisfied than white people, married people more
satisfied than single people, renters more satisfied than those paying off their home
through a mortgage and those in certain regions more satisfied than others. The
most satisfied workers are also found in smaller establishments. Finally, union
membership is negatively associated with job satisfaction, though this may simply
reflect the fact that more dissatisfied workers are more likely to join a union (see
Bender and Sloane, 1998).
In this study we are concerned with the impact of training on job satisfaction and
generally in the earlier literature this has not been included directly in estimating
models. One exception is a study of 13 countries based on the European
Community Household Panel (ECHP) 1994-2001, by Siebern-Thomas (2005), who
found that job satisfaction tended to be higher where there was access to training at
the workplace. However, a number of studies have examined related variables.
Thus Battu, Belfield and Sloane (1999) found that graduates who were
over-educated (i.e. who were in jobs that did not require a degree) had significantly lower
job satisfaction than those graduates who were in graduate-type jobs. Green and
Tsitsianis (2005) found likewise for a cross section of workers that job satisfaction
was lower for both over-educated and under-educated workers in their British
sample. Bauer (2004), using data from the European Survey on Working Conditions
(ESWC) covering all EU member states, showed that higher involvement of workers
in High Performance Work Organisations (HPWOs)8 was associated with higher job
satisfaction. He includes in his model a skill index derived from information on the
number of days of training paid for or provided by the employer in the past 12
months. The skill index has a positive and significant effect on job satisfaction for the
8
15 countries overall, but does not reach significance for the UK. WERS 2004
included a question on how well the skills the individuals possessed matched the
skills needed to do their present job and over half the sample felt they were
over-skilled.
2.3.3 Levels of Job Satisfaction
Most workers appear to be satisfied with their job. Thus using wave 11 of the BHPS
Jones and Sloane (2004) find that the mean recorded level of overall job satisfaction
for all workers in 2002 was 5.37 on a 7 point scale, with women having a mean of
5.49 compared to 5.23 for men. This suggests that dissatisfied workers are likely to
leave their current job, while satisfied workers tend to stay. There is an incentive for
employers, therefore, to try and ensure that they have satisfied workforces if they
wish to reduce labour turnover. Job satisfaction does, however, appear to have been
declining somewhat in Britain. Green and Tsitsianis (2005) find that contrary to
popular belief this does not appear to be a result of an increase in job insecurity, but
rather the result of the intensification of work effort and declining task discretion.
2.3.4 The Impact of Job Satisfaction
Empirical research has shown that responses to questions on job satisfaction are
strong predictors of individual behaviour over such dimensions as voluntary quits,
absenteeism and productivity (see, for instances, Mangioni and Quinn, 1975,
Hamermesh, 1977, Freeman, 1978 and Clegg, 1983). Thus, whilst it might be true
that what two individuals perceive to be ‘very satisfied’ or ‘very dissatisfied’ may not
match each other very well, it is still true that satisfied workers are more likely to be
productive and less likely to quit or be absent from work than those workers who
report low levels of job satisfaction. However, it is also the case that direct studies of
the relationship between job satisfaction and productivity are rare in Britain.
2.4 Performance
2.4.1 Definition
and
Measurement
The ultimate measure of a company’s performance is profitability which is most
by increasing output and/or reducing costs and additional training might be designed
to achieve either of these. Productivity is normally measured in terms of output per
worker, but for comparative purposes needs to take into account the number of hours
worked and the quality of the workforce. Thus, one establishment might be more
productive than another because it has a higher ratio of skilled workers or more
capital per worker. For such reasons productivity might be measured in terms of
value added, which takes into account the cost of bought - in materials.
2.4.2 Determinants of Performance
Tamkin et al. (2004) note that there is a range of productivity performance among
individual firms in the UK with the best performing firms in the manufacturing sector
around five times more productive than the worst. This is partly explained by a
significant positive relationship between productivity and market share (i.e. size
matters). One must, however, also take into account the degree of competition in
product markets, since firms exposed to a high degree of competition at home and
abroad will have to be efficient to survive. It is also generally held that skills are an
important element in closing the productivity gap as large sections of the UK
economy are dependent on the management and processing of knowledge and
information (see DTI, 1995 and 2003).
2.4.3 The Level of Performance
The UK performs below the European Union average with respect to labour
productivity per hour worked, achieving 90 per cent of the EU average in 2002, which
is a smaller gap than ten years earlier. However, there are larger differentials
between sectors than between countries and regions. Jagger et al. (2005) show, for
instance, that the UK has above average total factor productivity performance (a
more comprehensive measure) relative to 15 other countries in 13 of 23 sectors
included in the analysis, ranking first in one sector (Other Products and Recycling)
and second in 5 others including Agriculture; Food, Drink and Tobacco; Transport;
2.4.4 The Longer Term Impact of Performance
Collier, Green and Pierson (2005) examined the relationship between training,
profitability and establishment survival, using the 1990 Workplace Industrial Relations
Survey (WIRS) and a follow-up survey conducted in 1998. They found that 181 of
the original 1,693 establishments in the sample had closed down by 1998. Nearly 19
per cent of those establishments not undertaking training closed down compared with
13 per cent of those which did not (a significant difference), which suggests training
increases the probability of business survival9. In another study using the 1998
WERS, Addison and Belfield (2004) find that training also has a significant positive
effect on financial performance.
However, the nature of the management of the firm may influence training outcomes.
High performance workplaces may be able to extract a higher return from a given
training input than is the case for other establishments. The SSDA’s model of
capability, linking individual capability with organisational action and development
with deployment is an attempt to make this more explicit. As Tamkin et al. (2004)
state we need to learn more about precisely how these aspects contribute to
performance and to highlight differences between organisations/sectors providing
high value added strategies and those pursuing low cost strategies.
9
Chapter 3 – The Data Sets In Detail
3.1 Introduction
As outlined in the first chapter the aim of the project is to analyse the relationship
between training, job satisfaction and economic performance at establishment level
using econometric techniques. However, no single data set is ideal for this purpose
since it is unusual to find all three aspects covered in a single survey. Further, the
questions asked may differ and as we have seen training has several dimensions
and particular surveys may be conducted at different times. For this reason we
analyse three separate data sets. The first, the Skills Survey 2001, has a range of
questions on training, the nature of jobs and job satisfaction, but as it is a survey of
employees it cannot provide information on establishment performance. The second,
the British Household Panel Survey is similar to the above as it is a household survey
including questions on training and job satisfaction, and having no data on company
performance. Its advantage over the Skills Survey is that it is a panel, so that we can
examine changes over time. The third data set, WERS 2004 is a survey of
establishments, but contains information on individuals within them. It, therefore,
provides matched employer-employee data. This makes it particularly useful for
examining the relationship between training, job satisfaction and company
performance. In 2004 a separate financial performance questionnaire was applied to
a sub-sample of establishments, which is particularly important given the nature of
this project. It is, therefore, the only data set covering all three aspects and is
complementary to the other two data sets used in this study. Using all three data
sets, however, enables us to cover a wider range of training questions than otherwise
would be possible. Below we outline the way in which information was collected, a
description of the data and specific features of the data for each of the three data
sets.
3.2
Skills Survey 2001
3.2.1 Collection
of
Information
This survey was carried out by the ESRC Research Centre on Skills, Knowledge and
Organisational Performance (SKOPE) on behalf of the Department for Education and
Great Britain aged between 20 and 60. The main focus was on the skills that
individuals use in their jobs and their relationships to individual and job
characteristics and labour market rewards. The survey replicated many aspects of
an earlier Skills Survey conducted in 1997, enabling one to assess the degree of
change over the period 1997 to 2001. However, there was some commonality also
with the Social Change and Economic Life Initiative Survey (SCELI) conducted in
1986-87 and the Employment in Britain Survey 1992. An analysis of changes over
the full period 1986-2001 is contained in Felstead, Gallie and Green (2002).
3.2.2 Data
Description
The data in the 2001 Survey cover employment, skills currently held and held five
years ago, detailed job analysis, computing skills, educational attainment,
organisations, pay, changes over the past five years and demographic
characteristics. Full variable descriptions are contained in Appendix Table A1.
3.2.3 Specific Features of the Data-set
The Survey can be used to investigate the link between skills and job satisfaction, or
more specifically how qualifications, more general skills and training impact on job
satisfaction. In addition, it is possible to identify the importance of organisational and
job specific requirements in determining levels of job satisfaction as there is detailed
information on skill utilisation, the nature of tasks (e.g. repetition) and the structure of
work (e.g. employee views considered by management). Since training may also
have a direct link with company performance the determinants of training receipt are
also covered, again focusing specifically on skills and the structure of work.
3.2.4 How is the Skills Survey used in this Report?
In chapter 4 we analyse the two different measures of training incidence by industry
and estimate probit models in each case, controlling for a large number of job
characteristics. In chapter 5 we began with a descriptive analysis of job satisfaction
by industry. Ordered probit models are considered separately for men and women
again controlling for personal and job characteristics. There are, however, no data in
the Skills Survey that can be used to estimate the effect of training and job
3.3 The British Household Panel Survey
3.3.1 Collection
of
Information
The British Household Panel Survey (BHPS) is an annual survey or panel consisting
of a nationally representative sample of about 5,500 households recruited in 1991,
containing a total of approximately 10,000 interviewees. The sample is a stratified
clustered design drawn from the Post Code Address File and all residents present at
those addresses at the first wave of the survey were designated as panel members.
These same individuals are re-interviewed every year and are followed up even if
they leave the household to form a new household. Similarly, new members joining
sample households, together with children as they reach the age of 16 are
interviewed. The Institute for Social and Economic Research at the University of
Essex is responsible for carrying out the survey, of which there are now 14 waves in
the public domain.
3.3.2 Data
Description
The core questionnaire contains a broad range of social science and policy issues
including household composition, housing conditions, residential mobility, education
and training, health and usage of the health services, labour market behaviour,
socio-economic values and income from employment, benefits and pensions.
There is also a variable component containing questions which are not asked on a
regular basis and questions designed to provide retrospective data on panel
members’ life histories prior to their first interview. For the purposes of this study we
make use of questions on training and job satisfaction, but as a household survey
there are no data on company performance. Full variable descriptions are contained
3.3.3 Specific Features of the Data-set
The unique value of the BHPS is its panel structure which enables us to control for
unobservable factors which may determine individual behaviour. It follows the same
representative sample of individuals over a period of years. It is household based,
including every adult member of households in the survey and it contains sufficient
cases for meaningful analysis of certain groups, such as the young and the elderly,
the highly educated and the less well educated. Additional samples of 1,500
households in each of Scotland and Wales were added to the main sample in 1999
and in 2001 a sample of 2000 households was added in Northern Ireland, making the
panel suitable for regional analysis of the UK.
3.3.4 How is the BHPS used in this Report?
In chapter 4 we analyse separately the periods from 1990 to 1997 and 1998 to 2004
as the training questions altered after 1997. We also consider who pays for the
training, the reasons for training, whether a qualification was awarded and trends
over time across industries. A probit model is estimated to explain the determinants
of training. In chapter 5 we test whether those who have received training report
higher levels of job satisfaction than those who have not received any and also
whether this varies according to whether the employee or employer pays for it or
whether a qualification is obtained. Further we consider whether the reasons for
training are linked to the level of job satisfaction. As with the Skills Survey there are
no data which enable us to link training and job satisfaction to work performance.
3.4 Workplace Employment Relations Survey (WERS) 2004
3.4.1 Collection
of
Information
WERS 2004 is a national survey of workplaces sponsored jointly by the Department
of Trade and Industry (DTI), the Advisory, Conciliation and Arbitration Service
(ACAS), the Economic and Social Research Council (ESRC) and the Policy Studies
Institute (PSI). Earlier surveys were conducted in 1980, 1984, 1990 and 1998. The
survey contains both cross-section and panel elements. The former contains a
face-to-face interview with the senior manager responsible for personnel issues; a new
the previous twelve months; a face-to-face interview with a trade union
representative (where present) and/or a non-union employee representative; and a
self completion questionnaire distributed to a random sample of up to 25 employees
at each workplace.
In scope WERS 2004 covers all but the smallest workplaces (i.e. excluding those
with less than five employees) in Great Britain. It covers both private and public
sectors and almost all areas of industry. The principal unit of analysis is the
establishment or workplace, which is defined as comprising the activities of a single
employer at a single set of premises. Examples include a single branch of a bank, a
factory or a school.
The 1998-2004 Panel Survey returned to a random selection of workplaces that had
participated in the Cross-Section element of the 1998 WERS to identify change over
this period. Around 2,300 workplaces, 1000 employee representatives and 22,500
employees took part in the 2004 Cross-Section Survey. Around 950 surviving
workplaces participated in the 1998-2004 Panel Survey. New in 2004 is a financial
performance questionnaire providing quantitative data on productivity and
profitability.
3.4.2 Data
Description
The central focus is on the formal and structural relations which take place between
management and employees at the workplace. Principal topics in the management
interview include workforce composition, management of personnel and employment
relations, recruitment and training, workplace flexibility and the organisation of work,
consultation and information, employee representation, payment systems and pay
determination, grievance, disciplinary and dispute procedures, equal opportunities,
work-life balance, workplace performance and employee attitudes to work.
Topics covered in the Survey of Employees include working hours, job influence,
aspects of job satisfaction, working arrangements, training and skills, information and
consultation, employee representation and pay.
Topics covered in the Finance Performance Questionnaire include turnover (or
materials and services, employment costs and R&D activity. Full variable
descriptions are contained in Appendix A3.
3.4.3 Specific Features of the Data-set
The purpose of each survey is to provide large scale and systematic evidence on
numerous aspects of employment relations across most sectors of the British
economy. In particular, it provides a mapping of employment relations and enables
one to monitor changes over time. An important feature is that it provides matched
employer-employee data. This enables one to separate within-firm from between
firm variation and to compare management and worker responses to the same
questions.
3.4.4 How is WERS used in this Report?
In chapter 4 we consider first the amount of (non health and safety) training received
across industries over the previous twelve months. We then consider training
duration. From the management questionnaire we next consider the average
amount of training received by experienced workers in the largest occupational group
in each establishment and then the type of training received and the reasons for it.
The econometric analysis focuses on training incidence (estimated by random effects
ordered probit) and training intensity (ordered probit). In chapter 5 we consider
different facets of job satisfaction (as there is no question in WERS on overall job
satisfaction) and variations across industries and according to whether training has
been received in the last twelve months or not. In chapter 6 the focus is on
establishment performance both measured subjectively by managers and objectively
from the financial performance questionnaire. In addition we consider whether there
are spill-over effects from measuring education and training in the workplace and
changes over the period 1998 to 2004. Ordered probit analysis is carried out for
labour productivity and financial performance and tobit analysis of workplace
Chapter 4 – The Determinants of Training
4.1 Introduction
In this chapter we describe the main features of the training data contained in each of
the three data sets and then model the determinants of training for each data set
controlling as far as possible for personal and job characteristics. Finally we
conclude by assessing the extent to which the data sets are consistent in explaining
why some individuals and industries are more likely to receive training than in other
cases and the extent to which findings diverge across the data sets.
4.2 Types of Measures of Training in the 3 Data-sets.
4.2.1 Skills Survey 2001
The Skills Survey 2001 contains two alternative measures of training. The first
simply asks employees “since completing full-time education have you ever had, or
are you currently undertaking, training for the type of work you currently do?” From
this we can construct a dummy variable (train1) to assess the incidence of job-related
training across the sample. A second question elicits more information about the
nature of the training received, asking “since your last job three, four or five years
ago, have you done any of these types of training and/or education connected with
your job or a job that you might do in the future?”
(i) “received instruction whilst performing your normal job”,
(ii) “taught yourself from a book/manual/video/computer/cassette”,
(iii) “followed a correspondence course (such as Open University)”,
(iv) “taken an evening class”,
(v) “done some other work-related training”,
(vi) “none of these”.
Whilst, it is possible to calculate an alternative dummy variable (train2) from this
question such that any type of training is given a value of 1 and no training a value of
0 this will give a different measure of training incidence than train1. In fact, 58 per
cent of the sample respond positively to train1, but 77 per cent do so in the case of
difference could be explained by the inclusion of future career in train2, but possibly
more crucial is the likelihood that some individuals would not consider, unless
prompted, that options like “taught yourself” or “taken an evening class” constitute
training. In turn, this suggests that differences in individual perceptions of what
constitutes training can give rise to measurement error as individuals with the same
training experience may give different responses depending on the questions asked.
In so far as training questions refer to what happened in the past they may also be
subject to recall error.
The Skills Survey also contains more detailed information about the type and
duration of training for each of the training measures adopted. This is important, as
incidence may be a misleading indicator if some of it is of short duration or poor
quality. The length of training for train1 is divided into seven categories ranging from
less than one week to more than two years and that for train2 into five categories
ranging from at most one day to more than six months. There is also a question in
relation to both train1 and train2 on whether a qualification was awarded at the end of
the course. Train2 also provides details of training both for training in the last five
years and training with the current employer which can be used to examine who
provided and paid for the training, the extent to which it improved skills and the extent
to which it was useful to the current or other jobs.
4.2.2 British Household Panel Survey (BHPS)
The BHPS differs from the 2001 Skills Survey in two respects:
(1) it asks respondents about both job-related and non-job-related training, the
implications of which are potentially quite different.
(2) the nature of the question asked changed in the eighth wave and subsequently.
- In the first seven waves, 1991 to 1997, respondents were asked whether they
had “taken part in any education or training, other than training that was part of
any job you may have.” Individuals were also asked whether they had received
any work-related training/education in the previous year. This question could
relate to a broad range of training activities.
- For the following waves, respondents were only asked if “they had taken any
For waves 1-7 this restricts the analysis to work related training. For waves 8 to 14,
we also make use of a follow-up question, which asks who funds the training, to
restrict our analysis to training which has either been funded by an employer or
future employer through the New Deal scheme or by Training for Work/Employer
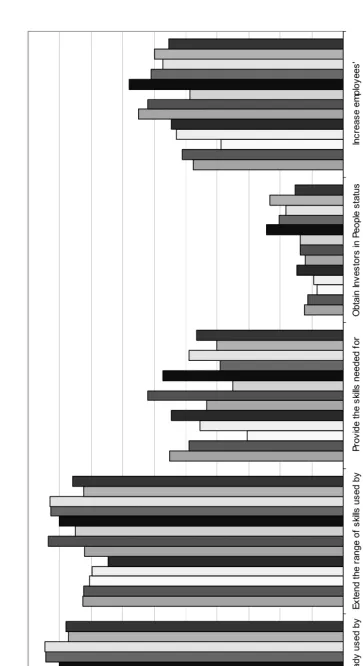
Training/TEC. In both cases they were also asked about the reasons for having
either type of training, whether to develop general skills, to prepare for a future job, to
extend the range of skills or to improve existing range of skills. A further question
asked them whether or not they received a qualification for the training received.
From 1998 respondents were asked whether they had taken any part-time courses in
the previous year and whether this was to help start the current job, increase or
improve skills in the current job, prepare for a future job or to develop skills generally.
As a panel data set the BHPS enables us to examine trends over time in each of
these aspects.
In the BHPS interviews, training is defined as at least potentially job-related, and
therefore excludes education or training undertaken as pastime, hobby or solely for
general interest.
4.2.3 Workplace Employment Relations Survey (WERS 2004)
WERS 2004 asked questions on training of both managers and employees. The
former were asked about the proportion of experienced staff who had been given
time off for training in the previous twelve months and also questions on the duration
of training, what it covered, its objectives and the amount of formal training that was
provided to enable workers to undertake tasks other than their own. Employees
were also asked how much training they had received in the previous twelve months,
their satisfaction with it and how the work skill they possessed matched the skills
needed to do the job. More particularly, the question explicitly excluded health and
safety training and the duration was divided into six categories from zero up to ten
days or more. The management questions related to the average number of days
training undertaken by experienced members of the largest occupational group over
the past twelve months. Managers were also asked about the proportion of
experienced members of the largest occupational group given time-off from normal
daily work duties to undertake training over the past twelve months. Further
skill (11 categories including health and safety) and on the purpose of the training (6
categories).
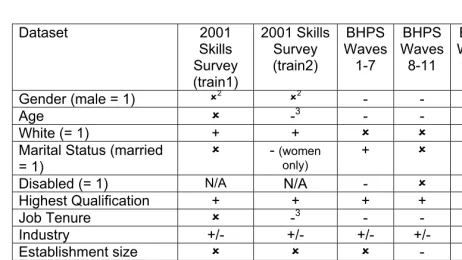
It can be seen, therefore, that there are some common elements in the training
questions asked in the three data sets (see Table 4.1). All of them have questions
on training incidence, its type and the reasons for it. However, there are also
distinctive features. Only the 2001 Skills Survey and WERS ask questions on the
duration of training, though even here the durations identified differ. Only the Skills
Survey and the BHPS asked whether a qualification was awarded. Only WERS
makes a clear distinction between health and safety and other forms of training and
specifies particular questions in relation to experienced members of the largest
occupational group. It also asks questions of both managers and employees,
enabling one to check whether answers on training are consistent between the two
sides of industry.
Table 4.1
Training Questions in the Data Sets
Training since
leaving full-time education
Training in the last 12
months
Types of training
Duration of training
Reasons for training
Qualification awarded
Skills Survey
¥ - ¥ ¥ ¥ ¥
BHPS - ¥ ¥ - ¥ ¥
WERS - ¥ ¥ ¥ ¥ -
For each data set we now review the evidence with regard to the determinants of
training, but we begin each summary of the analysis with an analysis of training by
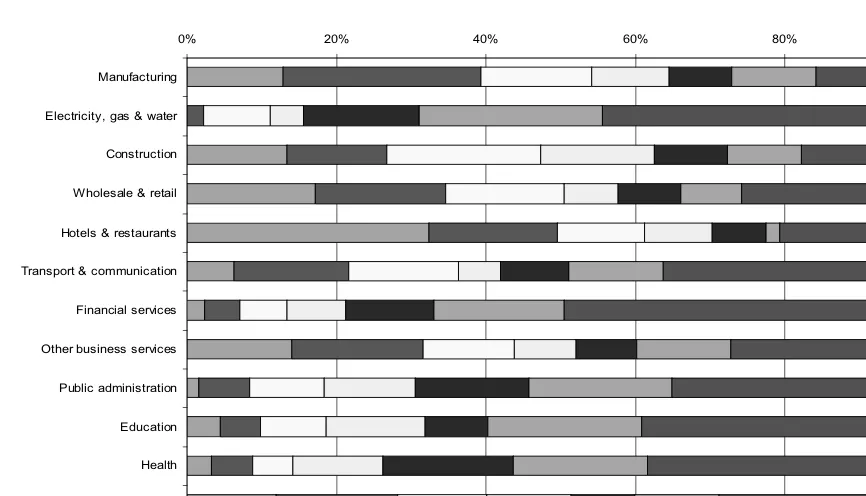
industry sector, as reported by each data set.
4.3 The Determinants of Training
The descriptive analysis will be followed by the results of econometric analysis to
explore the determinants of training. More detail on the methodology can be found in
4.3.1 Skills Survey 2001
Descriptive Statistics
The Skills Survey descriptive data (see the Appendix Table A1 for full variable
definitions) suggest that train1 (job-related training) tends to be of longer duration
than train2 (any training) answers. In the former case over