Report
Readability Analysis of
PISA 2012 Mathematics,
Science and Reading
Assessments
Readability Analysis of PISA 2012
Mathematics, Science and Reading
Assessments
Diane King
Bethan Burge
Published in April 2015
By the National Foundation for Educational Research, The Mere, Upton Park, Slough, Berkshire SL1 2DQ
© 2015 National Foundation for Educational Research Registered Charity No. 313392
ISBN 978-1-910008-55-3
How to cite this publication:
Contents
1
Introduction
1
2
The readability tests
2
2.1 Readability tests used 2
2.2 Limitations of readability analyses 5
3
Results of readability tests
6
3.1 Mathematics Stimuli 7
3.2 Science stimuli 8
3.3 Reading stimuli 11
4
Conclusions and recommendations
14
4.1 Mathematics 14
4.2 Science 14
4.3 Reading 15
4.4 Summary 15
1
Introduction
This report presents the results of an analysis of the readability of the PISA 2012 mathematics, science and reading assessment stimuli. Readability refers to the ease with which a text or document can be read and the purpose of this analysis was, therefore, to determine whether the readability of PISA 2012 tests is set at an appropriate level for the 15 year olds sitting them.
Analysis was conducted on the stimuli for each of the assessment clusters listed in Table 1 (further details on the development of what PISA measures, PISA scales and proficiency levels are included in the PISA 2012 Assessment and Analytical
Framework (OECD, 2013)).
Table 1 PISA 2012 mathematics, science and reading assessment
clusters
Domain Assessment cluster
Mathematics PM1, PM2, PM3, PM4, PM5, PM6A, PM7A
Science PS1, PS2, PS3
2
The readability tests
Readability tests are designed to assess the suitability of tests for pupils at particular grade levels or ages. They measure certain features of texts and subject these to mathematical calculations. A number of tests are available and have been developed for different purposes. Most have been developed in the United States and the outcomes are therefore measured with reference to the US grade system. The tests used in this analysis are based on American English but this is not thought to impact significantly on the results.
2.1 Readability tests used
The stimuli within each of the assessment clusters for mathematics
(PM1,2,3,4,5,6A,7A), science (PS1,2,3) and reading (PR1,2,3) were analysed using the following tests:
• Flesch-Kincaid
• New Dale-Chall
• New Fog Count
• SMOG
• Spache Revised
2.1.1
Flesch-Kincaid
This test is designed to assess the readability of technical documents and is mostly applicable to manuals and forms rather than information books or literary works. This test primarily uses sentence length and syllable count to generate its readability scores.
2.1.2
New Dale-Chall
This test is generally used to help classify school text books and literature for primary and secondary age readers. Sentence length and frequency of unfamiliar words are the main factors in this calculation of readability. The New Dale-Chall word list contains 3000 simple familiar words which more than 80 per cent of US 4th Grade (Wales Y5, pupils aged 9-10 years) pupils can understand.
As the test is based on the usage of familiar words rather than syllable or letter counts, it is often regarded as a more accurate test of readability for younger readers. It is also considered more appropriate than the Spache Revised (see section 2.1.5) for assessing the readability of texts designed for older children
2.1.3
New Fog Count
This is a modified version of the Gunning Fog Index which was created for the US Navy and was designed for technical documents and manuals. The readability score is based on sentence length and the number of words containing three or more syllables, with all numerals and proper nouns being treated as easy words. The index estimates the years of formal education needed to understand the text on a first reading.
2.1.4 SMOG
SMOG, colloquially known as Simple Measure of Gobbledygook, is generally appropriate for secondary age readers from 4th Grade to college level (Wales Y5 to Y13). SMOG tests for 100 per cent comprehension, whereas most readability tests test for around 50 to 75 per cent comprehension. This calculation is based upon sentence length and the number of words consisting of three or more syllables. For the SMOG test, numerals are fully syllabised (i.e. sounded out). As is the case for the New Fog Count, SMOG estimates the years of education needed in order for a reader to understand a piece of writing and is widely used, particularly for checking general public health messages. It is recommended for use by National Institute of Adult and Continuing Education (NIACE).
2.1.5 Spache Revised
This is generally used for primary age readers in the US Kindergarten to 7th grade (in Wales Y1 – Y8) to help classify school books and literature. Factors involved in producing a Spache readability score are sentence length and the proportion of unique unfamiliar words. The Spache Revised (1974) word list contains 1041 words which are considered familiar to pupils in the 3rd Grade (Welsh Y4, pupils aged 8-9 years) or below.
At the outset, it was considered that the Spache Revised might not be the most appropriate readability test for this stimuli and the decision was taken to reassess after analysis. Previous investigation of the outcomes suggests that it may suffer from a ceiling effect and, as the word list is based on words which are recognisable by pupils in US 3rd Grade (Wales Y4) and below, there is a limit to the usefulness of these given that it does not take account of the vocabulary that could be expected of 15 year old pupils (the PISA target population). This is supported by the fact that the SpacheRevised readability measure consistently produces reading ages lower than the other readability tests.
2.2 Limitations of readability analyses
It is important to note that:
1. The readability tests have all been designed for different purposes (for example, the New Fog Count is adapted from a test created for the US Navy to analyse their technical documents and manuals). Of the five tests, the New Dale-Chall and Spache Revised were both designed with primary aged children in mind. The New Dale-Chall is more accurate for children at the older end of the primary school range, whilst the Spache Revised is better suited to younger children (US 3rd Grade / Wales Y4) and below.
2. Many of the tests used take into consideration ‘unfamiliar’ words when they calculate the readability scores. This does not take into account the fact that these words may be explained as part of the text, either in text or through the use of a glossary.
3. Readability analysis does not take into account the design of the text, but rather it assumes plain text with no illustrations, diagrams etc. However, many of the PISA texts include illustrations, diagrams, tables etc.
3
Results of readability tests
Initial findings indicated that readability scores of the Spache Revised were
significantly lower than those of the other tests. As this was artificially depressing the mean grade level and reading level scores, and considering the concerns raised about the test in section 2.1.5, the decision was taken to remove the Spache Revised scores from the analysis.
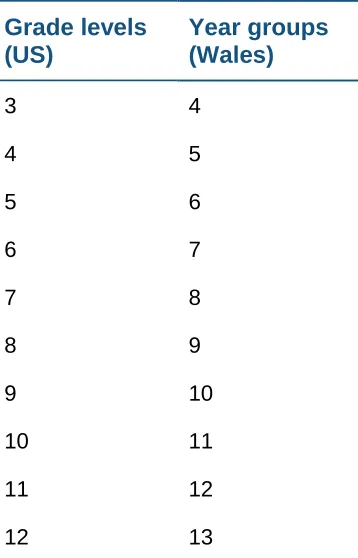
The grade levels and reading ages for each stimulus, as computed by the Flesch-Kincaid, New Dale-Chall, New Fog Count, and SMOG tests, are reported in Tables 3 to 9. Also shown in these tables is the mean grade level and reading age and the word count for each question stimulus. Grade levels given are in years and months. These are US levels so results should be read in conjunction with the conversion information in Table 2 below. As noted above, the mathematics stimuli were
[image:10.595.94.273.362.641.2]analysed in clusters as many of the individual question stimuli contained 30 words or less.
Table 2 Conversion table for US grade levels and Welsh year groups
Grade levels
(US)
Year groups
(Wales)
3 4
4 5
5 6
6 7
7 8
8 9
9 10
10 11
11 12
3.1 Mathematics Stimuli
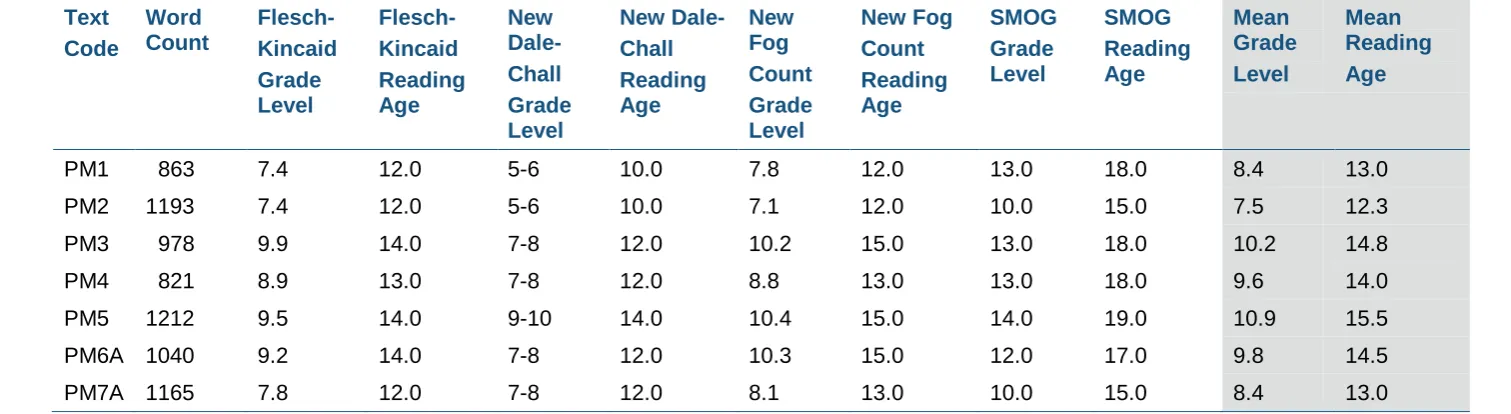
Table 3 Readability analysis scores of PM1, 2, 3, 4, 5, 6A, 7A mathematics stimuli*
Text Code Word Count Flesch- Kincaid Grade Level Flesch- Kincaid Reading Age New Dale- Chall Grade Level New Dale- Chall Reading Age New Fog Count Grade Level New Fog Count Reading Age SMOG Grade Level SMOG Reading Age Mean Grade Level Mean Reading Age
PM1 863 7.4 12.0 5-6 10.0 7.8 12.0 13.0 18.0 8.4 13.0
PM2 1193 7.4 12.0 5-6 10.0 7.1 12.0 10.0 15.0 7.5 12.3
PM3 978 9.9 14.0 7-8 12.0 10.2 15.0 13.0 18.0 10.2 14.8
PM4 821 8.9 13.0 7-8 12.0 8.8 13.0 13.0 18.0 9.6 14.0
PM5 1212 9.5 14.0 9-10 14.0 10.4 15.0 14.0 19.0 10.9 15.5
PM6A 1040 9.2 14.0 7-8 12.0 10.3 15.0 12.0 17.0 9.8 14.5
PM7A 1165 7.8 12.0 7-8 12.0 8.1 13.0 10.0 15.0 8.4 13.0
*Mathematics stimuli has been analysed as whole clusters rather than individual items.
3.2
Science stimuli
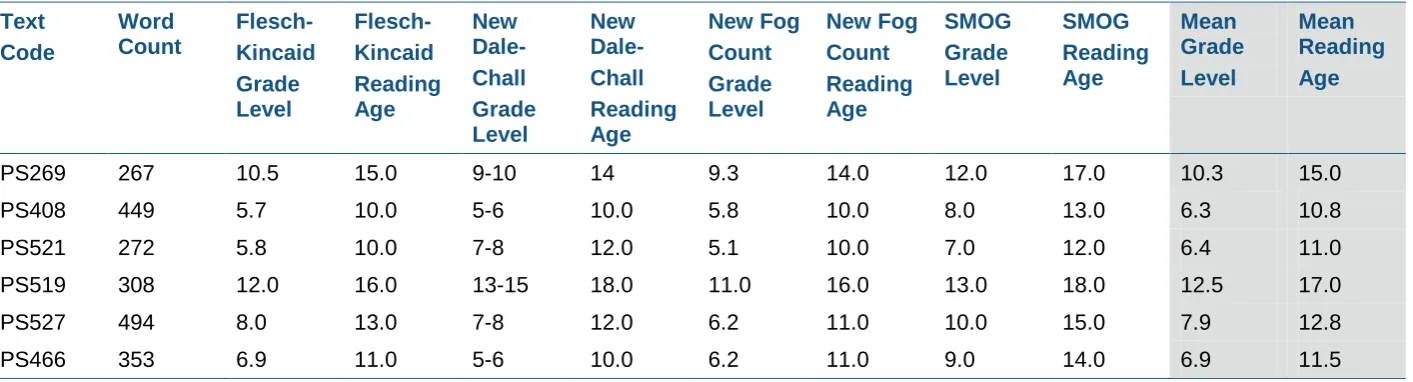
Table 4 Readability analysis scores of PS1 science stimuli
Text Code Word Count Flesch- Kincaid Grade Level Flesch- Kincaid Reading Age New Dale- Chall Grade Level New Dale- Chall Reading Age New Fog Count Grade Level New Fog Count Reading Age SMOG Grade Level SMOG Reading Age Mean Grade Level Mean Reading Age
PS269 267 10.5 15.0 9-10 14 9.3 14.0 12.0 17.0 10.3 15.0
PS408 449 5.7 10.0 5-6 10.0 5.8 10.0 8.0 13.0 6.3 10.8
PS521 272 5.8 10.0 7-8 12.0 5.1 10.0 7.0 12.0 6.4 11.0
PS519 308 12.0 16.0 13-15 18.0 11.0 16.0 13.0 18.0 12.5 17.0
PS527 494 8.0 13.0 7-8 12.0 6.2 11.0 10.0 15.0 7.9 12.8
PS466 353 6.9 11.0 5-6 10.0 6.2 11.0 9.0 14.0 6.9 11.5
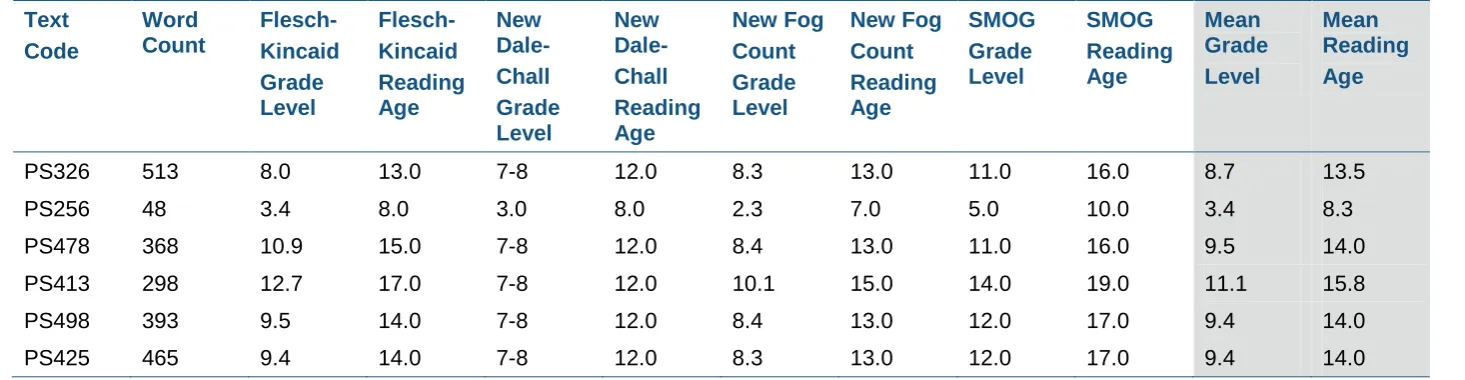
Table 5 Readability analysis scores of PS2 science stimuli
Text Code Word Count Flesch- Kincaid Grade Level Flesch- Kincaid Reading Age New Dale- Chall Grade Level New Dale- Chall Reading Age New Fog Count Grade Level New Fog Count Reading Age SMOG Grade Level SMOG Reading Age Mean Grade Level Mean Reading AgePS326 513 8.0 13.0 7-8 12.0 8.3 13.0 11.0 16.0 8.7 13.5
PS256 48 3.4 8.0 3.0 8.0 2.3 7.0 5.0 10.0 3.4 8.3
PS478 368 10.9 15.0 7-8 12.0 8.4 13.0 11.0 16.0 9.5 14.0
PS413 298 12.7 17.0 7-8 12.0 10.1 15.0 14.0 19.0 11.1 15.8
PS498 393 9.5 14.0 7-8 12.0 8.4 13.0 12.0 17.0 9.4 14.0
PS425 465 9.4 14.0 7-8 12.0 8.3 13.0 12.0 17.0 9.4 14.0
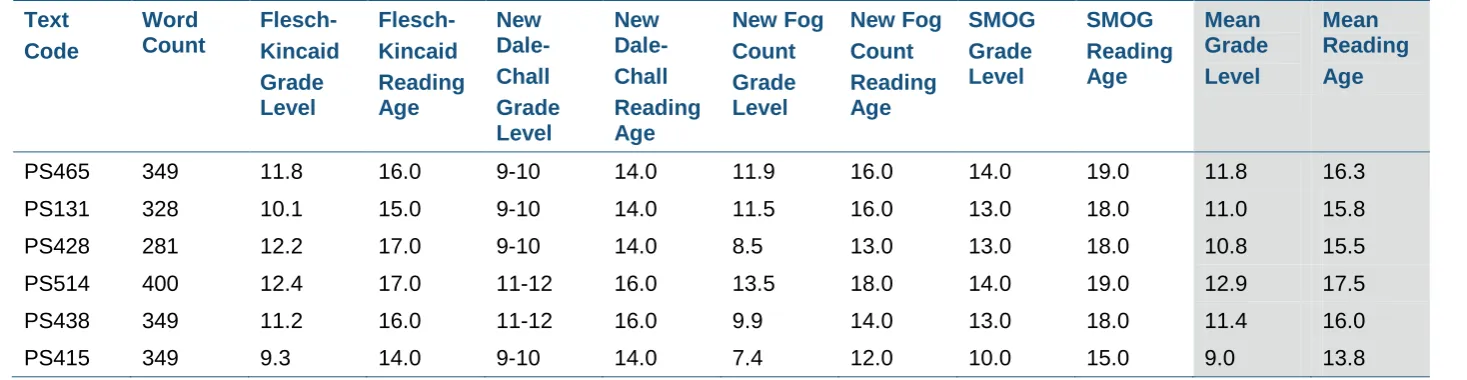
Table 6 Readability analysis scores of PS3 science stimuli
Text Code Word Count Flesch- Kincaid Grade Level Flesch- Kincaid Reading Age New Dale- Chall Grade Level New Dale- Chall Reading Age New Fog Count Grade Level New Fog Count Reading Age SMOG Grade Level SMOG Reading Age Mean Grade Level Mean Reading AgePS465 349 11.8 16.0 9-10 14.0 11.9 16.0 14.0 19.0 11.8 16.3
PS131 328 10.1 15.0 9-10 14.0 11.5 16.0 13.0 18.0 11.0 15.8
PS428 281 12.2 17.0 9-10 14.0 8.5 13.0 13.0 18.0 10.8 15.5
PS514 400 12.4 17.0 11-12 16.0 13.5 18.0 14.0 19.0 12.9 17.5
PS438 349 11.2 16.0 11-12 16.0 9.9 14.0 13.0 18.0 11.4 16.0
PS415 349 9.3 14.0 9-10 14.0 7.4 12.0 10.0 15.0 9.0 13.8
3.3 Reading stimuli
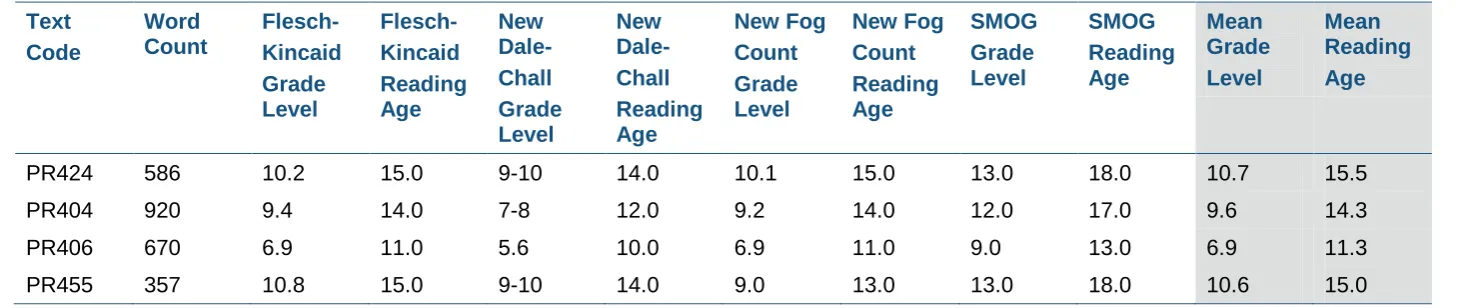
Table 7 Readability analysis scores of PR1 reading stimuli
Text Code Word Count Flesch- Kincaid Grade Level Flesch- Kincaid Reading Age New Dale- Chall Grade Level New Dale- Chall Reading Age New Fog Count Grade Level New Fog Count Reading Age SMOG Grade Level SMOG Reading Age Mean Grade Level Mean Reading Age
PR424 586 10.2 15.0 9-10 14.0 10.1 15.0 13.0 18.0 10.7 15.5
PR404 920 9.4 14.0 7-8 12.0 9.2 14.0 12.0 17.0 9.6 14.3
PR406 670 6.9 11.0 5.6 10.0 6.9 11.0 9.0 13.0 6.9 11.3
PR455 357 10.8 15.0 9-10 14.0 9.0 13.0 13.0 18.0 10.6 15.0
Table 8 Readability analysis scores of PR2 reading stimuli
Text Code Word Count Flesch- Kincaid Grade Level Flesch- Kincaid Reading Age New Dale- Chall Grade Level New Dale- Chall Reading Age New Fog Count Grade Level New Fog Count Reading Age SMOG Grade Level SMOG Reading Age Mean Grade Level Mean Reading AgePR420 367 11.4 16.0 7-8 12.0 11.9 16.0 11.0 16.0 10.5 15.0
PR453 628 7.6 12.0 5-6 10.0 6.8 11.0 10.0 15.0 7.5 12.0
PR412 608 9.6 14.0 7-8 12.0 6.4 11.0 12.0 17.0 8.9 13.5
PR437 431 7.2 12.0 4.0 9.0 6.0 11.0 10.0 15.0 6.8 11.8
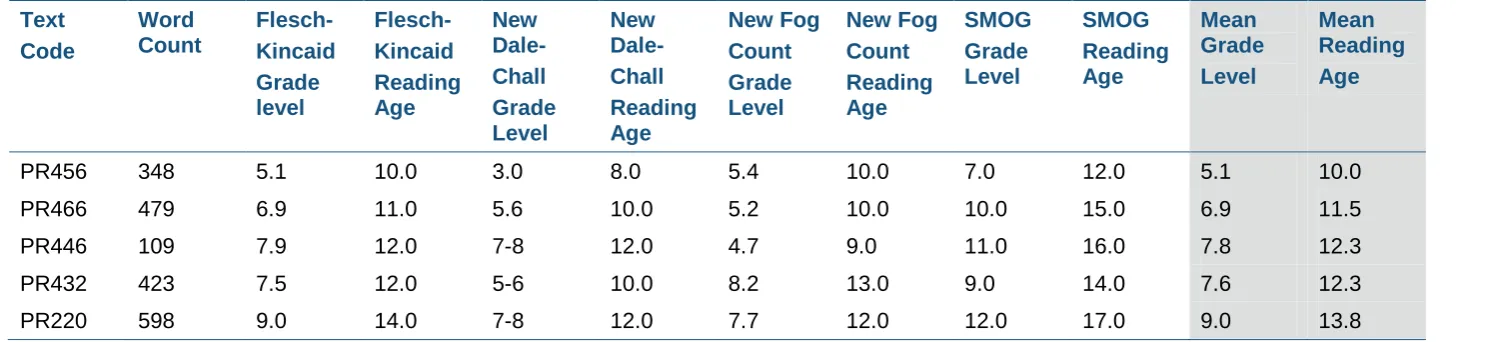
Table 9 Readability analysis scores of PR3 reading stimuli
Text Code Word Count Flesch- Kincaid Grade level Flesch- Kincaid Reading Age New Dale- Chall Grade Level New Dale- Chall Reading Age New Fog Count Grade Level New Fog Count Reading Age SMOG Grade Level SMOG Reading Age Mean Grade Level Mean Reading AgePR456 348 5.1 10.0 3.0 8.0 5.4 10.0 7.0 12.0 5.1 10.0
PR466 479 6.9 11.0 5.6 10.0 5.2 10.0 10.0 15.0 6.9 11.5
PR446 109 7.9 12.0 7-8 12.0 4.7 9.0 11.0 16.0 7.8 12.3
PR432 423 7.5 12.0 5-6 10.0 8.2 13.0 9.0 14.0 7.6 12.3
PR220 598 9.0 14.0 7-8 12.0 7.7 12.0 12.0 17.0 9.0 13.8
4
Conclusions and recommendations
This report presents an analysis of the PISA 2012 mathematics, science and reading assessment stimuli using four different readability tests. The findings are considered separately for each domain.
4.1
Mathematics
The mathematics stimuli was analysed as complete clusters because most of the individual stimuli contained less than 30 words. The results of this analysis using the Flesch-Kincaid, New Dale-Chall, New Fog and SMOG readability tests showed that the mean reading age required to access the PISA mathematics stimuli ranges from 12.3 to 15.5 years. The New Dale-Chall test, thought to be the most suitable test for this data, calculates the mean reading age required to be between 10 and 14 years. We would conclude from this analysis, therefore, that the readability of the PISA 2012 mathematics tests is at an appropriate level for the 15 year olds sitting them.
4.2
Science
4.2.1
Science cluster PS1
For the PS1 science stimuli, results of this analysis using all four readability tests showed that the mean reading age required to access the PISA science stimuli ranges from 10.8 years to 17 years. The New Dale-Chall test calculates the mean reading age required to be between 10 and 18 years. On closer examination, item PS519 was the only stimulus requiring a reading age of over 15 years. We would recommend, therefore, that this is taken into consideration when interpreting scores for this question.
4.2.2
Science cluster PS2
The results of the analysis for PS2 using all four readability tests show that the mean reading age required to access the PISA science stimuli ranges from 8.3 to 15.8 years. The New Dale-Chall test calculates the mean reading age required to be between 8 and 12 years. This is a large range of scores and, whilst the readability level is accessible for those taking the test, some items are clearly much easier to read than others, in particular item PS256.
4.2.3
Science cluster PS3
4.3
Reading
4.3.1
Reading cluster PR1
For PR1, the results of this analysis using the four readability tests show that the mean reading age required to access the PISA reading stimuli ranges from 11.3 to 15.5 years. The New Dale-Chall test calculates the mean reading age required to be between 10 and 14 years. We would conclude from this analysis, therefore, that the readability level of the PR1 PISA 2012 reading tests is at an appropriate level for the 15 year olds who are sitting them
4.3.2
Reading cluster PR2
For PR2, the results of this analysis using the four readability tests show that the mean reading age required to access the PISA reading stimuli ranges from 11.8 to 15 years. The New Dale-Chall test calculates the mean reading age required to be between 9 and 12 years. Again, we would conclude from this that the readability of the PR2 PISA 2012 reading tests is at an appropriate level for the 15 year olds who are sitting them
4.3.3
Reading cluster PR3
The results of this analysis using the four readability tests show that the mean reading age required to access the PISA reading stimuli ranges from 10 to 13.8 years. The New Dale-Chall test calculates the mean reading age required to be between 8 years and 12 years. Although the readability level is accessible for those sitting the tests, some items are clearly much easier to read than others, in particular item PR456.
4.4
Summary
However, results should be interpreted with caution as some readability tests are more suitable for analysing this type of data than others and consideration should also be given to the limitations of the readability analysis. It must also be
References
Dale, E. and Chall, J.S. (1995). Readability Revisited: the New Dale-Chall Readability Formula. Northampton, MA: Brookline Books.
Kincaid, J.P., Fishburne, R.P., Rogers, R.L. and Chissom, B.S. (1975). Derivation of New Readability Formulas (Automated Readability Index, Fog Count and Flesch Reading Ease Formula) for Navy Enlisted Personnel (Research Branch Report 8-75). Memphis, TN: Naval Air Station [online]. Available:
McLaughlin, H. (1969). ‘SMOG grading - a new readability formula’, Journal of Reading, 22, 639–646.
Spache, G. (1953). ‘A new readability formula for primary-grade reading materials’,The Elementary School Journal, 55, 410–413.