International Journal of Innovative Technology and Exploring Engineering (IJITEE) ISSN: 2278-3075,Volume-8, Issue-12, October 2019
Abstract: Most of the online applications such as Amazon, Snap deal, Flip cart and many others, attract customers by presenting user reviews about the services. These services typically include hotels, flights, cabs, holiday plans and many more. The main objective of this paper is to automatically analyze the feedbacks data given by the customers into positive, negative and neutral categories and gives a summarized review in case of multiple sentences is present in the feedback. In this proposed work various sources of data; namely from Flip cart, Snap deal is considered. The method to analyze the data include collecting the data from the mobile/web application sources, filtering the unwanted data, preprocessing and finally analyzing and summarizing the reviews using supervised machine learning techniques.
Keywords: Machine Learning Techniques, Naive Bayesian Semantic analysis, Support vector machines Algorithm, Big data.
I. INTRODUCTION
Today, the role of social media applications is very crucial in every field; whether in business or any other area. The success of a business is determined through customer satisfaction. At present, almost all services are digitized, and people prefer to use their smart phones or web for searching the best service in the area of his/her interest. To determine the quality of the service, customer feedback has become crucial. The feedbacks given by customers or critics are in the form of text that expresses their feelings about the service. The text feedback provided by the user or a critic is in unprocessed or unstructured format and it is in the language they use. The current work focuses on the semantic analysis of the feedback obtained for location-based services. The review data is collected from location service provider. The analysis of the feedback is done using machine learning techniques. The major proposal behind this work is to automate the feedback analysis. Most of the times, customers must manually read the reviews and then decide which service to choose depending on the positivity of the previous reviews. This proposed work considers the multiple sentences and finally concludes with the service name and its final opinion in terms of rating.
Revised Manuscript Received on October 05, 2019.
Pradeep S, Research Scholar, Department of Computer Science & Engineering, M S Ramaiah Institute of Technology, Bangalore, India. Email: [email protected]
Jagadish S. Kalmani, Department of Computer Science & Engineering, M S Ramaiah Institute of Technology, Bangalore, India. Email:
There are many challenges in automatically analyzing the feedback. They include the language, the way of framing the sentences, identifying the nature of service and much more. This work focuses on two techniques to semantically analyze the content of a sentence. The first approach is rule based and the second approach is using machine learning techniques. In the machine learning technique, the predefined rules are not considered but the prediction of the destination class of opinion of the reviews is determined using probability-based approach. The supervised machine learning algorithms considered in this paper include Bayesian Classifier and Support Vector Machines. These two techniques are called supervised machine learning a technique because they need to be trained before a random variable (random sentence in our case) is classified using these techniques. Machine learning approaches are compared to other approaches to show how accurately the predictions are done.
II. LITERATURESURVEY
To analyze the social data set a new method was introduced. It contains a framework for processing social data and a conceptual model to represent a social data. Is also have a framework to combine both social and organizational data set [1].
A discrete wavelet transforms (DWT) can be used to classify the data. A new method on DWT base was introduced to classify medical data. This approach is applied on medical data to identify the abnormal situations. This approach analyses ECG of different patient to detect epileptic seizures [2][3].
In the recent years Bigdata Analysis based on Machine learning Technique has been introduced by some of the researchers. In different context, different techniques specific to the context has been used [4][5][6][7]. Several approaches have focused on deep learning and observed several unstructured, noisy, streaming and poor quality [4][8]. The three main characteristics of analysis algorithm is scalability, flexibility and understandability of data. A new method was introduced with the concept of scalability, flexibility and understandability. In this approach algorithm must understand the data before it could apply on it [6]. Several difficulties were faced with different analysis algorithms. Challenges related to big data analysis has been identified and discussed on by some of the researchers [9]. The most common classifier such as Naive Bayes classifier is used to analyze the DOTA2 data set. It can analyze the lineup and predict on same basis. This
Big Data Analysis Based on Machine Learning
Techniques
Same classifier is used for the analysis of music emotions. In this approach, music data will be preprocessed and classified to different categories.[11].
An together Random Forest process is applied for Insurance Big Data Analysis. The algorithm based on parallel computing ability and memory-based mechanism has been introduced called Random Forest algorithm. This algorithm is applied to analyses the business data belonging to insurance. The challenges of analyzing huge volume of data also discussed along with the result [12].
A novel approach to classify the data based on algebraic topology and called as Topological algorithm to analyze data in connection with MRI functions [13]. Another strong method has been introduced to work on surveillance systems called Background Subtraction Technique [14][15]. A new form of classifier to determine the conceptual architecture of big data have introduced to work on different domain dataset related to healthcare such as electronic record of patient, genome database.[16][17].
Another method has been introduced to classify the recommendation of product. This model is based on both product information as well as user features and collective filtering is used in this model. This model is equivalent to matrix factorization models [18].
III. METHODOLOGY
The semantic analysis feedback is carried out using Supervised Machine Learning techniques. Following section discusses the details of Semantic Analysis using Supervised Machine Learning technique.
A. Machine learning approach
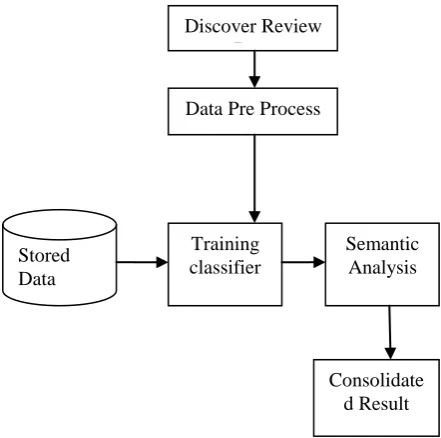
[image:2.595.308.529.55.274.2]The machine learning approach used in this work is supervised. The two models used for classification are Bayesian Classifier and the Support Vector Machine (SVM). In the supervised machine learning approach, a set of predefined reviews are analyzed and are used to train the classification model. The process of analyzing the reviews using supervised machine learning techniques is shown in Figure 1. Initially, a set of reviews with multiple sentences are stored offline for training the classifier models. The classifier models used in this implementation work are Bayesian and Support Vector Machines (SVM). Once the models are successfully trained, the random reviews are collected from web applications or mobile applications and classified according to the predefined classes. The steps include collecting random reviews, sentence extraction, Preprocessing, Semantic analysis and finally generating consolidated reviews. The steps: collecting the random reviews, sentence extraction, and preprocessing.
Fig 1. Model of Machine Learning B.` Discover Reviews
In
the first step, the reviews were collected from mobile service applications or from web based applications. Most of the reviews had multiple sentences. All the reviews were collected and stored for further processing. In this implementation work, the reviews were collected from the Amazon service application and Snap deal social media. The reviews were collected by extracting the HTML contents from the web application. This extraction was implemented using JSOUP library in Java. The unwanted content was removed from the extracted content and only the reviews content was stored for a specific location-based service as in hotel service. The Twitter data was collected by first registering to the Twitter application and then specifying the topic of interest. The Twitter data is normally in the JSON format. This format was analyzed and only the review content was stored and rest of the unwanted content was kept a side. At the end of Step 1, the review sentences by each customer are available and were stored in the local machine for further processing.C. Preprocessing
In
preprocessing each review was processed. The reviews had multiple sentences. Each sentence was extracted by considering sentence delimiters. The delimiters considered in this implementation work were„.‟ and „;‟. It repeats for each and every review sentence. Once the Parts of Speech tagging process were completed, the tagged sentence was tokenized. The conditions checked for tokenizing a sentence included white space(s), punctuation marks and delimiters. The tokens having the POS tags as Articles (the, a, an), Prepositions (at, for, except, in, of, on, to, up, with), Conjunctions (and, or, but), Pronouns (I, me, she, her, he, him, we, it, you, they, them) were removed and were not considered in the further stages of analysis. The white spaces, punctuations were also removed. In this implementation, only the tokens with tags of noun, verb, adverb and adjectives were retained for the next stages of analysis process.Discover Review Data
Data Pre Process
Stored Data
Training classifier
Semantic Analysis
International Journal of Innovative Technology and Exploring Engineering (IJITEE) ISSN: 2278-3075,Volume-8, Issue-12, October 2019
D. Stored Data
Data group of 500 reviews sentences were downloaded offline for training model. These review sentences were used to train the classifier models. The stored review sentences consist of almost 6 words which includes noun, verb adverb and adjectives the sequence of these words was analyzed for 500 review sentences which we considered.
E. Training the classifier
As discussed in the previous section, 6 words called tokens is considered in this implementation work after the preprocessing. Training with different category of reviews with different combination of tokens are given below. Category-1: {Noun, Noun, Extreme, Very, Clean, Gorgeous} Category-1: {Noun, Verb, Really, Very, Good, Excellent} Category-2: {Noun, Noun, Actually, Very, Nice, Kind} Category-2: {Noun, Noun, Actually, Very, Fine, Class} Category-3: {Noun, Noun, Regularly, ok, Nice, Kind} Category-3: {Noun, Verb, Regularly, Satisfactory, Nice, Manner}
Category-4: {Noun, Noun, Especially, Satisfactory, Lazy, Scary}
Category-4: {Noun, Noun, Pollute, Mainly, Idle, Terrific} Category-5: {Verb, Noun, Usually, Dusty, Damage, Poor} Category-5: {Verb, Noun, Usually, Dusty, Damage, Pitiable} Category-6: {Verb, Noun, Usually, Dusty, Damage, Pitiable} Category-6: {Noun, Noun, Bad, Dusty, Nothing, Waste} There are 6 predefined categories named category-1, category-2…category-6. A consecutive nouns/verbs, consecutive adverbs and consecutive adjectives are considered for categorizing data. This is done by analyzing the offline stored reviews. Above shown combination of these are used as training set for the classifier model. In the implementation work, the table is constructed for all the 500 review sentences.
F. Naive Bayesian Semantic analysis Algorithm
In this process, the Naïve Bayesian and Support Vector Machine classifier is applied on data.
Let D be a training set for m-categories with attribute vector Y and associated class labels. The attribute Y belongs to the class with highest posterior probability and is given by
Where,
P( ) = Class Prior Probability P(Y) = Probability of Y P ( |Y) = Posterior Probability
P (Y| ) = Class Conditional Probability
Based on the token exists in each review sentence, prior probability is calculated for each category. Category with maximum probability will be considered. It continues for all the considered data and determines its category. The training and calculating the posterior probabilities is carried out using the R tool.
Let „m’ be the number of categories,‘n’ be the number of review
Algorithm-1: Naive Bayesian Semantic analysis Algorithm
For each preprocessed review sentence ‘j’ 1 to n For’ i‘1 to m
Compute Posterior Probability Pi ( |Y) for each category Ci as
per equation (1). For’ i‘1 to m
Compute Max (Pi ( |Y))
If ((Pi ( |Y)) ==Max (Pi ( |Y))
Preprocessed review sentence
If(j<n) Continue Else stop
The preprocessed data is input for the Naive Bayesian Semantic analysis Classifier. This classifier is trained with the training set of data for different categories as discussed in section 3.1.4. According to proposed algorithm, for each preprocessed review sentence, Posterior Probability for each category has to be determined and find the maximum Posterior Probability among the categories. This proposed algorithm assigns review sentence toa category which is having maximum Posterior Probability.
G. Support Vector Machines (SVM) Algorithm
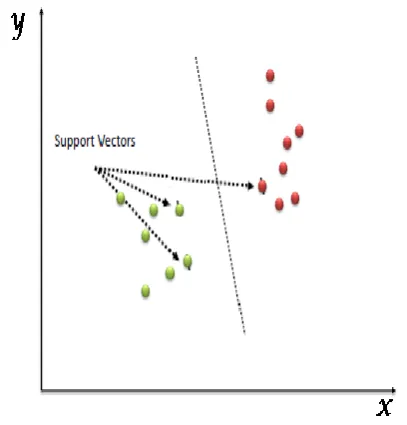
A Support vector machines (SVM) is an supervised machine learning classification algorithm. This algorithm defines the boundary between different categories of data. In this algorithm the review sentences has to be converted to vector list of integers, where integers represents the features of review about the product such as very bad , bad, average , ok, good , Excellent.
[image:3.595.324.528.432.645.2]In this algorithm we consider n dimensional space, where n represents the number of features considered and the value of feature is considered as the set of coordinates on space. A hyper plane on space categorizes the data into different categories. General SVM classification is shown in Fig. 2.
Fig 2. Representation of SVM classification
In SVM The hyperplane which defines the decision boundary is given by
Yi= a*x+b (2)
Algorithm-2: Support vector machinesAlgorithm
Let‟ n‟ be the number of integer list of vector represents indusial review then
For each integer of vector list ‘j’ 1 to n Compute Yi as per equation (2).
If (Yi Ɛ H1) C1 ←Yi Else if (Yi Ɛ H2) C2 ←Yi Else if (Yi Ɛ H3) C3 ←Yi Else if (Yi Ɛ H4) C4 ←Yi Else if (Yi Ɛ H5) C5 ←Yi Else C6←Yi
If(j<n) Continue Else stop
The vector list generated from preprocessed data is input for the algorithm. Based on training dataset the hyper planes determined using equation (2). The trained model finds the perfect hyper plane for given set of data and categorizes based on its position on the space.
IV. ACCURACYPARAMETERS
Accuracy parameters such as precision, recall and F1-score [19] are analyzed to measure the performance of the algorithm.
A. Precision
A precision is the ratio of a number of correct review sentences assigned to a category called true positive to the number of all assigned sentences (Collection of both correct and wrong sentences). Mathematically, precision can be represented as
Precision=TruePositive/(TruePositive+FalsePositive) (3)
Where
True Positive =A number of reviews correctly classified False Positive = A number of reviews assigned to a category even though it is not belonging.
Total reviews assigned to category= True Positive+ False Positive
B. Recall
Recall is the ratio of a number of correct reviews to a number of all reviews assigned to a category.
Recall=TruePositive/(TruePositive+FalseNegative) (4)
Where
False Negative= the number of reviews belonging to category is assigned to wrong categories.
C. The F1-Score
The F1-score is the harmonic mean of Precision and Recall. Mathematically, the F-score could be determined as
F1-score=(2*precision*recall)/(precision+recall) (5)
These parameters are evaluated for the classifier for the dataset considered from Amazon and analyzed the strength of classifier.
V. RESULTANDDISCUSSIONS
Before Input to proposed classifier is the review data collected from amazon.in. The result of the classifier is analyzed based on accuracy parameters.
A. Dataset
Data is collected from popular Indian e-commerce websites, namely, Amazon.in. http://jmcauley.ucsd.edu/data/amazon. A sample of review data is shown below
{
"reviewerID": "A2SUAM1J3GNN3B", "asin": "0000013714",
"reviewerName": "J. McDonald",
"Review Text": "I bought this for my husband who plays the piano. He is having a wonderful time playing these old hymns, Great purchase though!",
"overall": 5.0,
"summary": "Heavenly Highway Hymns", "unixReviewTime": 1252800000, "reviewTime": "09 13, 2009" }
B. Results of Naive Bayesi Semantic analysis Algorithm There are 3 set of data with different volume has been considered for testing. Set-1 consists of 600 sentences with equal number of sentences belonging to each category. Similarly set-2 consists of 1200 review sentence and set-3 consists of 1800 review sentences are considered as input to proposed classifier. Result of classifier with respect to Set-1, Set-2 and Set-3 are given in Table-1, Table-2 and Table-3 respectively. The factors true positive, true negative, false positive and false negative are discussed in section 4.
Table 1. Classification Result of category for the input data Set-1.
Categor y
Assigned Sentence
s
True Positive
False Positiv
e
False negative
1 95 78 17 22
2 98 70 28 30
3 109 82 27 18
4 89 73 16 27
5 114 85 29 15
International Journal of Innovative Technology and Exploring Engineering (IJITEE) ISSN: 2278-3075,Volume-8, Issue-12, October 2019
Table 2. Classification Result of category for the input data Set-2.
Category Assigned Sentences
True Positive
False Positive
False negative
1 275 252 23 38
2 321 278 43 22
3 294 249 45 51
4 275 230 45 70
5 330 300 30 0
6 305 288 17 12
Table 3. Classification Result of category for input data Set-3.
Category Assigned Sentences
True Positive
False Positive
False negative
1 282 240 42 60
2 266 251 15 49
3 303 268 35 32
4 258 244 14 56
5 323 289 34 11
6 278 242 36 58
[image:5.595.311.560.387.681.2]C. Results of Support Vector Machines Algorithm The three different data i.e., set-1, set-2, and set-3 considered for naïve bayes algorithm is used with SVM algorithm to find the efficiency of algorithm. The result is given in Table 4, Table 5 and Table 6 respectively.
Table 4. Classification Result of category for input data Set-1.
Category Assigned Sentences
True Positive
False Positive
False negative
1 90 76 14 24
2 88 70 18 30
3 92 80 12 20
4 103 88 15 12
5 90 68 22 32
6 110 92 18 8
Table 5. Classification Result of category for input data Set-2.
Table 6. Classification Result of category for input data Set-3.
Category Assigned Sentences
True Positive
False Positive
False negative
1 194 162 32 38
2 227 170 57 30
3 186 155 31 45
4 221 166 55 34
5 190 162 28 38
6 182 157 25 43
D. Result Analysis of Naive Bayesi Semantic analysis Algorithm
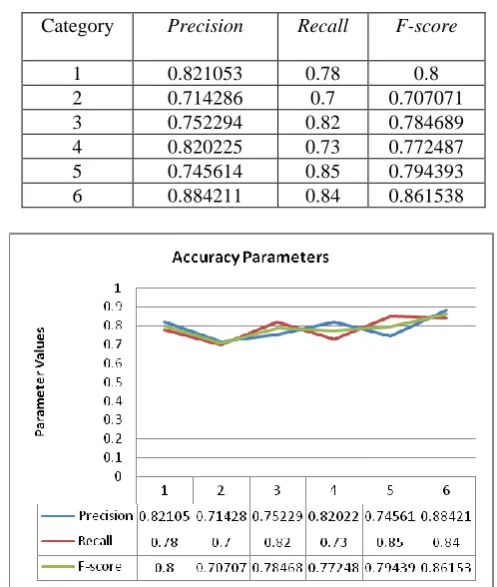
Accuracy parameters discussed in section 4 is determined to analyze the strength of classifier with different data set. Precision value for the classifier has been calculated based on equation (3). Similarly recall and F-score are calculated based on equation (4) and (5) respectively. The result of these parameters for each category with reference to input data Set-1 is shown in Table 7 and its corresponding graph is shown in Figure 3. Table 8 and Figure 4 shows the result for the input data Set-2. Similarly Table 9 and Figure 5 show the result for the input data Set-3.
Table 7. Accuracy Parameter values of naïve bayes classifier for input data Set-1.
Fig 3. Accuracy parameters of naïve baysclassifier for input data Set-1.
Category Assigned Sentences
True Positive
False Positive
False negative
1 180 151 18 49
2 167 155 12 45
3 205 180 25 20
4 174 160 14 40
5 205 192 13 08
6 177 148 29 52
Category Precision Recall F-score
1 0.821053 0.78 0.8
2 0.714286 0.7 0.707071
3 0.752294 0.82 0.784689
4 0.820225 0.73 0.772487
5 0.745614 0.85 0.794393
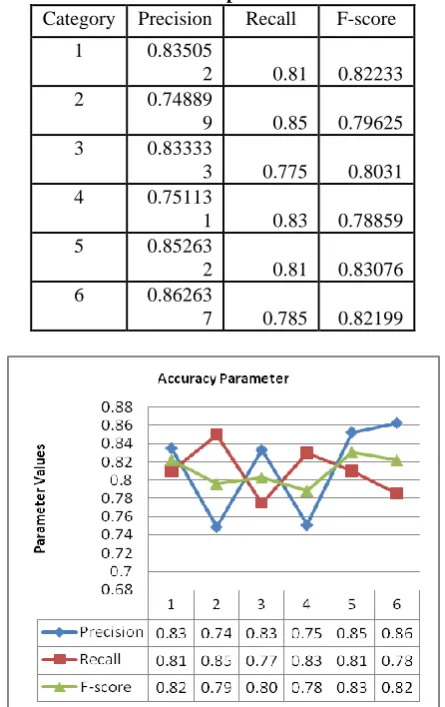
[image:5.595.43.287.461.739.2]Table 8. Accuracy Parameter values of naïve bays classifier for input data Set-2.
Category Precision Recall F-score
1 0.83505
2 0.81 0.82233
2 0.74889
9 0.85 0.79625
3 0.83333
3 0.775 0.8031
4 0.75113
1 0.83 0.78859
5 0.85263
2 0.81 0.83076
6 0.86263
7 0.785 0.82199
Fig 4. Accuracy parameters of naïve bays classifier for input data Set-2.
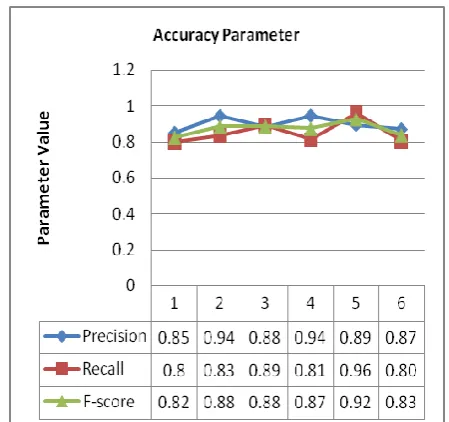
Table 9. Accuracy Parameter values of naïve bays classifier for the input data Set-3.
Category Precision Recall F-score
1 0.91636
4 0.86896 0.89203
2 0.86604
4 0.92666 0.89533
3 0.84693
9 0.83 0.83838
4 0.83636
4 0.76666 0.8
5 0.90909
1 1 0.95238
6 0.94426
2 0.96 0.95206
Fig 5.Accuracy parameters of naïve bays classifier for input data Set-3.
[image:6.595.57.280.85.439.2]D. Result Analysis of Support Vector Machines algorithm The same accuracy parameters discussed in section 4 is used to analyze the strength of SVM classifier with different data set. Precision Recall and F-score has been determined on the basis of equation (3), equation (4) and (5) respectively. The result of these parameters for each category with reference to input data Set-1 is shown in Table 10 and its corresponding graph is shown in Figure 6. Table 11 and Figure 7 show the result for the input data Set-2. Similarly, Table 12 and Figure 8 show the result for the input data Set-3.
[image:6.595.311.557.419.719.2]Table 10. Accuracy Parameter values of SVM classifier for the input data Set-1.
Fig 6. Accuracy parameters of SVM classifier for input data Set-1.
Categor y
Precision Recall F-score
1 0.844444 0.76 0.8
2 0.795455 0.7 0.74468
3 0.869565 0.8 0.83333
4 0.854369 0.88 0.86699
5 0.755556 0.68 0.71579
International Journal of Innovative Technology and Exploring Engineering (IJITEE) ISSN: 2278-3075,Volume-8, Issue-12, October 2019
Table 11. Accuracy Parameter values of SVM classifier for the input data Set-2.
Category Precision Recall F-score
1 0.89349
1 0.755 0.81842
2 0.92814
4 0.775 0.84468
3 0.87804
9 0.9 0.88888
4 0.91954 0.8 0.85561
5 0.93658
5 0.96 0.94814
6 0.83615
8 0.74 0.78514
Fig 7. Accuracy parameters of SVM classifier for input data Set-2.
Table 12. Accuracy Parameter values of SVM classifier for the input data Set-3.
Category Precision Recall F-score
1 0.85106
4 0.8 0.82474
2 0.94360
9 0.8366 0.88692
3 0.88448
8 0.8933 0.88888
4 0.94573
6 0.8133 0.87455
5 0.89473
7 0.9633 0.92776
6 0.87050
4 0.8066 0.83737
Fig 8. Accuracy parameters of SVM classifier for input data Set-3.
E. Comparison of Naive Bayesi, SVM, Random Forest and Decision Tree algorithm
[image:7.595.64.283.83.469.2] [image:7.595.328.523.407.564.2]The average precision recall and F-score values of Naive Bayesi Semantic analysis Algorithm, SVM is compared with other classifier Random Forest and Decision Tree algorithm. Comparison is shown in Table 13.
Table 13. Comparison Result Precision Recall F-score Approaches
Naive Bayes 0.88 0.86
0.86
SVM 0.89 0.9 0.89
Random Forest
0.87 0.86
0.86 Decision
Tree
0.78 0.86
0.81
The result shows that the proposed classifier for review analysis is approximately equivalent to other standard classifiers Random Forest and Decision tree.
VI.CONCLUSION
Result analysis of Naive Bayes classifier and SVM shows that the accuracy is comparatively good as Random Forest and Decision Tree algorithm.
REFERENCES
1. Ravi Vatrapu, Raghava Rao Mukkamala, Abid Hussain, And Benjamin Flesch.” Social Set Analysis: A Set Theoretical Approach To Big Data Analytics”, Special Section On Theoretical Foundations For Big Data Applications: Challenges And Opportunities, Ieee Access, Vol 4, Pp. 2542-2571, 2016
2. A. Sharmila, (Member, Ieee), And P. Geethanjali, (Member, Ieee), “Dwt Based Detection Of Epileptic Seizure From Eeg Signals Using Naive Bayes And K-Nn Classifiers”, Ieee Access, Vol4, Pp. 7716-7727, 2016. 3. Alexandra L'heureux, Katarina Grolinger, Hany F. Elyamany And Miriam A. M. Capretz, “Machine Learning With Big Data: Challenges And Approaches”,Ieee Access, Vol 5, Pp. 7776-7797, 2017.
4. O.Y. Al-Jarrah, P. D. Yoo, S. Muhaidat, G. K. Karagiannidis, and K. Taha, ``Efficient machine learning for big data: A review,'' Big Data Res., vol. 2, no. 3, pp. 87-93, Sep. 2015.
5. M. M. Najafabadi, F. Villanustre, T. M. Khoshgoftaar, N. Seliya, R.Wald,and E. Muharemagic, ``Deep Learning Applications and Challenges in Big Data Analytics,'' J. Big Data, vol. 2, no. 1, 2015. 6. S. R. Sukumar, ``Machine learning in the big data era: Are we there
yet?'' in Proc. 20th ACM SIGKDD Conf. Knowl. Discovery Data Mining,Workshop Data Sci. Social Good (KDD), pp. 1-5,2014. 7. J. Qiu, Q.Wu, G. Ding,Y. Xu, and S. Feng, ``Asurvey of machine
learning for big data processing,'' EURASIP J. Adv. Signal Process., vol. 67, pp. 1-16, Dec. 2016.
8. C. Parker, ``Unexpected challenges in large scale machine learning,'' inProc. 1st Int. Workshop Big Data, Streams Heterogeneous Source MiningAlgorithms, Syst., Programm. Models Appl. (BigMine), pp. 1-6,2012.
9. X.-W. Chen and X. Lin, ``Big data deep learning: Challenges and perspectives,''IEEE Access, vol. 2, pp. 514-525, 2014.
10. Kaixiang Wang, Wenqian Shang, “Outcome Prediction Of Dota2 Based On Naïve Bayes Classifier”, Ieee,Pp. 591-596, Icis 2017.
11. Yunjing An, Shutao Sun, Shujuan Wang “Naive Bayes Classifiers For Music Emotion Classification Based On Lyrics”Ieee,Pp. 635-638, Icis 2017.
12. Weiwei Lin, Ziming Wu, Longxin Lin, Angzhan Wen AndJin Li.” An Ensemble Random Forest Algorithm For Insurance Big Data Analysis” Special Section On Recent Advances In Computational Intelligence Paradigms For Security And Privacy For Fog And Mobile Edge Computing, Ieee Access, Vol 5, Pp. 16568-16575, 2017.
13. AngkoonPhinyomark , Esther Ibanez-Marcelo , And Giovanni Petri . “Resting-State Fmri Functional Connectivity: Big Data Preprocessing Pipelines And Topological Data Analysis”. Ieee Transactions On Big Data, Vol. 3, No. 4, Pp. 415-4282017
14. Ling Hu, Qiang Ni, And Feng Yuan.” Big Data Mining And Analytics”Volume 1, Number 2, Pp137–145 , 2018.
15. Shahid Shayaa, Noor IsmawatiJaafar ,ShamshulBahri, AininSulaiman ,PhoongSeuk Wai , Yeong Wai Chung, Arsalan Zahid Piprani ,And Mohammed Ali Al-Garadi.” Sentiment Analysis Of Big Data: Methods, Applications, And Open Challenges”,Ieee, Volume 6,Pp. 37807-37827, 2018.
16. Sunil Kumar_ And Maninder Singh, “Big Data Analytics For Healthcare Industry:Impact, Applications, And Tools”, Big Data Mining And Analytics,Volume 2, Number 1, Lpp48–57, 201. 17. Jose Ramon Saura , Beatriz Rodríguez Herráez, And Ana
Reyes-Menendez, “Comparing A Traditional Approach For Financial Brand Communication Analysis With A Big Data Analytics Technique”, Special Section On Applications Of Big Data In Social Sciences, Ieee Access, Volume 7, Pp. 37100-37108, 2019.
18. Priscila Valdiviezo-Diaz , Fernando Ortega ,Eduardo Cobos, And Raúl Lara,” A Collaborative Filtering Approach Based On Naïve Bayes Classifier”, Ieee Access, Volume 7, 2019.
19. Davis, J. and Goadrich, “The relationship between Precision-Recall and ROC curves”. In Proceedings of the 23rd international conference on Machine learning. Pp. 233-240,. ACM, 2006
AUTHORSPROFILE
Pradeep.S received B.E in computer Science from Karnataka University, Dharwad in the year 2000 and M.Tech. in Software Engineering from Sri Jayachamarajendra College of Engineering, Mysore affiliated to Visvesvaraya Technological University India in 2007 and presently pursuing the Ph.D in BIG DATA from department of computer science, Ramaiah Institute of technology, Bengaluru, India. The area of interest is Big Data Analytics, Software Engineering, Design of Algotithms, Machine Learning, Cryptography and Image Processing.