IJEDR1602215
International Journal of Engineering Development and Research (www.ijedr.org)1213
Fatigue Analysis of Resistance Spot Welded Single
Lap Joint using FEM
1 Mr. Ganesh R. Shelke 2 Prof. P. N. Awachat, 1 M-Tech. Students, 2Assistant Professor
1Dept. of Mechanical Engineering
1G. H. Raisoni Academy of Engineering and Technology, Nagpur, India
________________________________________________________________________________________________________
Abstract - The aim of this study is to prediction fatigue life of structure, the stress states developed in the structure should be determined accurately. For this purpose, a commercial FEA software, ANSYS (version 15) is used. fatigue failure thus becomes the most critical failure mode for a structure itself or the region around it under fluctuating stresses. A designer should seek the ways of increasing fatigue strength of a joint to ensure the safety of the whole structure. Resistance spot welding is the most preferred method to join metal sheets. The design variables for spot-weld joints affecting their strengths are basically sheet thickness, spot weld nugget diameter, number of spot welds and the joint type as exemplified in tensile shear (TS) specimens. In order to accurately determine the stress , a nonlinear finite element analysis was carried out taking into account plastic deformations, residual stresses developed after unloading and contacting of spot welded surfaces.
Index Terms - fatigue life prediction; finite element analysis; Sheet thickness; spot weld.
________________________________________________________________________________________________________
I.INTRODUCTION
The project is expected to design and fatigue analysis of the resistance spot welded with lap joint using FEM. Fatigue strength of spot-welded joints affects the structural rigidity and durability of spot-welded structures and thus it is an important factor in determining safety and structural integrity. To determine design criteria for long fatigue life for spot welded structures, accurate stress analysis and systematic fatigue strength assessment are needed. Since it is very difficult to determine directly the fatigue design criteria for actual structures, it is a typical practice to assess fatigue strengths using mock-up specimens with structural and mechanical characteristics similar to the actual structures. Many investigators have numerically and experimentally assessed fatigue strength and provided considerable data on the fatigue strength of various spot welded joints. To apply the data into the fatigue design of actual spot welded thin sheet structures, welding residual stress should be properly considered since it affects fatigue crack initiation and propagation at the nugget edge of a spot weld. Nevertheless, there are very few fatigue strength assessments that consider welding residual stress because welding residual stress analysis is quite complicated.
A key feature of the modern durability design process is the use of computer-based finite element methods to predict durability at an early stage in the design cycle. This process is driven by the need for designs with low weight, low cost of manufacture, short development cycles and good durability. Calculations based on fatigue life and realistic loading histories permit structures and components to be optimised for durability without the need for the expensive and time-consuming testing of a series of prototypes. Design analysis based on fatigue life calculations results in designs that are less conservative (i.e. better optimised) than those based on traditional criteria such as maximum load or stress for a series of standard load cases.
For fatigue analyses, the stress categories are generally evaluated by using a nominal stress, a structural hot spot stress, and a notch stress with consideration of stress concentration effects. The choice of stress category depends on the method used to express the fatigue strength data in the fatigue assessment. Among these categories, nominal stress and notch stress can be considered as the mechanical parameters for fatigue strength assessment of a spot-welded joint.
© 2016 IJEDR | Volume 4, Issue 2 | ISSN: 2321-9939
IJEDR1602215
International Journal of Engineering Development and Research (www.ijedr.org)1214
Spot welding is a widely employed technique to join sheet metals for body and cap structure in the automotive industry. The strength of the spot welds in the unibody vehicle structure determines the integrity of the structural performance during the vehicle operations. Most spot welds generally carry only shear forces but spot welds can also experience a significant amount of peel force or the force normal to the spot weld in certain loading conditions. The combination of the stress states and geometric shapes of the spot welds lead to stress concentration that can result in fatigue crack initiation around the spot weld. Therefore, understanding of the fatigue strength for the spot welds is very important in automotive component design. .II. EXPERIMENT
Material
. In this study, fatigue failure tests were carried out on SSTS specimens made of stainless steel (AISI304CS). The average mechanical properties and the chemical composition of stainless steel (AISI304CS)are given in Tables 1 and 2, respectively. Materials of this type are widely used in automotive industry, especially to construct body frames Although they have lower fatigue strength, they are less sensitive to notches and surface imperfections. Also, they weld evenly and easily and hold paint well. A spot-welded joint is composed of a nugget and base metal. Because elastic modulus and Poisson’s ratio are not affected by heat treatment, their magnitudes remain the same throughout the specimen despite melting during the formation of the nugget. Although the non linear stress-strain relation of the material in and around the nugget was affected during the joining operation, this effect was neglected considering that the steel was not a hardened steel the hardness levels at these locations are close to each other, one may assume that there is no significant change in mechanic properties of the material during welding.
Table 1 Chemical compositions (wt %)
Material C CR Ni
AISI304CS 0.02 18 10
Table 2 Mechanical properties of specimen
Material Density
(Kg/m3)
Yield strength (Mpa)
Ultimate strength (Mpa)
Young’s modulus (Mpa)
Poissons Ratio
AISI304CS 8000 215 505 2E+5 0.29
Specimen preparation
Three Single spot tensile-shear specimen(SSTS) of 1.4, 2, and 3 mm thickness and AISI304CS steel sheet is used for these specimen. Geometries of tensile- shear specimen are shown in Fig 1. Nugget diameter is 6 mm for all three specimen. Combination of material and thickness are used in different automobile parts The specimen materials of spot welded lap joint in this paper consist of stainless steel (AISI304CS) sheet for tensile-shear specimen. These materials are typically used for the automobile and train body structure.
IJEDR1602215
International Journal of Engineering Development and Research (www.ijedr.org)1215
Fig. 1 Configuration of Single spot tensile-shear specimen(SSTS) (unit : mm)Following table shows the results of test perform on different spot welded specimen details of specimen also shows in the table
Table 3 Breaking Load of different spot welded specimen
Sr. No.
Types of specimen
Thickness
Breaking Load
mm
KN
1
Single spot welded
1.40
12.3
2
Double spot welded
1.40
11.6
3
Triple spot welded
1.40
18.3
4
Four spot welded
1.40
20.4
5
Double spot welded
2.00
11.8
Fig. 2 spot welded specimen before testing Fig. 3 spot welded specimen after testing
III. FINITE ELEMENT ANALYSIS
© 2016 IJEDR | Volume 4, Issue 2 | ISSN: 2321-9939
IJEDR1602215
International Journal of Engineering Development and Research (www.ijedr.org)1216
Many different types of mechanical systems are usually uses different methods for calculations of stresses. Finite element analysis using analytical method for such system is quite difficult, but it can be make convenient by changing general machine system such as an airplane engine, transmission system, a diesel engine drive or a boat etc, to an equivalent disc and shaft system. So for same purpose simplified method has been integrated and developed which are given in this project and that can be surely used to solve for stresses of system.For finding the shearing stresses in spot welded plate, we can use the ANSYS software. First upon we create the model in PRO-E software. ANSYS and PRO-PRO-E both are design software. In this we can find out lot of various result related with design phenomenon
boundary conditions
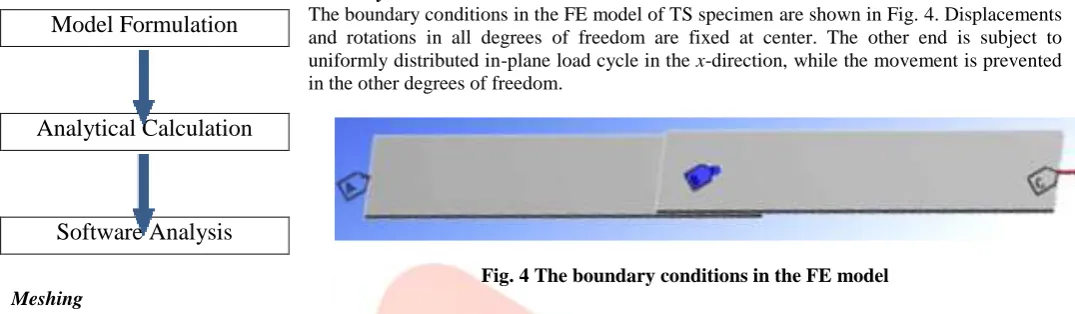
The boundary conditions in the FE model of TS specimen are shown in Fig. 4. Displacements and rotations in all degrees of freedom are fixed at center. The other end is subject to uniformly distributed in-plane load cycle in the x-direction, while the movement is prevented in the other degrees of freedom.
Fig. 4 The boundary conditions in the FE model
Meshing
ANSYS meshing technologies provide physics preferences that help to automate the meshing process. For an initial design, a mesh can often be generated in batch with an initial solution run to locate regions of interest. Further refinement can then be made to the mesh to improve the accuracy of the solution. There are physics preferences for structural, fluid, explicit and electromagnetic simulations. By setting physics preferences, the software adapts to more logical defaults in the meshing process for better solution accuracy.
After Meshing in ANSYS Software, find out Nodes and Element , Nodes : 37586, Element : 22356
Fig.5 Meshing in the FE model
resulting stress states
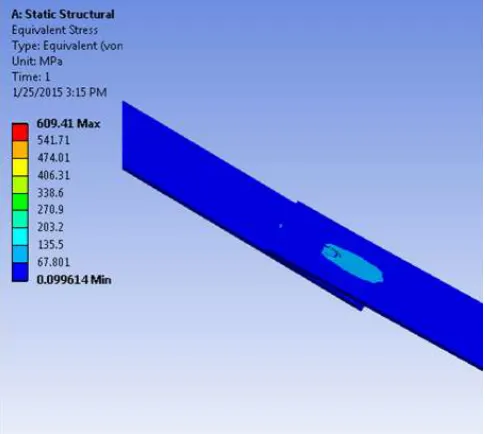
Figures 6–9 show the distributions of the Single spot tensile-shear specimen(SSTS) of stress on surface at both side of nugget of the pieces of SSTS specimen, with specimens developing afterthe maximum (3000 N) and minimum loads are applied. High stresses develop on the inner surfaces of the sheets close to the peripheries of the spot-weld nuggets. The peak tensile stress develops close to the spot weld but not on its circumference. The location of the high stress conforms to the fatigue crack initiation sites experimentally observed in previous studies.
Because the minimum load is tensile and quite low, significant compressive stresses existing after unloading may only be attributed to residual stresses developed due to non-uniform plastic deformation. Although load transfer occurs through the spot-weld joint, the nugget is subject to low stresses because its thickness is large in comparison to the sheet thickness. Besides which, the nugget is mainly subject to shear loading and the plate is mainly subject to bending moment. Conse- quently, bending induces larger stresses. Due to the effect of bending, stresses change from tension to compression through the thickness as seen in Figs 6 and 7. For this reason, flexural rigidity of the plate, i.e. its resistance to bending significantly affects the stress level even though the plates are subject to in-plane loading. The pieces of SSTS specimens increase its flexural rigidity, especially at the sides. Considering that the load is transferred through the middle region, one may see why stresses are more concentrated in the SSTS specimen (Fig. 9) in comparison
Model Formulation
Analytical Calculation
IJEDR1602215
International Journal of Engineering Development and Research (www.ijedr.org)1217
Fig. 7 Distribution of Maximum shear stress (Max. 348.33 MPa) on surface at both side of nugget of the SSTS specimen developed due to the minimum load to 3000N (t = 1.4 mm, d = 6 mm)
Fig. 6 Distribution of von mises stress (Max. 609.41 MPa) on surface at both side of nugget of the SSTS specimen developed due to the minimum load to 3000N (t = 1.4 mm, d = 6 mm)
Fig. 8 Distribution of Fatigue life (Min. 862.45) on surface at both side of nugget of the SSTS specimen developed due to the minimum load to 3000N (t = 1.4 mm, d = 6 mm)
© 2016 IJEDR | Volume 4, Issue 2 | ISSN: 2321-9939
IJEDR1602215
International Journal of Engineering Development and Research (www.ijedr.org)1218
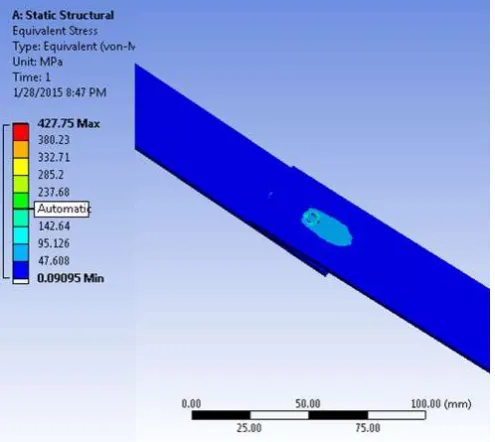
Figures 10–13 show the distributions of the Single spot tensile-shear specimen(SSTS) of stress on surface at both side of nugget of the pieces of SSTS specimen, with specimens developing afterthe maximum (3000 N) and minimum loads are applied. High stresses develop on the inner surfaces of the sheets close to the peripheries of the spot-weld nuggets. The peak tensile stress develops close to the spot weld but not on its circumference. The location of the high stress conforms to the fatigue crack initiation sites experimentally observed in previous studies
Figures 12 show the distributions of Fatigue life with application of minimum load (N) to 3000N load minimum Life fund to be 2197.8 and thickness and diameter are 2 and 6 mm respectively, Figure 13 show the distributions of Safety Factor with application of minimum load (N) to 3000N load minimum Safety factor fund to be 0.20152
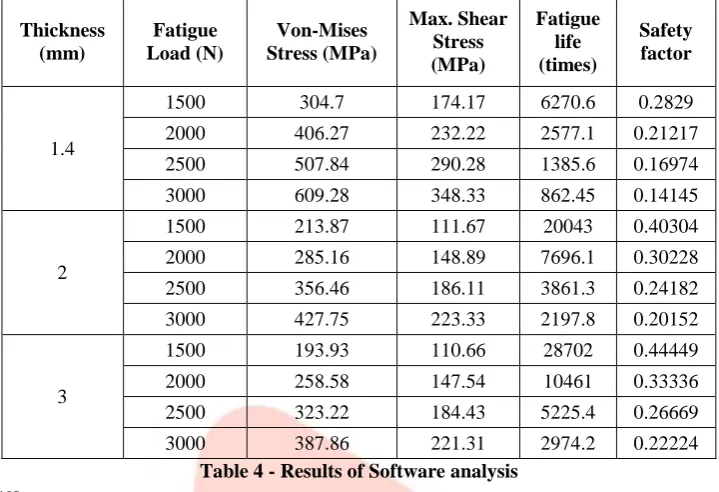
Results of Software analysis
Fig. 11 Distribution of Maximum shear stress (Max. 223.33MPa) on surface at both side of nugget of the SSTS specimen developed due to the minimum load to 3000N (t = 2 mm, d = 6 mm)
Fig. 10 Distribution of von mises stress (Max. 427.75 MPa) on surface at both side of nugget of the SSTS specimen developed due to the minimum load to 3000N (t = 2 mm, d = 6 mm)
Fig. 12 Distribution of Fatigue life (Min. 2197.8) on surface at both side of nugget of the SSTS specimen developed due to the minimum load to 3000N (t = 2 mm, d = 6 mm)
IJEDR1602215
International Journal of Engineering Development and Research (www.ijedr.org)1219
fatigue life prediction models, the stress states developed in the structure should be determined accurately. For this purpose, a commercial FEA software, ANSYS (version 15), was used. Residual stresses developed during the formation of the spot weld were not considered in the stress analysis.Followings are the results of single lap spot welded joint on different load range by using different thickness specimen-, von-Mises Stress, Maximum Shear Stress ,Fatigue life, safety factor
Thickness (mm)
Fatigue Load (N)
Von-Mises Stress (MPa)
Max. Shear Stress (MPa)
Fatigue life (times)
Safety factor
1.4
1500 304.7 174.17 6270.6 0.2829
2000 406.27 232.22 2577.1 0.21217
2500 507.84 290.28 1385.6 0.16974
3000 609.28 348.33 862.45 0.14145
2
1500 213.87 111.67 20043 0.40304
2000 285.16 148.89 7696.1 0.30228
2500 356.46 186.11 3861.3 0.24182
3000 427.75 223.33 2197.8 0.20152
3
1500 193.93 110.66 28702 0.44449
2000 258.58 147.54 10461 0.33336
2500 323.22 184.43 5225.4 0.26669
3000 387.86 221.31 2974.2 0.22224
Table 4 - Results of Software analysis
Estimated fatigue lives
In a mechanical component under fluctuating loads, the process of nucleation, growth and joining of micro-cracks is expected to take place in highly stressed regions. Fatigue crack growth is known to occur along planes where the tensile stress takes its maximum value. Accordingly, the fatigue life calculations were carried out using the stress states in the element at which the maximum tensile stress develops. This element is located on the surface around the peripheries of the spot welds as shown in Figs 09 and13.
Comparison of the predicted and measured fatigue lives
The accuracy of the fatigue life predictions was verified by comparing them with the fatigue lives of SSTS specimens of different thickness experimentally obtained by analytical calculation. The FE calculations were carried out using the material properties, loading and geometry of the specimens provided in those studies.
Fig. 14 shows the variation in von-mises stress (MPa) with load (N). It was found that there is a direct relationship between the von-mises stress (MPa) with load (N). As the load increases the von-mises stress is also increases. In this experiment we found that below 2 mm plate thickness the von-mises stress drastically increased and for the thickness 2mm and 3mm the values are much closed. As plate thickness increases the von-mises stress (MPa) decreases.
Fig. 15 shows the variation in maximum shear stress (MPa) with load (N). It was found that there is a direct relationship between the maximum shear stress (MPa) with load (N). As the load increases the shear stress is also increases. In this experiment we found that below 2 mm plate thickness the shear stress drastically increased and for the thickness 2mm and 3mm the values are very closed. For 2mm thickness and 2000N load the maximum shear stress value is 150 Mpa and for 1.40 mm thickness and 2000N load the maximum shear stress value is 240 Mpa.
Fig. 14 Comparison of predicted fatigue lives with Load range (N)and von mises stress (MPa) for different thickness (t1=1.4mm, t2=2mm,t3=3mm)
© 2016 IJEDR | Volume 4, Issue 2 | ISSN: 2321-9939
IJEDR1602215
International Journal of Engineering Development and Research (www.ijedr.org)1220
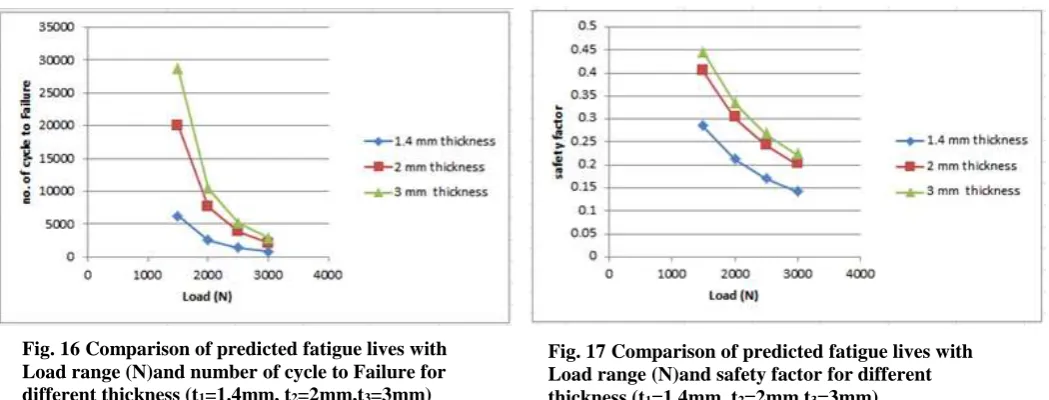
Fig. 16 shows the no. of cycle to failure with load (N). It was found that there is an inverse relationship between the safety factor and load (N). As the load increases the no. of cycle to failure is decreases. In this experiment we found that at the value of load 3000N the values of no. of cycle to failure is very closed
Fig. 17 shows the variation in safety factor with load (N). It was found that there is an inverse relationship between the safety factor and load (N). As the load increases the safety factor is decreases. In this experiment we found that below 2 mm plate thickness the safety factor drastically increased and for the thickness 2mm and 3mm the values are much closed. As plate thickness increases the safety factor decreases
Results of Analytical calculation
Followings are the results of single lap spot welded joint on different load range by using different thichness specimen- von-Mises Stress,
thickness (mm)
fatigue load (N)
von-mises stress (MPa)
1.4
1500 113.68
2000 151.57
2500 189.47
3000 227.36
2
1500 79.53
2000 106.1
2500 132.62
3000 159.15
3
1500 53.05
2000 70.73
2500 88.41
3000 106.1
Table 5- Results of Analytical calculation
Fig. 18 shows the variation in von-mises stress (MPa) with load (N) on the basis of analytical calculations. It was found that there is a direct relationship between the von-mises stress (MPa) with load (N). As the load increases the von-mises is also increases.similarle in software analysis also showes the graph of von mises stress with load (N) the nature of graph is nearly same. In this experiment we found that below 2 mm plate thickness the von-mises drastically increased and for the thickness 2mm and 3mm the values are much closed. As plate thickness increases the von-mises stress (MPa) decreases
.
IV RESULTS AND DISCUSSIONS
Fatigue life of sheet 1.40 mm thickness and 2 mm thickness is more than the difference of fatigue life between 2 mm and 3 mm thickness plate. So from this we concluded that 2 mm thickness sheet is best suitable for spot weld structure to overcome the fatigue failure. In this project, we have to calculate the total deformation, von-Mises stress and Max Shear Stress of single lap
Fig. 16 Comparison of predicted fatigue lives with Load range (N)and number of cycle to Failure for different thickness (t1=1.4mm, t2=2mm,t3=3mm)
Fig. 17 Comparison of predicted fatigue lives with Load range (N)and safety factor for different thickness (t1=1.4mm, t2=2mm,t3=3mm)
IJEDR1602215
International Journal of Engineering Development and Research (www.ijedr.org)1221
welded plate with the help of FEA software i.e, ANSYS software Static Structural Analysis. Similarly difference of these stresses of sheet 1.40 mm thickness and 2 mm thickness is more than the difference of these stresses between 2 mm and 3 mm thickness plate. So from this we concluded that 2 mm thickness sheet is best suitable for spot weld structure to overcome the fatigue failure. Comparing the nature of graph of von-mises stress (MPa) with load (N) on the basis of analytical calculations and software analysis is showes nearly same natureV CONCLUSION
In this study, we conclude that the fatigue failure analysis of spot welded single lap joint with the help of ANSYS software. A software system has been developed for the fatigue life prediction of spot welds. A computational technique developed and has been applied to predict the fatigue life of spot welded structures in tensile loading.
.
It was observed that the von-Mises Stress is maximum for 1.4 mm thickness sheet and minimum for 2.0mm and 3.0 mm thickness sheet. So it is found that difference of these stresses of sheet 1.40 mm thickness and 2 mm thickness is more than the difference of von-mises stresses between 2 mm and 3 mm thickness plate. So from this we concluded that 2 mm thickness sheet is best suitable for spot weld structure to overcome the fatigue failure.VI ACKNOWLEDGMENT
I express my sincere gratitude to my guide, Prof. P. N. Awachat, Professor, Mechanical Department, G. H. Raisoni Academy of Engineering and Technology for his valuable guidance, proper advice, and careful reviews of my work at all stages, and their highly appreciated instruction and constant encouragement during the course of my work on this paper.
I am highly thankful to Dr. Achal Shahare, Professor and H.O.D., Mechanical Department, G. H. Raisoni Academy of Engineering and Technology for his expert advice, technical suggestions and moral support during in this work.
VII REFERENCES
[1] Young-Jin Yum, Young-Woo Chu, Seok-Jae Chu, Jung-Han Kim, Hee You, “Fatigue Analysis of Spot Welded Joints in Suspension Mounting Part” KSME International Journal, 2003, pp 1113-1119.
[2] G. Wang, M.E. Barkey, “Fatigue Cracking and Its Influence on Dynamic Response Characteristics of Spot Welded Specimens”, Society for Experimental Mechanics, VoL. 44, No. 5, 2004.
[3] M. M. Rahman, Rosli A. Bakar, M. M. Noor, M. R. M. Rejab, M. S. M. Sani, “Fatigue Life Prediction of Spot-Welded Structures: A Finite Element Analysis Approach”, European Journal of Scientific Research, Vol.22, No.3 (2008), pp 444-456. [4] Peter Heyes, Mikael Fermér, “A Spot-Weld Fatigue Analysis Module in the MSC/Fatigue Environment”.
[5] A Rupp, K Störzel, V Grubisic, “Computer Aided Dimensioning of Spot-Welded Automotive Structures”, SAE Technical Paper 950-711, 1995.
[6] Wonseok Jung, Dongho Bae, Ilseon Sohn, “Fatigue Design of Various Type Spot Welded Lap Joints Using the Maximum Stress”, KSME International Journal, Vol. 18 No. 1, 2004, pp 106-113.
[7] Soran Hassanifard, Mohammad Zehsaz, Firooz Esmaeili, “Spot weld arrangement effects on the fatigue behavior of multi-spot welded joints”, Journal of Mechanical Science and Technology 25 (3), (2011), 647-653.
[8] Ilseon Sohn, Dongho Bae, “Fatigue Strength Assessment of Spot-Welded Lap Joint Using Strain Energy Density Factor”, KSME International Journal, Vol. 15, No. I, 2001, pp 44-51.
[9] D. H. Bae, N. Tomioka, J. Niisawa, “Theoretical Analysis of Stress Distribution of Single Spot Welded Lap Joint Under Tension -Shear Load., Journal of JSAE, Vol. 39, 1988, pp105-11.
[10] D. H. Bae, “Fracture Mechanical Evaluation of Fatigue Strength of a Single Spot Welded Lap Joint under Tension-Shear Load”, J. of KSAE, Vol. 13, No. 5, , 1991, pp. 42—50.
[11] J. Sohn, D. Bae, “Fatigue Strength Evaluation of In-plane Bending Type Single Spot Welded Lap Joint by Strain Energy Density”, Transactions of KSME, Series A, Vol. 23, No. 9, 1999,pp. 1435-- 1441.
[12] M.E. Barkey, H. lfang, Y. Lee, “Failure Modes of Single Resistance Spot Welded Joints Subjected to Combined Fatigue Loading”, International Journal of Materials and Product Technology, 2001, pp 510-527.