International Journal of Innovative Technology and Exploring Engineering (IJITEE) ISSN: 2278-3075, Volume-8 Issue-6, April, 2019
Abstract: A brain tumour (BT) is an unusual proliferation of the cells inside the brain; major types of tumours are benign & malignant. Tumours can occur anywhere in the brain and contain almost any type of form, size and variance. BT is a hazardous disease that cannot be detected without hopping MRI. We present the efficient way to brainstorm the MRI films on this paper. Real datasets with different tumour shapes, sizes, locations, and internal texture are taken. Extracting the clinical data (a tumour), the aim of this paper is to come up with an effective segmentation using modified Convolution Neural Network-(CNN)where Elman network is involved. For these reasons we opt for the modified CNN based technique. It uses the MATLAB simulation.
Index Terms: Brain tumor, Benign, Malignant, CNN, and MRI
I. INTRODUCTION
Changing old or damaged new cells will cause normal cells to grow in control. For thoroughly understood reasons, tumour cells are reproduced uncontrollably. It is an unusual development in the brain. Brain tumours may be harmful or vulnerable. A benign brain tumour has slow growth and has unique boundary and may rarely spread Even if cell is not viral, benign tumours will be life threat ending if located in key area. A malignant brain tumour grows rapidly, spreads in irregular borders and adjacent brain areas. The brain tumours do not apply to the definition of cancer as it does not spread outside of the brain.
Human skull cannot expand to the growing mass of the brain. Hence it results in the formation of tumour and abnormal brain tissues. Some brain tumours result in a blocking of cerebrospinal fluid (CSF) which passes through the cerebrum and the spinal cord. This barrier increases infrared pressure and can increase hydroxides. Some brain tumours cause swelling (oedema). Quantity, pressure, and inflammation are the culmination resulting in the symptoms of the brain tumour.
Revised Manuscript Received on April 07, 2019.
R.G.Sushmitha,VLSI Design,School of Computing,SASTRA Deemed to be University, Thanjavur, India.
[image:1.595.335.513.173.331.2]Dr.R.Muthaiah,School of Computing,SASTRA Deemed to be University, Thanjavur, India.
Fig 1. The brain tumours from various brain regions
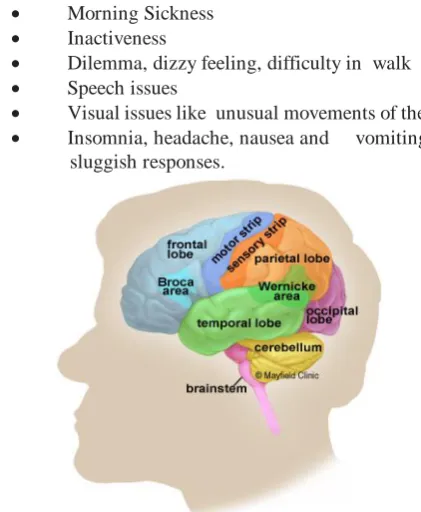
Symptoms of brain tumour:
Brain tumours can cause damage by obstruction of the tissues or by increasing intra-cranial pressure. Various parameters
like size of the tumour its type, and its location in the brain determine its symptoms (Fig 2).
Generalized symptoms include: Morning Sickness Inactiveness
Dilemma, dizzy feeling, difficulty in walk Speech issues
Visual issues like unusual movements of the eye Insomnia, headache, nausea and vomiting, sluggish responses.
Fig 2. The brain tumours from various brain regions
An effective medical image segmentation of
brain tumour using modified CNN algorithm
[image:1.595.317.528.449.705.2]Specialized /Localized Symptoms include:
Behaviour and emotional changes; Weak judgment, discouragement or prevention, Paralysis, reduced mental ability and memory loss.
Weak speech, Writing, drawing or labelling issues; Unrecognized, Internal disorders and eyelid disintegration.
Blurred vision, illusions.
Temporary nerve tumours can cause difficulty in language comprehension. Memory deterioration, ,More aggressive behaviour.
II. IMAGE SEGMENTATION
Image segmentation holds its meaning as the partitioning of any image that is digital into many segments commonly called as pixels. The vision of image segmentation is simplification of image representation and also analysis is made easier.
Image segmentation enables the location of objects and boundary like curves, lines, etc. in an image. It also labels each pixel in an image such that the pixel with same label share certain characteristics. The resultant segmented image consists of a set of segments which cover the entire image. The pixels of a region are similar with some characteristics which can be intensity color or texture. Generally with regard to image segmentation as stack in medical imaging, the resulting contours after image segmentation are used to create 3Dimensional reconstructions by using interpolation algorithms such as marching cubes.
III.EXISTING SYSTEM
The statistical zone integration (SRM) is an algorithm used in the image section. [1] The method is used to evaluate valuations in a regional interval and to merge the basis of the unification basis, resulting in a small list. Some useful examples make up a generation group in the population, or group the neighbouring pixels based on the shadows falling into a particular gateway (qualification criterion) in image processing. The idea begins with a fraction of a pixel and is used in statistical experimentation in neighbouring circles (ascending order of radical differences).
Fig 3.Block diagram of Existing system
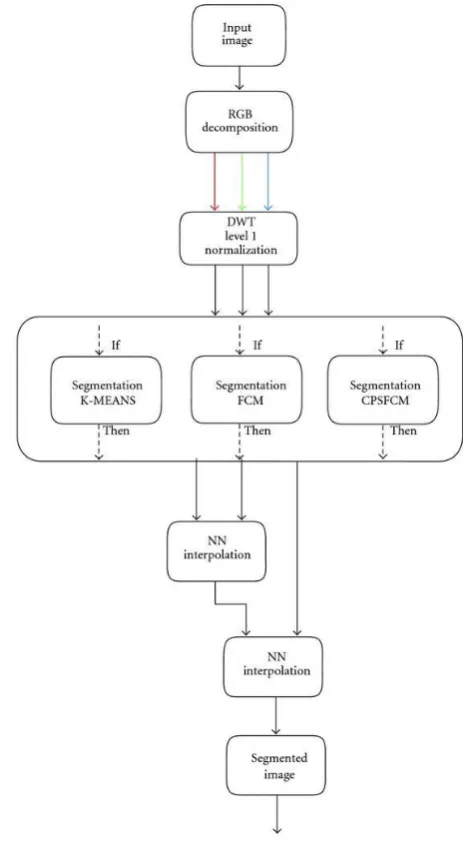
IV. PROPOSED SYSTEM
[image:2.595.324.556.59.487.2]International Journal of Innovative Technology and Exploring Engineering (IJITEE) ISSN: 2278-3075, Volume-8 Issue-6, April, 2019
Fig 4. Block diagram of proposed method
METHODOLOGY:
A general digital image processing system consists these following steps to get the desired result:
[1] Image Modeling [2] Image expansion [3] Feature Extraction
[4] Recognition and identification
[1] Image Modeling:This step includes number of steps is as follows
Read the input image: The input image is loaded using the uigetfile() function, which is MATLAB inbuilt function, and the image window is displayed using the imshow () function and display in the image window.
RGB To Gray: RGB image has three arrays of red, green and blue, it's hard to eat, so gray is made and it's very useful and effective. Gray_scale = R + G + B / 3 Gray level, 3 bit image is 23 = 8 gray level (ranging from 0 to 7) is pixel density ranges from 0 to 7 in the picture. rgb2gray () function is used.
Contrast Normalization:The difference of a picture can be enhanced using the Imadjust () function. That is, the intensity value in the image is extended. Contrary to the default, it is called a different plugin. It is used to improve the quality of the film.
[2] Image expansion: These steps are as follows:
Histogram Balancing: The Histeq () function is used for the histogram equation of the gray-scale image, which is used to adjust gray size in a picture.
[3] Feature Extraction:
To get this feature, multi-resolution is decomposed. Several resolutions are divided, such as HH (high-high), HL (high-low), LH (low-high) and LL (low low). It is composed of four different directions like vertical direction, horizontal direction, cross direction and angular direction. Tip of the tumour has high intensity, so it is necessary to change the bandwidth.
[4] Recognition and Identification:
The fusion of the film is made between the original image and the feature's extracted image.
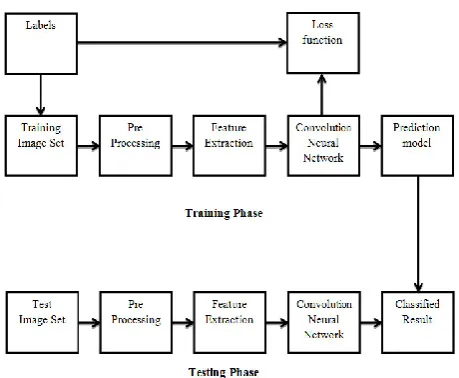
Convolutional Neural Network (CNN):
CNNs are intensive ANNs, primarily used for image classification.(eg referring to the name they see), clustering them with unity (image search), and recognizing the object in the display. They are identical to the various aspects of faces, individuals, street signs, tumors, vertebrae and visual data Convolutional networks perform Optical Character Recognition (OCR) and making language processing in analog and written documentation CNN is used for flashing applications. More recently, Toolbar networks have been directly used with graphic Convolutional networks with text analysis and map data.
One of the main reasons that the performance of the modified nets (ConvNets or CNNs) in Image Recognition increases the profound learning capabilities of the world. They bring great improvements in computer aided vision which pave way to self-driven automobiles, robotics, drones, medical diagnostics, vision disorders.The picture below typical Convolution neural network network.
Fig 5. Block diagram of CNN
Original input picture scanned for features.
Functional maps are stacked together, one for each filter we use. The large rectangle is a link to the downside.
Reduction by performance drawings.
A functional maps newly is created to pass filters on the first down sampled stack.
Second resize to fix second function maps.
A complete attached layer that classifies a label output for a stamp.
If more and more information is lost, the activated forms through the revised net become more concise and far from the visual shapes we recognize and the networks cannot provide easy intuitions with deep growth.
Each time, the input and learning rules are used. Static-themed links store the contents of the previous values of the latter values in units in the context of the environment (they are spreading in relation to the learning method before being used). This allows the network to maintain a kind of state, allowing the performers to perform tasks such as queue-computation beyond the power of a regular multipurpose perceptron.
(1)
Elman networks feed forward networks are in addition to the back links linking the plate delays.With the availability of full dynamic derivative calculations (fpderiv and bttderiv), Elman Network is not recommended except for historical and research purposes. Try more accurate learning time delay (timedelaynet), layer back (learate), NARX (narxnet), and NAR (nerate) neurological networks.
Fig 6. Elman Network layers
The Elman Network is a two-layer network behind the first layer input from the first layer output. This repeated back link allows the Elman Network to detect twice and create different forms of time. A two-layer Elman network is shown below. This Network has Dansic neurons in its hidden (repeat) layers, and its output layers have pure nerves. The mix is special in two layer networks with transactional functions, It can randomly calibrate randomly with any functionality (with a finite number of crashes). Only the need for sufficient neurons to the hidden layer is required. More complicated neurons are required as a complex problem increasing activity. The first layer has the link back that differs from the regular two-layer networks of Elman network. This connection delays the values from the previous time format used in the current time hierarchy. Therefore, both Elman networks, with the same weights and functions, have given similar entries in the given time form, although their outputs may vary due to varying feedbacks. Because the network stores information for future reference, it can learn temporary forms and animated forms. Elman Network is trained to respond and create two types of forms.
V. SOFTWARE USED
MATLAB:
MATLAB is a tool which does computation, visualization and programming into an user friendly environment, which provides problems and solutions for complex problems Its applications include:
Mathematics and calculation Algorithm development
Sampling, simulation and prototype Data analysis, analysis and visualization Science and Engineering Graphics
App Development, including graphical user interface builder.
MATLAB is an essential sequence to exchange within its basic data element is an interactive method. This allows us to solve many technical computational problems with matrix and vector formulas, especially in a portion of time, when writing a program in a non-scalar non-interactive language like C, or FORTRAN. The MATLAB version used in this project is MATLAB version 2012(MATLAB R2012b).
Application development tools.
Image Processing Signal Processing Control System Communications Neural Network Instrument Control Aerospace
Fuzzy Logic
Embedded MATLAB
VI. CONCLUSION
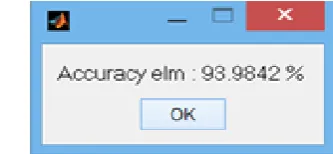
Smaller formal understanding, despite the growing importance of technology in health supply chains exists on the integration of technologies, the selection or performance implications of technology integration. In this paper we implemented an efficient brain tumour segmentation using modified CNN algorithm involving Elman network. Normal CNN based segmentation algorithm gives good performance and their accuracy rate is 82.7133%. Our proposed method gives better accuracy rate than the existing method with
93.9842% compared to CNN algorithm. It was compared for various sample input brain MR Images. So we conclude that the modified CNN algorithm involving Elman network gives efficient accuracy rate compared to the existing method.
International Journal of Innovative Technology and Exploring Engineering (IJITEE) ISSN: 2278-3075, Volume-8 Issue-6, April, 2019
OUTPUT SCREENSHOTS
Fig 7. Input noisy image
Fig 8. Weiner filter output
Fig 9. Histogram graph
Fig 10.Black matter Gray matter White matter values
Fig 11. Estimated bias field
Fig13. Neural network training
[image:6.595.335.502.50.127.2]Fig14. Pattern recognition neural network view
Fig 15. Compression Result
Fig.16 CNN Accuracy
Fig 17. Elman Network accuracy
REFERENCES
1.Pereira, S., Pinto, A., Alves, V., & Silva, C. A. (2016). Brain tumor segmentation using convolutional neural networks in MRI images. IEEE transactions on medical imaging, 35(5), 1240-1251.
2.Nock, R., & Nielsen, F. (2004). Statistical region merging. IEEE Transactions on pattern analysis and machine intelligence, 26(11), 1452-1458.
3.Angulo, J. (2015, October). Statistical Gaussian model of image regions
in stochastic watershed segmentation. In International Conference on Networked Geometric Science of Information (pp. 396-405). Springer, Cham.
4. Tajbakhsh, N., Shin, J. Y., Gurudu, S. R., Hurst, R. T., Kendall, C. B., Gotway, M. B., & Liang, J. (2016). Convolutional neural Kaus, M. R., Warfield, S. K., Nabavi, A., Black, P. M., Jolesz, F. A., & Kikinis, R. (2001). Automated segmentation of MR images of brain tumors. Radiology, 218(2), 586-591..
5.Kaus, M. R., Warfield, S. K., Nabavi, A., Black, P. M., Jolesz, F. A., & Kikinis, R. (2001). Automated segmentation of MR images of brain tumors. Radiology, 218(2), 586-591.
6.Bauer, S., Wiest, R., Nolte, L. P., & Reyes, M. (2013). A survey of MRI-based medical image analysis for brain tumor studies. Physics in Medicine & Biology, 58(13), R97.
7.Kalinovsky, A., & Kovalev, V. (2016). Lung image Segmentation using
deep learning methods and convolutional neural networks.
8.8. Jiang, F., Grigorev, A., Rho, S., Tian, Z., Fu, Y., Jifara, W., ... & Liu, S. (2018). Medical image semantic segmentation based on deep learning. Neural Computing and Applications, 29(5), 1257-1265.
9.9. Ibragimov, B., & Xing, L. (2017). Segmentation of organs‐at‐risks in head and neck CT images using convolutional neural networks. Medical physics, 44(2), 547-557.
AUTHORS PROFILE
R.G.Sushmitha is currently pursuing M. Tech. in VLSI Design at SASTRA Deemed To Be University, Thanjavur, Tamil Nadu, India. She received her B.E.
degree in Electronics and Communication
Engineering from Mookambigai Engineering
College, Keeranur,Pudukkottai Tamil Nadu, India.