Contributions to High-Performance Big
Data Computing
Geoffrey FOX a,1, Judy QIU a, David CRANDALL a, Gregor VON LASZEWSKI a, Oliver BECKSTEIN b, John PADEN c, Ioannis PARASKEVAKOS d, Shantenu JHA d,
Fusheng WANG e, Madhav MARATHE f, Anil VULLIKANTI f and Thomas CHEATHAM g
a Indiana University, [email protected], [email protected], [email protected], [email protected],
b Arizona State University , [email protected], c Kansas University, [email protected],
d Rutgers University, [email protected], [email protected] e Stony Brook University, [email protected],
f Virginia Tech (now at the University of Virginia) [email protected], [email protected],
g University of Utah, [email protected]
Abstract. Our project is at the interface of Big Data and HPC -- High-Performance Big Data computing and this paper describes a collaboration between 7 collaborating Universities at Arizona State, Indiana (lead), Kansas, Rutgers, Stony Brook, Virginia Tech, and Utah. It addresses the intersection of High-performance and Big Data computing with several different application areas or communities driving the requirements for software systems and algorithms. We describe the base architecture, including the HPC-ABDS, High-Performance Computing enhanced Apache Big Data Stack, and an application use case study identifying key features that determine software and algorithm requirements. We summarize middleware including Harp-DAAL collective communication layer, Twister2 Big Data toolkit, and pilot jobs. Then we present the SPIDAL Scalable Parallel Interoperable Data Analytics Library and our work for it in core machine-learning, image processing and the application communities, Network science, Polar Science, Biomolecular Simulations, Pathology, and Spatial systems. We describe basic algorithms and their integration in end-to-end use cases.
Keywords. HPC, Big Data, Clouds, Graph Analytics, Polar Science, Pathology, Biomolecular simulations, Network Science, MIDAS, SPIDAL
1.INTRODUCTION AND MOTIVATION
1.1.Activities
This work is a collaboration between university teams at Arizona State, Indiana (lead), Kansas, Rutgers, Stony Brook, Virginia Tech, and Utah. Our website is [1] describing work funded by the US National Science Foundation as NSF 1443054. The project is
1Corresponding Author, Digital Science Center, Indiana University Bloomington, IN, USA. E-mail:
constructing data building blocks to address major cyberinfrastructure challenges in several different communities including Biomolecular Simulations, Network, and Computational Social Science, Computer Vision, Spatial Geographical Information Systems, Remote Sensing for Polar Science, Pathology Informatics as well as core machine learning and optimization techniques. We are now exploring other possible communities such as those using streaming data systems where our work could be valuable. This paper updates an extensive project report from Fall 2016 [2] and extends a recent poster [3].
One set of the project building blocks are the components of our Middleware for Data-Intensive Analytics and Science (MIDAS) built by Indiana University and Rutgers that enables scalable applications with the performance of HPC (High-Performance Computing) and the rich functionality of the commodity Apache Big Data Stack. The other set of building blocks are the currently around 40 parallel high-performance members (see sections 4.2 and 4.3) of our Scalable Parallel Interoperable Data Analytics Library (SPIDAL). Interoperability implies a broad target for our software, which generates what we call HPC clouds on XSEDE systems, public clouds and petascale to exascale supercomputers. We support Java or applications written in more traditional HPC languages like C++.
The project has designed and is using an overall architecture built around the twin concepts of High-Performance Computing enhanced Apache Big Data Stack (HPC-ABDS) software and classification of Big data applications – the Ogres – that defined the key qualities exhibited by applications and required to be supported in software. This key early work is well published and mature enough to guide our software architecture and choice of broadly usable building blocks. It has had a significant impact on the NIST Big Data Interoperability Framework [4] and is summarized in section 2. We have also proposed a Big Data – Big Simulation and HPC convergence based on these ideas, which suggest that our SPIDAL library and MIDAS middleware will be important for realizing convergence. We have been working closely with the BDEC (Big Data Exascale Computing) initiative on both convergence and more broadly use of HPC in Big Data systems [5]. The kickoff BDEC2 meeting was hosted by Indiana University in November.
MIDAS mixes traditional HPC technologies such as MPI, Pilot Jobs, and Slurm with Big Data environments such as Hadoop, Spark, Flink, Heron, Storm, Docker, Mesos, Kubernetes, and Tensorflow. We have several published studies that look at partial integrations such as MPI and Hadoop or Slurm and Heron. However, now we have designed a clean HPC-Big Data middleware with 3 key components: Pilot Jobs, Harp, and Twister2. Pilot jobs have successfully been extended from simulations to Big Data. Harp integrates with Hadoop providing both collective communication and the Intel Data Analytics node library DAAL (Data Analytics Acceleration Library). The success of the Intel Parallel Computing Center@IU is built around this. Finally, Twister2 aims to provide the full functionality of Spark Flink and Heron including dataflow communication (where we have released a library Twister: Net), RDD-style in-memory databases, SQL modules but with integrated high-performance mechanisms and software.
1.2.Big Data Application Analysis; Big Data Ogres
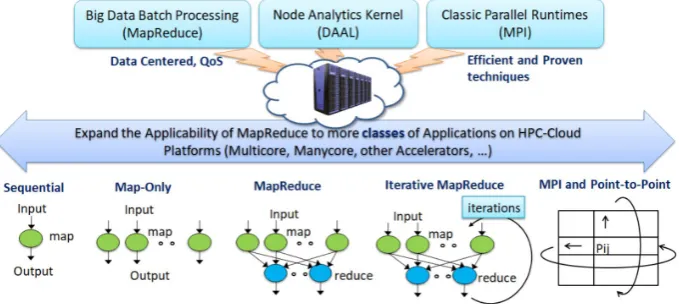
completed work, the Big Data Ogres built on a collection of 51 big data uses gathered by the NIST Public Working Group where 26 properties were gathered for each application [4]. This information was combined with other studies including the Berkeley dwarfs [6], the NAS parallel benchmarks [7], [8] and the Computational Giants of the NRC Massive Data Analysis Report [9]. The Ogre analysis led to a set of 50 features divided into four views that could be used to categorize and distinguish between applications [10]. The four views are Problem Architecture (Macropattern); Execution Features (Micropatterns); Data Source and Style; and finally the Processing View or runtime features. We generalized [11] this approach to integrate Big Data and Simulation applications into a single classification that we called convergence diamonds with the total facets growing to 64 in number and split between the same 4 views and this is shown in fig. 1-1. Further, a mapping of facets into the work of this project has been given earlier [10].
1.3.Global Artificial Intelligence and Modelling Supercomputer
Recently Microsoft research described their computing systems work under the umbrella term of the Global AI Supercomputer. We can expand this idea to describe our converged big data and big simulation approach as a Global Artificial Intelligence and Modelling Supercomputer (GAIMS). We add modeling to include simulations and to recognize that big data analysis includes both data and model. GAIMS consists of an intelligent cloud integrated with an intelligent edge. The intelligent cloud is logically centralized but physically distributed consisting by 2021 of over 600 hyperscale data centers (roughly over 50,000 servers each). There will be by 2021 around 14 billion links to the Intelligent Edge or IoT, which is a distributed Data Grid holding over 80% of the digital data created each year [12], [13]. Both the Intelligent Cloud and Intelligent Edge form Grids in a parlance that has recently fallen out of favor. Compared to previous work on Grids, today’s realization has a much greater emphasis on data and as used has a clearer administrative structure.
2.MIDDLEWARE BUILDING BLOCKS (MIDAS)
2.1.High-Performance Computing enhanced Apache Big Data Stack
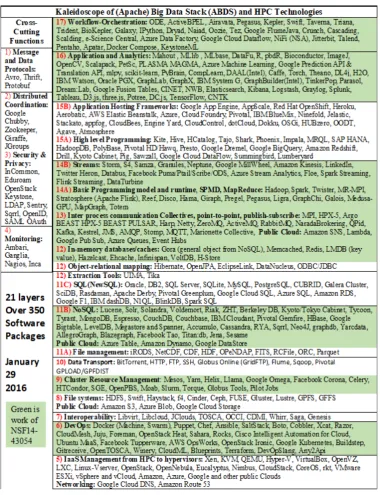
An important but completed project gathered in Figure 2-1 much existing relevant systems software coming from either HPC or commodity Apache or other Big Data sources [18]. We stopped collecting software names as although the active field was still generating new software names, we felt the message and even software architecture was clear, and we did not gain anymore from increasing our collection which started in 2013 with just 35 members [19].
The software is broken up into 21 layers so software systems are grouped by functionality and the layers where there is special attention in this project are colored green in Figure 2-1. This software collection is termed HPC-ABDS (High Performance Computing enhanced Apache Big Data Stack) as many critical core components of the commodity stack (such as Hadoop, Spark, and HBase) come from open source projects while HPC is needed to bring performance and other parallel computing capabilities as we described in sections 1.3 and 4.1 [20].
Note that Apache is the largest but not the only source of open source software; we believe that the Apache Foundation is a critical leader in the Big Data open source software movement and use it to designate the full big data software ecosystem. The figure also includes proprietary systems as they illustrate key capabilities and often motivate open source equivalents. We built this picture for big data problems, but it also applies to big simulation with the caveat that we need to add more high-level software at the library level and more high-level tools like Global Arrays.
One essential idea of our Big Data HPC convergence for software is to make use of ABDS software where possible as it offers richness in functionality, a compelling open-source community sustainability model and typically attractive user interfaces. ABDS has a good reputation for scale but often does not give good performance. Our approach augments ABDS with HPC ideas, where we illustrated this with Harp for Hadoop [21]–[23], Storm [24], and the basic Java environment [25]. Twister2 [26], [27] in section 2.4 builds a toolkit from the best of Spark, Heron (Storm), Kafka, Harp-DAAL, MPI, Mesos, Slurm and Kubernetes and offers an HPC-ABDS Platform as a Service. We suggest that GAIMS can use HPC-ABDS for both big data and big simulation applications.
2.2.Harp-DAAL Computation Model and Collective Communication
Figure 2-1: HPC-ABDS as compiled January 29, 2016, with layers of particular interest in this project shown in green [18].
optimized kernels on Intel® Xeon and Xeon Phi architectures. This way, the high-level API of Big Data tools can be combined with intra-node fine-grained parallelism that is optimized for HPC platforms. The current Harp-DAAL repository discussed in sections 4.2 and 4.3 includes over 40 batch and distributed modes of algorithms in Intel DAAL 2019 version. Recent work can be found in [33], [34] as well as a thorough report [28] and SC2017 tutorial[35].
Figure 2-2 Cloud-HPC interoperable software for High Performance Big Data Analytics at Scale
2.3.RADICAL-Cybertools
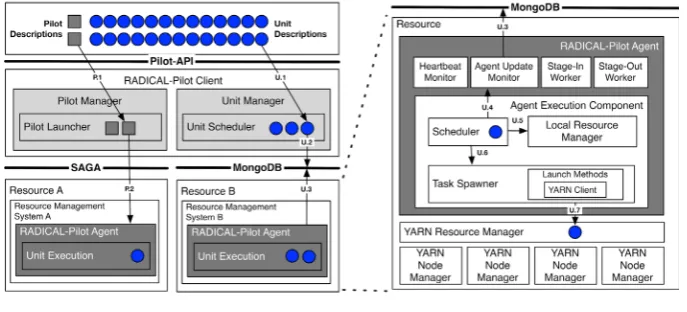
The Pilot abstraction [36] has been used in HPC environments for supporting a diverse set of task-based workloads. A Pilot-job is a placeholder job which is submitted to the resource manager of an HPC and acquires a set of resources where an arbitrary number of compute tasks can be executed. This functionality allows all the computational tasks to be executed directly on the resources, without being queued again. The pilot abstraction thus supports the requirements of task-level parallelism and high throughput as needed by science drivers, without affecting or circumventing the queue policies of HPC resources.
support (gsi)-scp, (gsi)-sftp, Globus Online, and local and shared file system operations via cp. Consequently, the size of the data along with network bandwidth and latency or filesystem performance determine the data staging durations.
Figure 2-3: RADICAL-Pilot and Pilot-Hadoop integration
RADICAL-Pilot has been extended to support big data processing and streaming jobs by utilizing Hadoop Spark and Kafka. Pilot-Hadoop [38] (Fig 2-3) enables the dynamic, ad-hoc creation of Hadoop or Spark clusters on HPC infrastructures. It allows users to execute scalable analytics, such as iterative machine learning, without the need to manage a Hadoop or Spark cluster on HPC. Pilot-Hadoop can be used via the same API as RADICAL-Pilot. As a result, a common API is provided for executing different types of workloads, e.g., MPI, YARN, or Spark. Pilot-Streaming [39], is a framework for supporting streaming frameworks, applications, and their resource management needs on HPC infrastructures. Pilot-Streaming is based on the Pilot-Job concept and enables developers to manage distributed computing and data resources for complex streaming applications. It enables applications to dynamically respond to resource requirements by adding/removing resources at runtime. This capability is critical for balancing complex streaming pipelines
2.4.Twister2
Twister2 provides a hosting environment for high performance data analytics by offering capabilities to connect applications to data platforms such as Kubernetes and Mesos, along with data processing capabilities, including batch and streaming analytics. Twister2 models a complex data application as a dataflow graph. One can configure the different parts of the dataflow graph at different granularities, making it suitable to execute end to end applications in a single dataflow. For example, part of a dataflow graph can be executing a SPIDAL algorithm written according to MPI specification, and another part can be doing streaming analytics.
to design and software engineering aspects of MPI implementations, it is difficult to integrate MPI environments with Big data environments.
Figure 2-4: Architecture of Twister2. [26], [27]
Fig 2-5: Left: K-means job execution time on 16 nodes with varying centers, 2 million points with 320-way parallelism. Right: K-Means with 4,8 and 16 nodes where each node has 20 tasks. 2 million points with 16000 centers used.
for fine-grained parallel applications. Both task-based and distributed data set based API’s are offered to create dataflows that include streaming, batch, and machine learning components. In addition to that, Twister2 will provide fault tolerance at the dataflow node level for both streaming and batch applications.
An optimized dataflow communication has been developed as an independent framework to support both streaming and batch data processing [27] operations. Dataflow communication is used for data processing operations such as shuffle, join unions, and key-based operations and for integrating with other frameworks. This library can work using an MPI implementation or using plain sockets, making it suitable for HPC and clouds. Figure 2-5 shows the performance of K-Means on Spark and Twister2 with varying number of clusters and nodes where it performs considerably well compared to the big data framework. We are taking an incremental approach for developing Twister2 as an open source community driven project. The initial release of Twister2 provides the ability to run both batch and streaming analytics for large datasets. Further, we will enhance the capabilities to provide richer dataflows that include applications written in MPI. The first publicly available Twister2 release was at the end of September 2018 [43] and we expect a near-final version a year later.
3.APPLICATION COMMUNITY ACTIVITIES
3.1.Network Science Activities
3.1.1.Network Generation Systems
Motivation. A number of network science applications involve constructing an ensemble of networks with properties close to a given real network. Such ensembles are useful for sensitivity analysis, significance testing, and scaling studies. There are two broad approaches for generating such random networks. The first involves using a random graph model, e.g., the Erdos-Renyi (ER), Chung Lu (CL), Preferential Attachment model, Stochastic block model (SBM), BTER, etc. There are a large number of such models, and they seek to generate instances, which preserve the degree sequence, and other properties, such as the community structure and clustering. Most of these models are very simple and end up specifying a probability for each pair of nodes to be connected. However, a naïve method of generating instances from such a model would take quadratic time, even if the final graph is sparse. We have developed some of the best scaling algorithms for generating instances from many random graph models in parallel. The second approach involves performing random edge switches, starting at a given graph. This is known to converge to a stationary distribution on the space of graphs with the same degree sequence. However, this is an inherently sequential process, and we have developed parallel algorithms for this problem.
algorithm is O(m/P + D + P), where m is the expected number of edges, and P is the number of processors. In contrast to earlier algorithms, the associated constants and overheads are significantly smaller for our algorithms. Experimental results show that our algorithms are about 3–4 times faster than the previous algorithms (Fig 3-1). Moreover, our parallel algorithm achieves an almost optimal load balancing using an efficient load balancing technique and scales very well to a large number of processors. Our parallel algorithm can generate a network with 250 billion edges in just 12 seconds using 1024 processors.
Fig 3-1 Performance of our network generation algorithm (DG) [40], compared with a prior method (denoted by AK): (a) strong scaling, (b) load balancing across processors.
In [45], we develop highly scalable algorithms for edge switching under a variety of constraints. The basic edge switch operation involves picking two random edges (a, b) and (c, d), and replacing them with edges (a, d) and (c, b) respectively, i.e., the end vertices of the selected edges are swapped with each other. This operation is repeated either a given number of times or until a specified criterion is satisfied. It is easy to see that an edge switch operation preserves the degree of each vertex. We present distributed memory parallel algorithms for switching edges in massive graphs with the constraint that the graph remains simple. The dependencies among successive edge switch operations and the requirement of keeping the graph simple lead to significant challenges in designing a parallel algorithm. Dealing with these requires complex synchronization and communication among the processors, which in turn makes it challenging to gain any speedup by parallelization. The performance of the algorithms also depends on the partitioning of the graph. We study several partitioning schemes in conjunction with the algorithms and present their respective trade-offs. A harmonic mean speedup (compared to the sequential algorithm runtime) of 73.25 is achieved on eight different networks with 1024 processors. The algorithms require generating multinomial random variables in parallel, which is also a non-trivial problem. To the best of our knowledge, there is no existing parallel algorithm for the problem, and we present here a novel parallel algorithm for generating multinomial random variables, which achieves a speedup of 925 using 1024 processors.
3.1.2.Subgraph detection and analysis problems
(e.g., the counting problems are #P-hard). Prior methods for counting paths and trees only handled trees of size up to 10 in networks with 2 billion edges.
Our Results. We have developed new parallel algorithms that can handle larger subgraphs. In [34], we develop an improved parallelization of a technique known as color-coding, which has been the primary approach for obtaining rigorous approximation bounds for subgraph counting. Our algorithm, HARPSAHAD+, adapts a prior Hadoop based algorithm to HARP, and yields two orders of magnitude improvement in performance, as a result of its flexibility in task scheduling, data flow control and in-memory cache. We are therefore able to scale to networks with up to billions of edges and obtain a comparable performance when compared to a state-of-the-art MPI/C++ implementation.
For subgraphs of size k, the running time and space complexity of the color-coding technique scale as O((2e)k f(n)) and O(2kg(n)), respectively, where f( ) and g( ) are polynomial in the total number of nodes and edges. Therefore, the color-coding technique has not been able to scale beyond subgraphs of size 12. In [46], we consider a different approach for subgraph detection, based on an algebraic technique called multilinear detection. This technique involves representing subgraphs as multivariate polynomials. The subgraph detection problem is reduced to determining whether the resulting polynomial has a square-free (i.e., multilinear) term. We develop the first MPI based parallel adaptation of this technique, and this gives a significant improvement in both running time and space, which scale as 2k and k, respectively. This has allowed us to consider subgraphs of size up to 18.
3.2.Biomolecular Simulation Activities
About one-quarter of the computing power provided by XSEDE between 2011 and 2017 was used to perform biomolecular simulations (Figure 3-2). In the biomolecular simulation community analysis of the output from simulations is increasingly becoming a bottleneck compared to the generation of the data [47], [48]. In order to address this challenge, we investigated and developed applications of high-performance data analytics to processing and analyzing biomolecular simulations, in particular widely used classical molecular dynamics (MD) simulations.
We evaluated a number of data analytics frameworks for their suitability for biomolecular simulations (Sec. 4.4.1) and compared them for typical trajectory analysis algorithms against each other and an MPI-based implementation. The resulting picture is multi-faceted and provides a decision framework for users to choose a suitable data analytics framework. As part of this work, we also developed and implemented production grade parallel versions of algorithms for which we previously only had serial versions (Sec. 4.4.2) and a new library (PMDA, “parallel MDAnalysis”) that provides a platform for these algorithms. We also identified a barrier to achieving better scaling in parallel trajectory analysis, namely the I/O, and provide proof-of-concept solutions to overcome this problem (Sec. 4.4.3).
Figure 3-2. XSEDE SUs by research field for the time interval 2011-07-01 to 2017-09-30 [51]
3.3.Image Processing: Polar/Remote sensing
Technology for collecting, transmitting, and storing remote sensing data has rapidly improved over the last decade. In the case of polar science, for example, it is now possible for aircraft equipped with ground-penetrating radar systems to collect large-scale data about a vast area of polar ice in the span of a single flight. But while collecting this data has largely been solved, actually analyzing the data to extract useful data has remained a challenge. Originally, feature tracking in polar radar echograms was a manual process which was occasionally augmented by very simple semi-automated algorithms that usually considered only a few pixels of the image at a time. For 3D imaging, images were truncated to high signal to noise ratio regions with clear interfaces so that the simple automated algorithms could simply track a peak from column to column in the images. Reliance on human annotators and simple algorithms limits the scale and speed at which analysis of remote sensing data can be used.
use machine learning and statistical inference algorithms to robustly handle very noisy data. Our early work [52], [53] investigated this segmentation problem in 2d, along the flight line of the aircraft. Our more recent work [54], [55] has developed new techniques to reconstruct the bedrock layer in 3d, by integrating evidence across many tomographic slices collected along the flight line.
In two of the algorithms, the problem is formulated as an inference problem on a Markov Random Field (MRF), as shown in Fig. 3.3. MRF inference is NP-hard in the general case, so we
developed two approximate inference algorithms. The first uses the Viterbi algorithm [56] to solve for individual layers at a time in individual images, which can be done exactly and efficiently. This corresponds to considering a single column at a time of the 3D image MRF shown in Fig. 3.3. However, although the solutions it finds are exact within single layers, the results are not as good on 3D images because the 3D image must be broken into 2D “slices” and the inter-slice dependence cannot be adequately captured by the algorithm. To better handle 3D images, we introduced an approximate inference technique based on Tree Reweighted Message Passing (TRW-S) [54] which can incorporate evidence from multiple slices at once and yields significantly better results than Viterbi. An advantage of the statistical formulation of these models is that additional weak evidence, e.g., data from hand annotators or digital elevation maps, can be incorporated into the inference process. Additional pre-processing steps and additional evidence was added to the cost function used by the Viterbi and TRW-S algorithms, and the model parameters for each were tuned in [57].
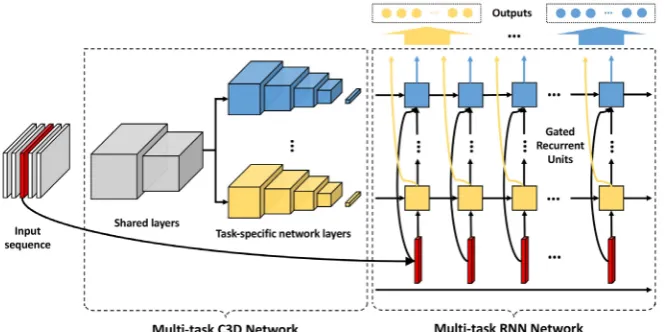
Inspired by the success of deep machine learning across a wide range of problems, we recently [55] introduced a multi-task spatiotemporal neural network (Figure 3.4) that combines 3D Convolutional Networks and Recurrent Neural Networks (RNNs) to address the 3d layer reconstruction problem. This is a novel approach adapted from techniques to analyze video, but there the temporal dimension is treated as equivalent to the row dimension in Fig. 3.4. This algorithm solves for multiple layers simultaneously (rather than one at a time) and improves results significantly over the TRW-S algorithm, even when no extra evidence besides image intensities are available. Depending on the number of iterations required by TRW-S to converge, the neural network approach can also provide a significant speed up.
Fig. 3-4: Multi-task spatiotemporal neural network combining 3D Convolutional and Recurrent Neural Networks.
3.4.Scalable Pathology Image Analysis
3.4.1.Introduction to Pathology Image Analysis
The rapid advancement in large-throughput tissue scanning technologies has enabled the production of pathology imaging big data at cellular and subcellular levels with unprecedented rich information. Digital pathology has been used for basic research in a wide scope and becomes an emerging technology promising to support computer-aided diagnosis, which has been recently approved by the FDA [58]. It will enable researchers to better understand the underlying biological mechanisms of pathological evolutions and disease progressions through quantitative pathology analysis and spatial analytics. Recently, 3D digital pathology is made possible through slicing tissues into serial thin sections. The information-lossless 3D tissue space represented by pathology image volumes holds significant potential to enhance biomedical studies and diagnosis through 3D image and spatial analytics. Pathology image analysis can identify massive spatial objects of interest, such as cells and blood vessels, and segment their boundaries. The derived objects and their features are used for complex queries and analytics to support biomedical research or diagnosis.
[image:15.595.130.463.156.322.2]topology. For spatial queries, while minimal bounding boxes (MBBs) have been successfully used in traditional spatial indexing, MBBs are not effective to represent such complex 3D objects in distance-based spatial queries, such as nearest neighbor search. This demands new indexing approaches.
Our goal is to create a framework with new systematic methods to support effective and scalable 2D and 3D pathology image analysis leveraging big data computing platforms and large memory.
3.4.2.Pathology structure segmentation.
We created a robust two-step segmentation framework that can recover contours of an arbitrary number of histologic objects in occlusion.
Segmentation Initialization. For small-scale objects, such as cells, we detect cell seeds with joint information drawn from spatial connectivity, edge map, and shape analysis. For large pathology structures like vessels, we use an adaptive color decomposition method that can dynamically optimize the color decomposition matrix in a way such that the resulting individual stain image channels have the maximum joint entropy. With the derived stain-specific image channel, we create a pathology structure probability map with multi-scale steerable filter processing to indicate the likelihood of a given 2D pixel (or 3D voxel) belonging to a specific pathology structure.
[image:16.595.122.337.389.676.2]Contour Deformation. We develop a variational level set model that incorporates image intensity, prior shape, and edge information for contour deformation. For cells, we deform contours by minimizing a new energy functional that incorporates a new shape term in a sparse shape prior representation, an adaptive contour occlusion penalty term, and a boundary term encouraging contours to converge to strong edges. A region-based active contour model is developed with a level set formulation based on Mumford-Shah’s functional. We create a sparse shape prior library with mode detection by non-parametric clustering over shape manifolds derived from manifold learning. In this way, we can effectively extract representative shape codes from a large number of shape annotations without blindly specifying prior shape number and shape codes in the shape library [59].
3.4.3.Scalable MapReduce based image analysis framework.
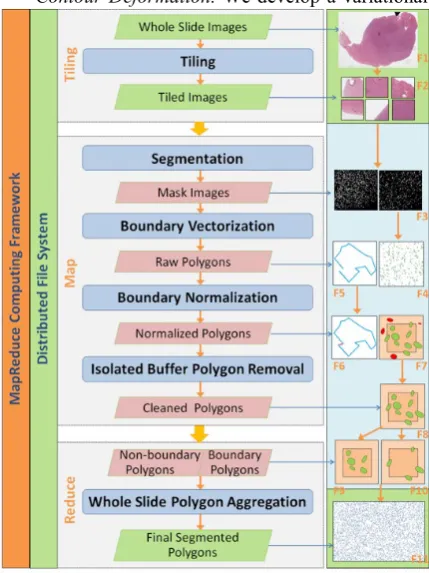
To provide scalable pathology image processing, we have developed a highly scalable MapReduce based image analysis framework shown in Fig. 3.5 for whole slide image processing, in which segmentation algorithms can be plugged in. The approach is through partitioning the image space into overlapping tiles for consideration of boundary-crossing object problem, processing titles independently as parallel tasks, and merging and normalizing partial objects from individual tiles. To handle partial objects from overlapping regions, we take a spatial index-based approach for removing redundant polygons that represent the same object. The framework is implemented for both commodity clusters and commercial clouds such as Amazon Web Services (AWS). The performance study showed high scalability on large data sets [60], [61].
[image:17.595.124.475.327.550.2]3.4.4.3D pathology image analysis pipeline.
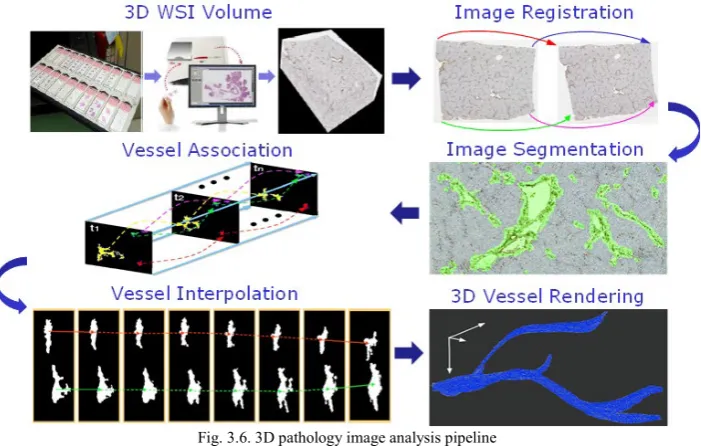
Fig. 3.6. 3D pathology image analysis pipeline
We developed methods on three most principal image analysis components: 3D pathology image registration, pathology structure segmentation, and 3D reconstruction illustrated in Fig. 3.6.
3.5.Spatial Big Data Querying Systems
3.5.1.Introduction to Spatial Query Systems
[image:18.595.127.472.358.514.2]The challenges for spatial big data come not only from the volume but also the complexity, such as the multi-dimensional or dynamic nature of the data. Our research goal on spatial big data management is to address the research challenges for delivering effective, scalable and high performance software systems for managing, querying and mining complex big data at multiple dimensions, including 2D and 3D spatial data, and spatial-temporal data. This is driven by emerging spatial big data problems from geospatial applications, location-based services, and social network applications, and rapid improvement of data acquisition technologies such as high-resolution tissue scanners for pathology imaging. Managing and analyzing such data poses several major challenges, including the explosion of data volume, high complexity of data, and/or temporal dynamics. We have created novel open source software systems shown in Fig. 3.7 for processing 2D and 3D spatial big data on modern big data platforms to support multi-scale applications in various domains, ranging from geospatial data, population data, and microscopy imaging data (biological/pathology objects).
Fig. 3-7. Overview of 3 spatial big data systems described in the text
3.5.2.Hadoop Based Scalable Spatial Queries (Hadoop-GIS)
3.5.3.Spark Based Spatial Queries (SparkGIS).
SparkGIS [67], [68] is a spatial data querying system for high throughput and low latency spatial query processing built on Apache Spark. SparkGIS takes advantage of the in-memory processing capabilities of Spark by adapting the core querying methods of Hadoop-GIS to Spark. SparkGIS addresses the problem of memory constraint as querying performance will drop significantly when data does not fit into memory. SparkGIS takes a spatial query rewriting approach to break a big query into small ones that can fit into memory and be pipelined combining compressed binary data storage in memory. SparkGIS supports common spatial queries, including range, spatial join, and k-nearest neighbor search and can be extended to other complex query pipelines. On-demand in-memory indexes allow SparkGIS to prune input data and apply compute-intensive operations on only a subset of relevant spatial objects and consequently achieve higher performance. SparkGIS employs a layered architecture that enables system extensibility for seamless integration of auxiliary distributed computation such as Jaccard Coefficient as a plugin. SparkGIS could significantly boost spatial query performance over base systems.
3.5.4.Efficient In-Memory Based Spatial Queries for Large-Scale 3D Data with Complex Structures (iSPEED).
4.INTEGRATION OF TECHNOLOGY AND APPLICATIONS
4.1.Approaches to a High performance GAIMS
Naively a successful GAIMS must use HPC approaches as it needs to simulate large systems (models) and analyze large data. However, most ABDS and commercial Big Data approaches avoid HPC except for cases like deep learning where HPC is essential and used from the start. However, we intend to pursue better functionality and better performance by combining HPC (including MPI, Pilot Jobs, Slurm) and Big Data (including Hadoop, Spark, Flink, Heron, Docker, Mesos, Kubernetes, and Tensorflow). We can identify different approaches
a) Fix performance issues in Spark, Heron, Hadoop, Flink, etc. This is messy as some features of these big data systems are intrinsically slow while all these systems are “monolithic,” and it is difficult to deal with individual components. We and others have explored this for Hadoop, Spark, and Storm. b) Execute HPBDC from classic big data system with custom communication
and task generation environment. This is the approach of Harp for the Hadoop ABDS environment and for RADICAL-Pilot applied to Spark, Hadoop, and Streaming.
c) Provide a native Mesos/Yarn/Kubernetes/HDFS high performance execution environment with the functionalities of Spark, Hadoop, Flink, and Heron. This is the goal of our Twister2 approach.
d) Execute data analytics with MPI in a classic (Slurm, Lustre) HPC environment e) Improve the classic HPC environments as Pilot Jobs do for task-based
execution models.
f) Add modules to existing frameworks like Scikit-Learn or Tensorflow either as new capability or as a higher performance version of existing modules.
We have over the last 8 years explored all these approaches but focus this paper on b) c) and e).
4.2.SPIDAL Parallel Data Analytics Library
[image:20.595.122.477.599.725.2]The table below lists 34 Core Machine Learning Algorithms implemented in different frameworks with our work in the first two columns. We are packaging these as described in the following section 4.3. SPIDAL also includes community-specific data analytics.
Table 1: 34 Core Machine Learning Algorithms and status in 11 Libraries
SPIDAL Harp-DAAL Intel DAAL Mahout Spark Flink Turi Petuum DMTK H2O ANGEL
K-means ✓ ✓ ✓ ✓ ✓ ✓ ✓ ✓ ✓ ✓
MF-SGD ✓ ✓ ✓ ✓ ✓
Implicit-ALS ✓ ✓ ✓ ✓ ✓ ✓ ✓
Neural Network ✓ ✓ ✓ ✓ ✓ ✓
SVD ✓ ✓ ✓ ✓ ✓
QR ✓ ✓ ✓ ✓
Covariance ✓ ✓ ✓
Linear regression ✓ ✓ ✓ ✓ ✓ ✓
Lasso Regression ✓ ✓
logistic Regression ✓ ✓ ✓ ✓ ✓ ✓
Ridge Regression ✓ ✓ ✓
Moments ✓ ✓ ✓
Naive Bayes ✓ ✓ ✓ ✓ ✓ ✓
Association Rules ✓ ✓ ✓ ✓
Decision Forest ✓ ✓ ✓
K nearest neighbor ✓ ✓ ✓
Outlier Detection ✓ ✓
SVM ✓ ✓ ✓ ✓ ✓
Random Forest ✓ ✓ ✓ ✓ ✓
Distance Metric
Learning ✓ ✓
LDA ✓ ✓ ✓ ✓ ✓ ✓ ✓
GBM (Generalized
Linear Modeling) ✓ ✓ ✓
Multiverso ✓ ✓
GLM (Generalized
Linear Modeling) ✓ ✓
GLRM (Generalized
Low Rank Models) ✓ ✓
Stacked Ensembles ✓ ✓
GBDT (Gradient Boost
Decision Tree) ✓ ✓
Multidimensional
Scaling (MDS) ✓
DA-MDS (Deterministic
Annealing-MDS) ✓
Force-Directed Graph
Drawing ✓
Irregular DAVS
Clustering ✓
Determ. Annealing
Semimetric Cluster ✓
4.3.Image Processing and Optimization Library and Tutorial
Cheap image sensors, fast networks, and massive storage have made it feasible to collect large-scale collections of images of various types, from photographs on social media sites to remote sensing images taken by radar and satellites, to medical images from x-ray, microscopy, and CT. But while large image datasets can now
be easily collected,
processing them to automatically extract useful analytics --- identifying
objects in the photos,
reconstructing properties of the original scenes, segmenting
images into different
semantic
components --- is still a very open problem, attracting a large amount of research across a wide range of fields. All of this activity is, of course, very good for the development of new techniques, but we have observed a large amount of duplication. Scientists and engineers regularly “re-discover” techniques for solving their problems, not realizing that similar problems have already been solved in another community. Not only does this lead to wasted effort, but it means that the customized solutions developed for one particular application may not take advantage of the most advanced theories and implementations from the existing community.
[image:22.595.127.476.155.200.2]We have identified and developed a library of optimization and image processing techniques that we believe are foundational to a wide range of problems and
applications. The basic philosophy underlying this approach is that many problems in AI-related domains (including machine learning, image understanding, computer vision, etc.) can be posed and solved using one of a relatively small number of general techniques. Instead of re-inventing algorithms that are customized for a particular application, we advocate posing new problems in terms of general and abstract techniques. For example, many problems involving analyzing sequences can be posed as Hidden Markov Models, whether the sequences are sentences, positions of objects across time, audio signals, or protein sequences.
Fig. 4.2: Snapshot of (Hidden Markov) Models section of SPIDAL Machine Learning & Image Processing website showing descriptions and one of the videos.
implementation is one particular set of source codes for executing an algorithm. Implementations may use heuristics or simplifications to improve practical results or decrease the running time of an algorithm.
This seemingly obvious decoupling of applications, algorithms, models, and implementations can nonetheless be very powerful, because countless applications can be posed in terms of existing models, and new models can be solved with existing algorithms. The models implemented in the library are very general, including sequence model (e.g., Hidden Markov Models), spatial models (Markov Random Fields), classification models (e.g., Nearest Neighbor), feature models (e.g., bag of words, image interest points), etc. The various algorithms can optimize various of these models, each with different trade-offs on the accuracy, running time, and assumptions. For example, implementations of several solvers for Markov Random Field (MRF) models are available, including Markov Chain Monte Carlo (MCMC) which can approximately solve for marginal distributions of MRF variables, Loopy Belief Propagation, which can approximately find Maximum A Posteriori (MAP) solutions to MRFs, and Tree-Reweighted Message Passing (TRW-S), which is also approximate but can offer bounds on accuracy. Other algorithms include the Viterbi algorithm and Forward-Backward for optimization on Hidden Markov Models, Deterministic Simulated Annealing for continuous optimization problems, K-means, Mean-shift, and MultiDimensional Scaling algorithms for clustering and dimensionality reduction, Scale Invariant Feature Transforms for image feature extraction, etc.
Our library tries to remove two major barriers for domain scientists to apply these models and algorithms to their problems. First, we provide implementations of these algorithms so that domain scientists can reuse or modify our implementations instead of starting from scratch. Second, and perhaps even more importantly, we try to help domain scientists pose novel problems in terms of these existing algorithms and models. To do this, we have developed a documentation and tutorial website [73] (see Fig. 4.1) that provides practical information about how the models and algorithms work, which types of problems to apply them on, and which assumptions they make, and so on. We believe this conceptual information may be just as important as documentation about the library routines themselves: the major barrier to applying known models and algorithms is simply not knowing that they exist. The tutorials include slides, videos, links to other references, and source code hosted in GitHub (Fig. 4.2). The tutorial can be used in different ways, including browsing a collection of exemplar applications to see how various routines are combined and applied to particular problems, browsing the selection of Models, browsing the selection of Algorithms, and exploring based on problem type.
4.4.End-to-End Examples of Community Applications with SPIDAL Technologies
4.4.1.Evaluation of task-parallel frameworks for Biomolecular Simulations
Figure 4-3. The architecture of the Task-parallel data analytics frameworks RADICAL-Pilot, Spark, and
Dask, which were evaluated for their suitability for supporting analysis of biomolecular simulations.
Figure 4-4 Path similarity analysis with the Hausdorff distance δH(P,Q) between trajectories P and Q,
consisting of coordinate frames p and q. Strong scaling was studied for 4 different frameworks on SDSC XSEDE facility Comet for N=128 trajectories resulting in 8128 Hausdorff distance calculations.[76]
[image:25.595.120.472.337.654.2]two trajectories, and leaflet identification (LeafletFinder) [78], which is used to identify which lipids belong to one of two layers (leaflets) of a lipid bilayer membrane. Both algorithms are part of the MDAnalysis library [78], [79], which abstracts access to all common trajectory formats inside a Python interface and includes many commonly used analysis algorithms. They exemplify different types of algorithms that are typical in this field. PSA is embarrassingly parallel, whereas LeafletFinder consists of multiple stages that involve distance search for a nearest neighbor graph construction and computation of the connected components of the graph. For the embarrassingly parallel PSA problem, the three task parallel frameworks perform equally well and very similar to an MPI-based solution (implemented with MPI4py), with an example shown in Fig. 4-4.
Figure 4-5 Image A from [78] illustrates the LeafletFinder algorithm with B from [78] giving result for
Both the absolute runtime and the strong scaling behavior up to 256 cores are very similar across different machines and data sets of different sizes. For the leaflet identification, four novel different parallel algorithms were implemented [76] and tested (Fig. 4-5). On balance, a map-reduce algorithm with 2D partitioning of the data with a tree-search for the edge discovery combined with partial calculation of connected components performed best across the tested frameworks. The MPI implementation performed best with close to ideal scaling on up to 256 cores (see [76] for the data). Spark was also able to handle large amounts of data well, whereas Dask performed better than Spark for intermediate problem sizes.
Spark, Dask, and RADICAL-Pilot are all suitable for the implementation of these algorithms. For embarrassingly parallel applications, the choice of the framework does not strongly affect the performance. For applications with fine-grained data parallelism, a BigData framework such as Spark and Dask outperforms RADICAL-pilot because of their focus on supporting many short-running tasks. With increasing task communication requirements, using Spark becomes advantageous, and gets close to the performance of MPI. Although the MPI-based implementation always outperformed the task-parallel frameworks, the task-parallel frameworks performed well with good scaling capabilities and in particular, provided a high-level API that makes the implementation of scalable solutions for complex algorithms straightforward. Thus users might nevertheless consider the task-parallel frameworks for their ease of use (especially Dask), provision of high-level abstractions (Spark and Dask), or ease of interoperability with native code (RADICAL-pilot and Dask with Python, Spark with Java).
[image:27.595.126.471.464.654.2]4.4.2.New algorithms and production-grade implementations for Biomolecular Simulations
Figure 4-6 Path Similarity Analysis [76] with Hausdorff distance implemented in cpptraj [80]. The algorithm was benchmarked with an ensemble of 128 trajectories for different compilers and ran on up to 240 cores with MPI.
package [80], [81], which is written in C++ and uses OpenMP and MPI parallelism. As shown in Fig. 4-6, the performance is excellent [76]. The Hausdorff distance implementation is built on the “2D RMSD” code in cpptraj and only required small additional code changes to make PSA available to the wider cpptraj user community.
The lessons learned during the framework evaluation and our earlier work on parallel trajectory analysis with Dask [82] motivated us to create a new Python-based library for parallel trajectory analysis, named PMDA [83]. PMDA provides a simple API to write parallel trajectory analysis with MDAnalysis by using simple decorators and base classes to leverage existing code in MDAnalysis. The library is still young but important functions such as root mean square distance after optimum structural superposition (RMSD), contact analysis, and radial distribution function are already implemented; the new parallel Hausdorff distance and the tree-based parallel LeafletFinder algorithms from [76] were also implemented in PMDA and are thus are made available to a broad audience.
4.4.3.Identifying and overcoming barriers to progress in Biomolecular Simulations: I/O in parallel trajectory analysis
[image:28.595.127.471.443.549.2]Our earlier work [82] demonstrated that good performance and scaling could be obtained with a simple MapReduce approach for parallel trajectory analysis (implemented with MPI4py and MDAnalysis) on a single node; however, our approach did not scale beyond a single node (e.g., 72 cores (3 nodes) on SDSC Comet, as shown in Figure 4-7) because a few MPI ranks took much longer to complete than the majority of the ranks (Figure 4-7C).
Figure 4-7. Performance [82] of parallel trajectory analysis (RMSD calculation) with serial file access on SDSC Comet. A) Strong Scaling (the total time to completion as a function of the number of processes with one process per core); runs were repeated 5 times, and mean plus standard deviation are shown. Speedup of data in A with ideal scaling indicated by the dashed line in B. Image C shows representative timings of particular MPI ranks up to 72 cores.
The time for reading frames from the trajectory on the shared Lustre file system into memory (I/O time) and the time for communicating results back to rank 0 with MPI.gather() (communication time) fluctuate strongly whereas the time for the actual computation is comparatively small and constant across ranks. This suggested that accessing a trajectory file, which resides on a shared Lustre file system, from multiple ranks might degrade performance.
The trajectory in the XTC format (produced by the widely used Gromacs package [84]) is natively read by MDAnalysis [79] using the standard C fopen() call to read the trajectory file. We tested instead parallel MPI-I/O as implemented in the parallel HDF5 library for the HDF5 format. For this proof of concept, we converted the XTC trajectory to HDF5 because even though HDF5 is not widely used in the biomolecular simulation field is one of the few used formats
that directly supports
[image:29.595.127.340.158.363.2]integration with MPI-I/O. Employing MPI-I/O resulted in excellent performance and near-ideal scaling up to 8 nodes (196 cores; see Figure 4-9. The fluctuation in I/O time was minimal, and communication time became negligible (Figure 4-9C). Similar results were also obtained when an XTC trajectory was pre-processed into separate files (“subfiling”), one for each MPI rank, and each MPI rank only read its own file. The latter approach is somewhat cumbersome but can be mitigated by employing a facility in MDAnalysis to read multiple files as a single continuous trajectory. Nevertheless, these initial results indicate that in order to realize the advantages of data analytics on HPC for biomolecular simulations, the trajectory I/O has to be handled carefully.
[image:29.595.131.475.510.614.2]Fig 4-9 Performance of parallel trajectory analysis (RMSD calculation) with parallel HDF5 file access on SDSC Comet. A and B are strong scaling and speedup as in fig. 4-7B. Image C shows representative timings of particular MPI ranks up to 8 nodes (196 cores).
4.4.4.Polar Science as an Application
As a specific example, the polar remote sensing community is interested in 2D and 3D radar echogram layer and interface tracking of continent-scale ice sheets. Ice sheets are layered depositions which generally flow outward to the margins where ice is removed through calving and melting. Because of the dielectric contrast at the layers and ice interfaces, ground penetrating radars are used to locate the interfaces at the top and bottom of the ice sheet and to detect the internal layer structure. Tracking the top and bottom interfaces of the ice sheet provides essential boundary conditions for realistic ice sheet modeling and is used in ice flux calculations for sea level rise assessments. Tracking the isochronous internal layers allows inference of other useful ice properties (e.g., accumulation rates and basal melting) and can be used to constrain or test the models.
The Viterbi and TRW-S algorithms have been implemented in the open source CReSIS [85] software toolbox [86], which also includes the full processing pipeline from raw data to data product delivery. The algorithms and parameter tuning operations run in parallel and are implemented for several standard computer cluster interfaces (e.g., Torque, Slurm, and Matlab). These algorithms are now in use on a routine basis for tracking the ice bottom [87], [88][57], [89], [90]. The underlying signal processing algorithms have also been improved to produce better image intensity inputs for tracking [91], [92][93].
The data products using the image tracker on 2D data are available at the National Snow, and Ice Data Center [94] for 2016 onwards and the 3D image tracking results are available from the CReSIS data distribution site [95]. An example showing digital elevation models (DEM) of the ice bottom produced from the layer tracking of 3D images is shown in Fig. 4.10 from a mountainous region in the Agassiz Ice Cap. Two DEMs from crossing flight lines are shown. The overlapped portion allows us to test the self-consistency of the DEM generation and the error map based on the difference between the DEMs is shown in the inset.
[image:30.595.124.466.194.440.2]Overlap Region Flight Tracks 1 km Canadian Archipelagos Ice Caps 800 1000 1200 1400 1600 1800 El evati on (m ) -100 0 100 Error (m)
4.4.5.Network Science Applications
Figure 4-11. A Significant under-immunized cluster found using our network scan statistics approach. The
cluster covers the rural blocks west of Minneapolis.
We now discuss an application of our subgraph analysis tools for disease surveillance, which is an important issue in public health. Clusters of under-vaccinated children are emerging in a number of states in the United States due to rising rates of vaccine hesitancy and refusal. As recent outbreaks of diseases such as measles have shown, such clusters can pose a significant public health risk. Such clusters can be used in the epidemiological analysis to determine the risk of outbreaks.
Spatial scan statistics provides a rigorous method for identifying statistically significant clusters. The standard use of this approach (using the SatScan software) involves scanning the entire region using a circular shaped window to find a cluster that optimizes a maximum likelihood objective; this has been extended to other shapes, such as ellipses. However, because of the restriction in shapes, this approach does not find high resolution irregularly shaped regions—if “real” clusters do not have the prescribed shape, SatScan will miss them or only partially catch them.
statistic, and find clusters which are more refined, and have a much higher statistical significance, compared to those calculated using SatScan. Figure 4-11 shows an example of such a cluster we find for Minneapolis.
[image:32.595.122.478.233.559.2]4.4.6.Analysis of Fungal Data from IUB Biology department
Figure 4-12. Fungi gene sequence data clustered into 65 clusters visualized in 3D space. This is a 2D projection of the 3D dimension reduced visualization.
Identifying structures and patterns in data sets is an important step when analyzing biological data, such as gene sequence data. Correctly identifying and specifying clusters or groups can provide meaningful insights that are not easily captured through the observation of raw data. The difficulty of identifying such clusters increases with the dimensionality of the data set. Therefore, analyzing high dimensional data requires algorithms that can handle high dimensional data for both dimension reduction, as provided through MDS and clustering as provided through SPIDAL/DA-PWC.
roughly 170k unique sequences which occurred more than once within the dataset. DA-PWC was applied iteratively to the 170k dataset, at each iteration, the resulting clusters were visualized by generating 3D data points using DA-MDS and using WebPlotViz [96], [97] to visualize the results.
Visualized results were used to identify and select cluster groups which were to be broken down into sub-clusters in the subsequent iterations. All the visualization steps and managing the workflow between iterations were done through an interactive script which took user inputs after each iteration. Figure 4-12 shows the resulting clusters, visualized in 3D space using WebPlotViz. It is also noteworthy that this method produced superior results when compared to USEARCH (8472 clusters detected) and SWARM (1454 clusters detected) clustering, both of which produced a large number of small insignificant clusters which consisted of just a few (<10) data points.
Additionally, previous research work in collaboration with the IU Biology department and other institutions applied SPIDAL library technologies for various biology data analysis tasks. In [98], [99] SPIDAL technologies were used to analyze rRNA gene sequence structures. In [100] DA-MDS was utilized in order to visualize the Protein Sequence Universe
[image:33.595.128.441.376.663.2]4.4.7.Pathology and Spatial Analytics for Brain Tumor Microenvironment Studies Glioblastoma (GBM; WHO grade IV) is the most common brain tumor that presents an aggressive clinical progression to death with a more than 90% five-year mortality. The explosive growth properties of GBM contrast sharply with lower grade gliomas (grades II and III). However, the underlying reasons accountable for this abruptly accelerated tumor growth phase are poorly understood. As a result, GBM therapies remain limited in number and efficacy, attributing to a median survival of 12.6 months. Well recognized by domain experts, no current therapy option provides ideal treatment effect due in large part to the limited analysis vehicles to comprehensively and accurately understand GBM histopathology, pathophysiology, and heterogeneity in the context of the tumor microenvironment (TME). Therefore, a thorough and quantitative characterization of GBM TME promoting rapid GBM progression from both histological, and spatially targeted
molecular perspective is the key to create new avenues for novel therapy design and better clinical decision support.
For precise characterizations of genetic, molecular, tissue morphology and clinical biomarkers, the morphological, spatial, and pathophysiological features and interactions of major components in GBM tumor microenvironment require accurate and quantitative analysis support. Structural and morphological features derived from histopathology analysis of the tissue space (in particular, the 3D space) provides rich information of microanatomic objects to understand the tumor microenvironment of GBM. Our work illustrated in fig 4-13, includes reconstructing pathologic objects (vessels and cells) for accurate spatial structure representations, and spatial analytics to characterize 3D spatial patterns of diseases and determine clinical prediction values of their spatial and morphologic features [101].
5.COMPARISON WITH RELATED WORK
5.1.Related work for data analytics and HPC
HPC systems are not able to sustain high I/O rates, which are important for processing the growing datasets. Xuan et al. [102], proposed and developed a new two-level storage system which manages to achieve higher aggregated throughput rates compared to the state-of-the-art. The researchers integrated Tachyon, an in-memory file system with OrangeFS, a parallel file system. The main motivation for using an in-memory file system is that HPC systems often have large memories at each node and they can have a storage capacity comparable to local storage-based HDFS. Moreover, the I/O throughputs of in-memory file systems are much larger than those of local disk. Meanwhile, the parallel file system provides data-fault tolerance and large storage capacity. Therefore this framework combines the best of two worlds. A similar approach to the two-level storage has been proposed in [103]. Their goal is to increase the I/O Performance of Big Data Analytics on HPC Clusters through RDMA-based key-value store. They designed a burst buffer system using RDMA-based Memcached and present three schemes to integrate HDFS with Lustre through this buffer layer. They manage to achieve higher I/O throughput rates by RDMA-based key-value. The reason that they use a key-value store for buffering HDFS I/O on top of the parallel file system is that key-value stores provide flexible APIs to store the HDFS data packets against corresponding block names. Many efforts have been developed to improve the I/O bottleneck of the HPC systems. Researchers have developed the VSFS system [104], which uses a DRAM-based distributed architecture to perform real-time file indexing. Moreover, a versatile index scheme is designed to adapt to the various forms of HPC datasets. The results of our VSFS prototype evaluation show that VSFS is scalable in a typical HPC environment. It achieves significantly better file-indexing and file-search performance than the popular SQL/NoSQL solutions, while it only introduces negligible I/O overhead and has also been tested in real time scenarios with success.
subscribers, the latency of reading/writing data is increasing, and sometimes the overhead makes it pointless to execute the computations on the compute node.
5.2.Related Work on Communications optimization with HPC and big data
There are fundamental differences between HPC communication as in MPI and data communications required by big data applications. Some of these have been addressed in DataMPI [106], which creates a shuffle engine using MPI primitives. Twister2 tries to identify some of these differences and creates a library called Twister:Net [27], which tries to provide a more generic communication model for data analyses. Exploiting high performance interconnects for data analytics have been studied extensively with HDFS RDMA [107], Spark RDMA [108], Heron Infiniband [109]. In all these instances, existing communication layer of big data tools have been enhanced with high performance interconnects. Recently there have been efforts to implement data operations such as joins using RDMA [110], [111]. Mpignite [112] is an effort to include MPI style communications into the Spark big data framework to improve its collective communication capability.
5.3.Network Science Related Work - Random network generation
A number of random graph models have been developed in an attempt to model different kinds of real-world network data. Efficient parallel generators exist for many of them. For instance, the generator in the Graph 500 benchmark [113] can generate very large instances of the RMAT model [114]. The RMAT model has a simple recursive structure, which makes random generation relatively easy. This is not the case for other stochastic models, such as the Chung Lu (CL), Preferential Attachment (PA) model [115], Stochastic block model (SBM) and block two–level Erdos–Renyi (BTER) models [116]. These models have a more complicated probability structure and a high level of heterogeneity in their degree sequences. Parallel algorithms have been developed for generating instances from these models in both distributed memory systems [44] and MapReduce [116]. The preferential attachment model has a very different structure from the other random graph models–––it is an evolutionary model, where edges are added incrementally. Our results in [117] provide a distributed memory parallel algorithm for this model, by exploiting a different but equivalent representation of the PA model. There has been very little work on the second approach of random graph generation through edge switching, and the work of [45] is the first parallel algorithm for this problem.
5.4.Network Science Related Work - Subgraph analysis
There is a vast literature on a variety of subgraph analysis problems, arising out of a number of applications, such as bioinformatics, security, social network analysis, epidemiology, and finance. Here, we focus on the area of subgraph detection and counting, specifically, triangles, paths, and trees, since there has been quite a bit of work on parallel algorithms for these problems.
These have considered exact counts, as well as deterministic and randomized approximation, e.g., using sampling techniques [121]. In [120], we develop an MPI-based algorithm for exact counting, in the setting where the memory of each machine is large enough to contain the entire network, by dynamic load balancing and tuning task granularity on the fly.
In contrast, the detection and counting of paths and trees are inherently non-local problems. While there are a number of heuristics for these problems, one of the most well-studied methods is based on using the color-coding technique for finding tree-like subgraphs [122], which guarantees a fully polynomial time approximation to the number of embeddings with running time and space, scaling as O((2e)k) and O(2k), respectively (with additional terms which are polynomial in the input size). This has been parallelized using MapReduce [123] and OpenMP [124], enabling subgraph counting in graphs with tens of millions of nodes with rigorous guarantees. Slota et al. use threading and techniques for reducing the memory footprint of the color coding dynamic programming tables in order to scale. In [34], [125], we have used the Harp framework to significantly improve the performance of color coding. Finally, in [46], we have developed a new parallel approach for subgraph detection using an algebraic technique.
5.5.Molecular Dynamics Trajectory Data Analysis Related work
Until recently, MD analysis algorithms were executed serially. In the past several years, new frameworks emerged, providing parallel algorithms for analyzing MD trajectories. HiMach [126], by the D. E. Shaw Research group, extends Google's MapReduce for parallel trajectory data analysis. Pteros-2.0 [127] is an open-source library used for modeling and analyzing MD trajectories. Pteros 2.0 parallelizes execution via OpenMP and multithreading, bounding the execution to a single node. MDTraj [128] is a Python package for analyzing MD trajectories, in which parallelization is implemented using the parallel package of IPython as a wrapper. nMoldyn-3 [129] parallelizes the execution through a Master-Worker architecture. The master defines analysis tasks and submits them to a task manager. The task manager distributes tasks to workers.
In contrast, our approach utilizes more general-purpose frameworks for parallelization, such as RADICAL-Pilot, Spark, and Dask. These frameworks provide higher level abstractions, so any integration with other data analysis methods can be fast and easier. Data parallelization can be done on any level of the execution, not only via data-read instructions. In addition, resource acquisition and management are performed transparently. Finally, because these frameworks do not require any compilation before usage, we avoided any hard dependencies that might exist due to the underlying hardware.
5.6.Polar Science Radar Informatics Related work
uncertainty and combining weak sources of evidence [52]–[54], [136]. These techniques can also incorporate additional external sources of evidence, such as sparse human annotations or information from digital elevation maps. More recently, deep machine learning has produced significantly better results due to deep neural networks’ ability to learn optimal low-level image features from large-scale training data [55], [137],
5.7.Pathology Image Analysis Related work
Radiology image registration is a matured research field with methods broadly categorized into point-, landmark-, surface-, rigid model- Deformable model-, statistical moment-, and image correlation-based registration [138]–[141]. Also, the multi-resolution and multi-scale approaches are developed [142]–[145]. However, these methods can not be directly applied to pathology image registration. Pathology image registration presents its unique challenges due to the overwhelmingly large data scale, a massive number of objects, and large tissue variations. Most prevalent pathology image processing approaches are bounded by 2D phenotypic structure analysis, with limited capacity for processing 3D pathologic objects in imaging volumes. Although some methods have been developed to process 3D pathology imaging data, they only focus on one processing step with no complete 3D analysis pipeline presented [146]–[156]. In spite of the availability of some commercial software for 3D pathology imaging analysis [157]–[160], they are still in immature stages.
5.8.Spatial Data Management and Queries Related work
Spatial Database Management Systems (SDBMSs) have been developed for managing and querying 3D spatial data in industrial applications, such as OracleSpatial [161], MapInfo Discover 3D [162], and ESRI 3D GIS [163]. However, they have limited scalability as they are built on top of ORDBMS, and come with limited 3D geometry support. Data loading is also a major bottleneck for SDBMS based solutions, especially for scale datasets. Recently, several systems have been proposed to support large-scale spatial queries with distributed computing resources using MapReduce [164]– [168]. These systems come with their limitations, for example, Spark based spatial querying systems will suffer the out-of-memory problem, and none of them support 3D data types.
6.CONCLUSION AND FUTURES
![Figure 1-1; 64 Convergence Diamonds [11] Building on Big Data Ogres](https://thumb-us.123doks.com/thumbv2/123dok_us/8127656.241356/4.595.134.471.159.626/figure-convergence-diamonds-building-big-data-ogres.webp)
![Figure 2-4: Architecture of Twister2. [26], [27]](https://thumb-us.123doks.com/thumbv2/123dok_us/8127656.241356/9.595.143.455.180.573/figure-architecture-of-twister.webp)
![Fig 3-1 Performance of our network generation algorithm (DG) [40], compared with a prior method (denoted by AK): (a) strong scaling, (b) load balancing across processors](https://thumb-us.123doks.com/thumbv2/123dok_us/8127656.241356/11.595.127.464.255.325/performance-network-generation-algorithm-compared-scaling-balancing-processors.webp)
![Figure 3-2. XSEDE SUs by research field for the time interval 2011-07-01 to 2017-09-30 [51]](https://thumb-us.123doks.com/thumbv2/123dok_us/8127656.241356/13.595.166.427.285.485/figure-xsede-sus-research-field-time-interval.webp)