International Journal of Innovative Technology and Exploring Engineering (IJITEE) ISSN: 2278-3075, Volume-9 Issue-1, November 2019
Abstract: Outlier detection is an interesting research area in machine learning. With the recently emergent tools and varied applications, the attention of outlier recognition is growing significantly. Recently, a significant number of outlier detection approaches have been observed and effectively applied in a wide range of fields, comprising medical health, credit card fraud and intrusion detection. They can be utilized for conservative data analysis. However, Outlier recognition aims to discover sequence in data that do not conform to estimated performance. In this paper, we presented a statistical approach called Z-score method for outlier recognition in high-dimensional data. Z-scores is a novel method for deciding distant data based on data positions on charts. The projected method is computationally fast and robust to outliers’ recognition. A comparative Analysis with extant methods is implemented with high dimensional datasets. Exploratory outcomes determines an enhanced accomplishment, efficiency and effectiveness of our projected methods.
Keywords: Outliers, Ionosphere, Z-score Method, Clusters, High Dimensional Data.
I. INTRODUCTION
An outlier is designated as a data point that is very different from the respite of the data based on certain estimation. Such an attribute frequently hold beneficial information on anomalous functioning of the structure defined by the data. Anomaly detection is a significant analysis in data mining that derives the items that are extensively different, incomparable and unpredictable with respect to the large data in an input databank. In current years, we have observed an incredible study concern sparked by the eruption of data composed and transmitted in the form of streams. This constitute new prospects as well as difficult tasks for research exertions in outlier recognition.
Outlier detection shows an extreme part in many areas, such as, pattern classification grouping, and decision-making, due to the fact that it can disclose rare but essential circumstance, and find interesting /unpredicted data items. At present, anomaly recognition one of the essential challenge in data mining, and has variety of practical application areas like Intrusion Detection, Medical and Public Health, Mobile phone Fraud Recognition, Fraud Detection, Credit Card fraud Recognition, Insurance, Trading, Structural Defect
Revised Manuscript Received on October05, 2019 * Correspondence Author
PeruriVenkataanusha*, Research Schholar, Dept of CSE, Acharya Nagarjuna University, NagarjunaNagar, India.
Ch.Anuradha, Assistant professor, Dept of CSE, VRSEC, Vijayawada Dr. Patnala S.R. Chandra Murty, Research Supervisor,Dept of CSE, Acharya Nagarajuna University.
Dr. Surya Kian Chebrolu, Associate Professor, Dept of CSE, NRI Institute of technology.
Detection, Fault Detection in Mechanical Units, Industrial Damage Detection, Text data detection, Image Processing etc. In this paper, we presented a statistical approach called Z-score method for outlier detection in high-dimensional data using. Z-scores is a novel method for estimating distant data based on data positions on charts. The projected method is computationally fast and robust to outliers’ recognition. The organization of this article is as follows: Segment 2 covers earlier research in outlier recognition. In Segment 3, we present our outlier detection methodology. Segment 4 covers our experimental results, followed by our summary in Segment 5.
II. RELATEDWORK
Various techniques have been projected in current centuries for anomaly, but in order to handle anomalies in high dimensional data, they are not particularly considered as novel approaches. There are numerous works that are stated from the literature survey. All those works are broadly considered as: Clustering and Density-based, Statistical/Model-based, Distance-based methodologies and other methodologies for mixed-type attribute and categorical data. The subsequent segment gives a concise interpretation on outlier detection.
Angiulli et al. [8] estimate k-NN samples using a Hilbert Space Filling Curve, Moreover this technique needs correctly p+1 (where p is the dataset length) scans out of 39 datasets, also this procedure is restriction for high-dimensional and distributed dataset. This method is applied effectively to density-based approaches with some restrictions. The dataset utilized in approach contains mixed attribute that cover anomalies, Distance-based techniques fail to estimate anomalies based on global anomaly criterion. In Knorr et al. [10] work, projected a k-NN method, within the specified length, p nearest neighbors are considered as not an anomaly points. In the next article, if the data point is considered as anomaly if it is p% far from the specified length. Projected approaches increases the complexity exploration and practically it is difficult to applying for large datasets.
J. Branch et al. [6] projected an anomaly recognition technique using the concept of Entropy estimate. The entropy cut-off for each entity is estimated based on the disruption of rest of data entities. The author utilized k-scans dataset to estimate k-anomalies. Projected procedure is secure contrast to Local Search Algorithm (LSA). Automatic detection of optimal no of anomalies is not possible with this approach. Branch interested this article to originate BAD score procedure. Koufakou et al. [9] projected Attribute Value Frequency (AVF). AVF cut-off for
every record is estimated through
Detecting Outliers in High Dimensional Data
Sets Using Z-Score Methodology
def outliers_Z_value (xs): cut-off value = 3 mean_x = np.mean (xs) sdev_x = np.std (xs)
z_score = [(x-mean_x) / sdev_x for x in xs return mv.where (mv.xys (z_value)>cut-off value
single scan of entire dataset and it is easiest task also. The accurateness and complexity exploration is good in contrast with other systems and also it generates many problems. This article is base for many investigation works. Latecki et al. [3] projected and estimated strong local density circumstance using nonparametric anomaly recognition method with movable kernel. Projected article is a shade improved contrast to the procedures LOF and LOCI that are derived based on local anomaly circumstance. This approach is better contrast to existing approaches but is not be virtuous for large datasets of more no of archives and elements.
Timothy de Vries et al. [2] projected an innovative methodology called Projection Indexed Nearest Neighbors (PINN) and calculating the extended nearest neighbor sets to get precise value in KNN distances. They enhanced the Local Outlier Factor (LOF). Though this method is derivative for discovering local anomalies in image database, it can also be utilized for our categorical dataset. This method is applied huge datasets with less no of dimensional. Acuna et al [4] equated the distinct anomaly methods with data mining approaches statistical based method, and clustering techniques. Due to removing of anomalies in some circumstances that leads to a mislaying of data. Particularly in data classification scenario, elimination of necessary data leads to major anomalies problems.
III. Z-SCOREMETHODOLOGYFOROUTLIER
DETECTION
The Z-score method is a system of representing abnormal behavior items in terms of its association with the standard deviation and mean of a collection of arguments. Estimating the Z-score is just plotting the items into a scattering diagram, standard deviation and mean is indicating as 0 and 1. The objective of estimating Z-scores is to eliminate the properties of the position and scale of the data points, permitting dissimilar datasets to be associated exactly. The principle used by Z-score technique for anomaly recognition is that, after plotting the data items in the scattering diagram, the items those are far from the value zero is considered as anomaly. The process of detecting anomalies can be stated in the subsequent code:
The following step by step procedure shows detection of outliers in high dimensional datasets using z-score method: Step 1: Null Hypothesis: There is no significance discrepancy between the standard deviation and mean of data items.
H 0: μ 1 = μ 2
Step 2: Alternative Hypothesis: There is significance discrepancy between the standard deviation and mean of data items.
H 1: μ 1 ≠ μ 2
Step 3: Level of significance: The level of significance is denoted with
α =0.001 (or) α =0.005
Step 4: Test Statistics: The test statistics for outlier detection is given by
Z =
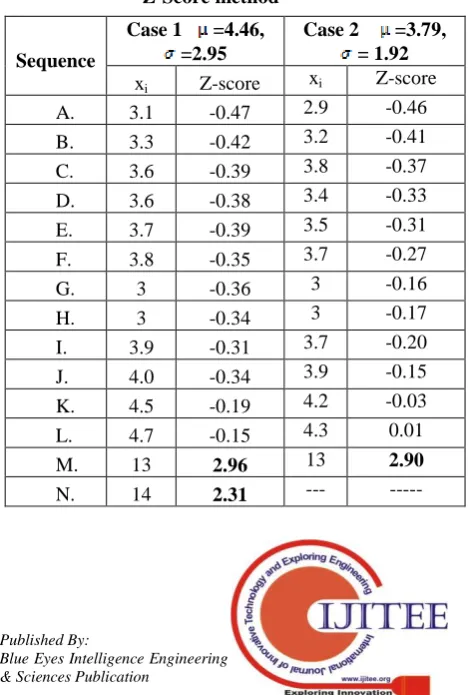
[image:2.595.305.552.191.366.2]Step 5: Critical Region: At position, we are determining whether data points are outliers are or nor as revealed in figure1:
Figure 1: Critical Region
In this process we compute the z-score for each reflection (fix this). If the estimated z-score is > 3 or < -3 is considered an anomaly. From practical rule, all of the data i.e 99.7% should be within 3σs from the mean. By computing the z-score, observations are arranged in proper order, now the value of standard deviation is one. Thus from the practical rule we expect 99.7% of the estimated z-scores within -3 and 3. Table 1 shows calculation and covering problem of the Z-Score technique using sample dataset.
Table 1:Calculation and covering problem of the Z-Score method
Sequence
Case 1 =4.46, =2.95
Case 2 =3.79, = 1.92
xi Z-score xi Z-score
A. 3.1 -0.47 2.9 -0.46
B. 3.3 -0.42 3.2 -0.41
C. 3.6 -0.39 3.8 -0.37
D. 3.6 -0.38 3.4 -0.33
E. 3.7 -0.39 3.5 -0.31
F. 3.8 -0.35 3.7 -0.27
G. 3 -0.36 3 -0.16
H. 3 -0.34 3 -0.17
I. 3.9 -0.31 3.7 -0.20
J. 4.0 -0.34 3.9 -0.15
K. 4.5 -0.19 4.2 -0.03
L. 4.7 -0.15 4.3 0.01
M. 13 2.96 13 2.90
[image:2.595.321.556.491.839.2]International Journal of Innovative Technology and Exploring Engineering (IJITEE) ISSN: 2278-3075, Volume-9 Issue-1, November 2019
For case 1, with all of the sample data comprised, it seems that the values 13 and 14 are outliers, yet no observation outstrips the unconditional data of 3. For case 2, with the most risky data, 14, among example data omitted, 13 is measured an outlier. This is because multiple risky values have preciously overestimated standard deviations.
IV. EMPIRICALRESULTS
In the outlier detection experimentations, the Ionosphere data set is used to testify the enactment of projected method.
[image:3.595.56.307.623.762.2]The dataset is accessible from 3 sources shown as follows: UCI Repository, ELKI Datasets and KEEL Datasets. It is a binary classifying databank with dimensionality 34. At particular point, having values all 0s, that is rejected. The total quantity of measurements are 33. The 'good' class is marked as’ inliers and the 'bad' class as outliers. Sample Ionosphere dataset for Outlier Detection Using Z-score method is shown in table 2:
Table 2:Sample Ionosphere dataset for Outlier Detection Using Z-Score method
Pul1 Pul2 Pul3 Pul4 Pul5 Pul6 Pul7 Pul8 Pul9 class
1 0 0.99539 -0.05889 0.85243 0.02306 0.83398 -0.37708 1 g
1 0 1 -0.18829 0.93035 -0.36156 -0.10868 -0.93597 1 b
1 0 1 -0.03365 1 0.00485 1 -0.12062 0.88965 g
1 0 1 -0.45161 1 1 0.71216 -1 0 b
1 0 1 -0.02401 0.9414 0.06531 0.92106 -0.23255 0.77152 g
1 0 0.02337 -0.00592 -0.09924 -0.11949 -0.00763 -0.11824 0.14706 b
1 0 0.97588 -0.10602 0.94601 -0.208 0.92806 -0.2835 0.85996 g
0 0 0 0 0 0 1 -1 0 b
1 0 0.96355 -0.07198 1 -0.14333 1 -0.21313 1 g
1 0 -0.01864 -0.08459 0 0 0 0 0.1147 b
1 0 1 0.06655 1 -0.18388 1 -0.2732 1 g
1 0 1 -0.5421 1 -1 1 -1 1 b
1 0 1 -0.16316 1 -0.10169 0.99999 -0.15197 1 g
1 0 1 -0.86701 1 0.2228 0.85492 -0.39896 1 b
1 0 1 0.0738 1 0.0342 1 -0.05563 1 g
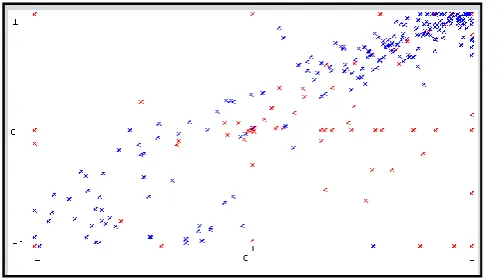
Figure 2: The experimental results on Ionosphere data set using Z-score Method.
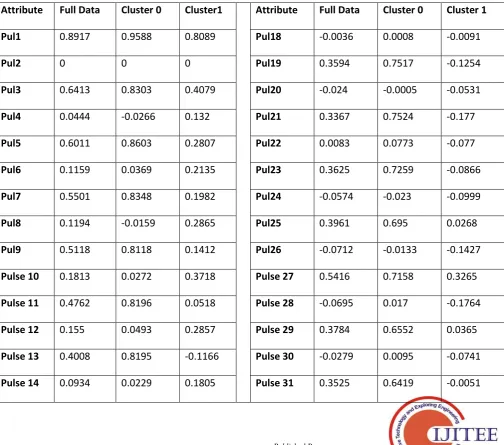
Table 3: Missing values globally replaced with mean/mode
Attribute
Full Data
Cluster 0
Cluster1
Attribute
Full Data
Cluster 0
Cluster 1
Pul1
0.8917
0.9588
0.8089
Pul18
-0.0036
0.0008
-0.0091
Pul2
0
0
0
Pul19
0.3594
0.7517
-0.1254
Pul3
0.6413
0.8303
0.4079
Pul20
-0.024
-0.0005
-0.0531
Pul4
0.0444
-0.0266
0.132
Pul21
0.3367
0.7524
-0.177
Pul5
0.6011
0.8603
0.2807
Pul22
0.0083
0.0773
-0.077
Pul6
0.1159
0.0369
0.2135
Pul23
0.3625
0.7259
-0.0866
Pul7
0.5501
0.8348
0.1982
Pul24
-0.0574
-0.023
-0.0999
Pul8
0.1194
-0.0159
0.2865
Pul25
0.3961
0.695
0.0268
Pul9
0.5118
0.8118
0.1412
Pul26
-0.0712
-0.0133
-0.1427
Pulse 10
0.1813
0.0272
0.3718
Pulse 27
0.5416
0.7158
0.3265
Pulse 11
0.4762
0.8196
0.0518
Pulse 28
-0.0695
0.017
-0.1764
Pulse 12
0.155
0.0493
0.2857
Pulse 29
0.3784
0.6552
0.0365
Pulse 13
0.4008
0.8195
-0.1166
Pulse 30
-0.0279
0.0095
-0.0741
International Journal of Innovative Technology and Exploring Engineering (IJITEE) ISSN: 2278-3075, Volume-9 Issue-1, November 2019
Pulse 15
0.3442
0.8171
-0.2402
Pulse 32
-0.0038
0.0126
-0.024
Pulse 16
0.0711
0.0142
0.1414
Pulse 33
0.3494
0.6234
0.0108
Pulse 17
0.3819
0.7792
-0.1089
Pulse 34
0.0145
-0.0121
0.0473
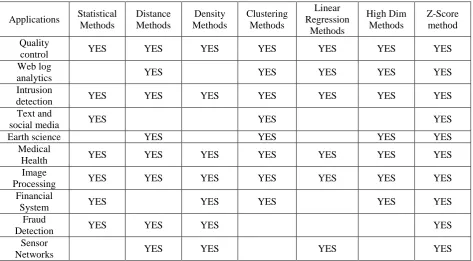
A huge number of outlier recognition techniques providing in literature. The conventional outlier recognition methods can be usually clustered into subsequent classes: clustering-based approaches, distance-based approaches statistical based approaches, density-based approaches,
[image:5.595.62.536.225.486.2]Linear Regression techniques, High Dimensional approaches and Z-Score methods. The Implementations of these outlier recognition approaches are enumerated in Table 4.
Table 4: Comparative Study on Outlier Detection Techniques
Applications Statistical Methods
Distance Methods
Density Methods
Clustering Methods
Linear Regression
Methods
High Dim Methods
Z-Score method
Quality
control YES YES YES YES YES YES YES
Web log
analytics YES YES YES YES YES
Intrusion
detection YES YES YES YES YES YES YES
Text and
social media YES YES YES
Earth science YES YES YES YES
Medical
Health YES YES YES YES YES YES YES
Image
Processing YES YES YES YES YES YES YES
Financial
System YES YES YES YES YES
Fraud
Detection YES YES YES YES
Sensor
Networks YES YES YES YES
In the above Comparison table, the Z-score method is applied to a wide variation of real-world applications including, Medical and Public Health, Intrusion Detection, Credit Card fraud Recognition Fraud Detection, etc.
V.CONCLUSION
Outlier recognition is an interesting research area in machine learning. With the recently emergent tools and varied applications, the attention of outlier recognition is growing significantly. Currently, a significant no of outlier detection procedures have been observed and effectively applied in a wide range of arenas, comprising medical health, credit card fraud and intrusion detection. They can be utilized for conservative data analysis. However, Outlier recognition drives to find sequences in data that do not conform to estimate performance. In this paper, we presented a statistical approach called Z-score method for outlier recognition in high-dimensional data. Z-scores is a novel method for deciding distant data based on data positions on charts. The projected method is computationally fast and robust to outliers’ recognition. A comparative analysis with extant procedures is implemented with high dimensional datasets.
Exploratory outcomes determine an enhanced
accomplishment, efficiency and effectiveness of our projected methods.
REFERENCES
1. K. Shim, R. Rastogi and S. Ramaswamy "Efficient Algorithms for Mining Outliers from Large Data Sets", ACM SIGMOD Conference Proceedings, 2000.
2. P. Yu. And C. C. Aggarwal "Finding Generalized Projected Clusters in High Dimensional Spaces", ACM SIGMOD Conference Proceedings, 2000.
3. D. A. Keim, C. C. Aggarwal, and A. Hinneburg "What is the nearest neighbor in high dimensional spaces?” , VLDB Conference Proceedings, 2000.
4. A. Swami, T. Imielinski and R. Agrawal "Mining Association Rules between Sets of Items in Large Databases". ACM SIGMOD Conference Proceedings, 1993.
5. P. Raghavan., R. Agrawal, and A. Arning "A Linear Method for Deviation Detection in Large Databases", KDD Conference Proceedings, 1995.
6. T. Lewis. and V. Barnett "Outliers in Statistical Data", John Wiley and Sons, NY 1994.
7. U. Shaft., R. Ramakrishnan, J. Goldstein, and K. Beyer "When is Nearest Neighbors Meaningful?” , ICDT Conference Proceedings, 1999. 8. J. Sander., R. T. Ng, H.-P. Kriegel, and M. M. Breunig "LOF:
9. P. Yu. and C. C. Aggarwal “Fast Algorithms for Projected Clustering", ACM SIGMOD Conference Proceedings, 1999.
10. S. Mehrotra and K. Chakrabarti "Local Dimensionality Reduction: A New Approach to Indexing High Dimensional Spaces", VLDB Conference Proceedings, 2000.
11. X. Xu., J. Sander, H.-P. Kriegel and M. Ester "A Density-Based Algorithm for Discovering Clusters in Large Spatial Databases with Noise", KDD Conference Proceedings, 1996.
12. R. P. Tai., J. B. Orlin and C. C. Aggarwal "Optimized Crossover for the Independent Set Problem", Operations Research 45(2), March 1997. 13. R. Ng. E and Knorr "Algorithms for Mining Distance-based Outliers in
Large Data Sets", VLDB Conference Proceedings, September 1998. 14. P. Raghavan., D. Gunopulos, J. Gehrke and R. Agrawal “Automatic
Subspace Clustering of High Dimensional Data for Data Mining Applications", ACM SIGMOD Conference Proceedings, 1998.
AUTHORSPROFILE
PerurivenkataAnusha, Research Scholar in Computer Science Engineering, Acharya Nagarjuna University.
ch, anuradha, Assistant professor, Department of computer Science and Engineering, VRSEC, Vijayawada.
Dr. Patnala S.R. Chandra Murty, Assistant Professor,Department of computer Science and Engineering, Acharya Nagarajuna University.