IMPLICATIONS OF FAULT CURRENT LIMITATION FOR
ELECTRICAL DISTRIBUTION NETWORKS
S.M. Blair*, A.J. Roscoe*, C.D. Booth*, G.M. Burt *, A. Teo
and C.G. Bright
* Institute for Energy and Environment, University of Strathclyde, Glasgow, UK, [email protected] 5ROOV-Royce, Derby, UK, [email protected]
Keywords: Distributed generation, fault current limitation, fault level, protection, SFCL.
Abstract
This paper explores the potential future need for fault current OLPLWDWLRQ LQ WKH 8.¶V SRZer system, and some of the technical implications of this change. It is estimated that approximately 300-400 distribution substations will require fault current limitation, based on the statistical analysis of the projected IDXOWOHYHO³KHDGURRP´ (or violation). The analysis uses a UK electrical system scenario that satisfies the *RYHUQPHQW¶V WDUJHW IRU DQ FXW LQ &22 emissions by 2050. A case study involving the connection of distributed generation (DG) via a superconducting fault current limiter (SFCL) is used to illustrate the potential protection and control issues. In particular, DG fault ride-through, auto-reclosure schemes, and transformer inrush current can be problematic for SFCLs that require a recovery period. The potential solutions to these issues are discussed, such as the use of islanding or automation to reduce the fault level.
1
Introduction
Utility electrical distribution systems require new solutions to address the problems presented by increased fault current levels due to the connection of distributed generation (DG) and energy storage. There are several methods of reducing fault currents [2]; this paper focuses on the resistive superconducting fault current limiter (SFCL). The future need for fault current limitation in distribution networks is statistically analysed, based on the projected fault level "headroom" (or violation). An increased presence of DG and fault current limitation in the electrical system requires close examination of the system-wide integration issues, particularly for protection and control schemes, such as fault ride-through and auto-reclosure. An important theme of this paper is the problem of the recovery time of resistive SFCLs and how it impacts protection, as well as potential solutions.
2
Analysis of need for fault current limitation
2.1 Summary of analysis method
The present-day fault level headroom is derived from publicly available five-year plan documents for three UK distribution network operators (DNOs). In this analysis, DNOs A and B
SURYLGH DQ XUEDQUXUDO PL[ DQG '12 & LV KLJKO\ ³UXUDOO\ -ELDVHG´ 7KH KHDGURRP LV FDOFXODWHG IURP Vwitchgear equipment ratings minus RMS break fault levels. The mean and standard deviation of the headroom at each voltage level, for each DNO, are calculated. Data from different DNOs are merged and the number of substations (nodes) is scaled to approximate a UK-wide scenario.
A future scenario for UK generation to satisfy the *RYHUQPHQW¶V WDUJHW IRU DQ FXW LQ &22 emissions by 2050 [12] is established, including the required DG and energy storage, and their distribution in the electrical system. However, this scenario may be idealistic and is simply indicative of the possible impact of generation on fault levels. The increase in mean fault level (and corresponding decrease in mean headroom) due to the future scenario is calculated. A DG connection at a single node may also raise the fault level at neighbouring nodes. To model this effect, it has been estimated that any DG installation increases the fault current, on average, at 1.5 nodes+HQFHWKHQXPEHURI³LQGHSHQGHQW QRGHV´ LVdefined as the actual number of nodes divided by 1.5. The percentage of power system substations which are likely to have negative fault level headroom, hence requiring some form of fault current limitation, is statistical analysed.
[image:1.595.311.539.610.738.2]2.2Results
Figure 1 illustrates the fault level relative to circuit breaker (CB) rating for DNO A. At both 11 kV and 33 kV, DNO A was found to have the worst mean fault level headroom, 6.7 kA and 6.9 kA respectively. Table 1 summarises the overall headroom for all DNOs. The weighted averages of existing "over-stressed" nodes are 2.5% for 11 kV and 1.4% for 33 kV.
11 kV 33 kV
Total valid nodes 1147 698
Fault level mean (% of CB rating) 48.6% 47.1%
3-phase fault level mean 7.1 kA 8.0 kA
3-phase fault level std. dev. 3.0 kA 4.0 kA
Mean CB rating 15.0 kA 17.9 kA
[image:2.595.59.273.83.152.2]Mean headroom 7.9 kA 9.9 kA
Table 1: Summary of fault level headroom (averages for all DNOs, weighted by relative peak demand)
The UK 2050 scenario used in this paper requires approximately 59.2 GWa (gigawatt-years) of electrical energy. This is significantly higher than the 2007 demand of 39 GWa (342 TWh), due to the impact of electric vehicles (EVs) and the increased use of electricity for space heating (using heat pumps where appropriate, displacing natural gas use). Assuming an average load factor of 0.83 (if heating, EV-charging, and electrolysis loads can be managed, via demand response and real-time pricing, to have load factors of 1) and a transmission and distribution efficiency of 91%, there is a peak electrical demand of 70.9 GW (at the end user) or 77.9 GW at generation. In this scenario, 25.5 GWa would FRPH IURP ³WUDGLWLRQDO´ JHQHUDWLRQ VRXUFHV DQG WKH remaining 33.7 GWa from renewable or sustainable sources (or energy storage). The derivation of these values is beyond the scope of this paper. An estimated split of renewable generation sources, and their assumed capacity factors, is shown in Table 2.
% required
from each source
Capacity factor
Total energy required
Peak capacity
Wind 60.0% 0.35 22.7 GWa 64.9 GW
Tidal 20.0% 0.42 7.8 GWa 18.6 GW
Wave 10.0% 0.35 4.1 GWa 11.7 GW
Solar 5.0% 0.12 2.7 GWa 22.2 GW
Despatchable renewables (Biomass etc.)
5.0% 0.60 1.9 GWa 3.1 GW
[image:2.595.310.546.206.250.2]Storage N/A 0.25 5.1 GWa 20.5 GW
Table 2: Peak capacities of renewable generation and storage to meet 2050 targets
In the worst case scenario where only despatchable renewable sources are available (3.1 GW), and given a despatchable (non-renewable) peak capacity of 54.3 GW, the minimum peak capacity of energy storage must be 20.5 GW. Considering an average capacity factor of 0.25 for storage devices and an assumed average efficiency of 59% for the energy storage process, 5.1 GWa of energy must pass through storage, with losses of 2.1 GWa. Hence, a total of 39.1 GWa (33.7÷0.91 + 2.1) must be provided from sustainable sources.
Symmetrical per-unit short-circuit current infeed
11 kV 33 kV 132 kV
Synchronous 3-8 (direct
connected)
3-8 (direct connected)
2.5-4.5 (always via a transformer)
DFIG 1.0-2.0 (direct connected) 1.0-2.0 (direct connected) via a transformer) 1.0-1.5 (always Inverter 1.0-2.0 (direct
connected)
1.0-2.0 (possibly direct connected)
[image:2.595.46.292.397.522.2]1.0-1.5 (always via a transformer)
Table 3: Ranges of symmetrical fault level in-feeds for different interface types
The mix of generation-to-grid interfaces is important for estimating the likely fault current contributions from DG. Wind sources commonly use a double fed induction generator (DFIG) interface. Tidal, wave, solar, and storage sources are typically inverter-interfaced, with the exception of hydro generation and compressed-air which are synchronous. Despatchable renewables are also assumed to be synchronous generators. The typical fault level in-feed ranges, adapted from [6], are shown in Table 3; the mean and standard deviation values of each range are used in the analysis.
11 kV 33 kV 132 kV Wind, Tidal, Wave, and Biomass, etc. 30% 50% 20%
Solar 80% 20% 0%
Storage 30% 30% 40%
Table 4: Likely split of new generation/storage capacities at each connection voltage
Given the estimated split of generation connection voltages in Table 4, the mean fault level increase per node at each voltage level can be determined. The mean headroom minus the mean contribution from each renewable generation interface type, at each ³LQGHSHQGHQWQRGH´, is calculated; the normally distributed variables are combined. The probability of nodes being overstressed (possessing negative headroom) can be calculated using one minus the cumulative normal distribution function (shown in Equation (1), where x is the value of interest divided by the standard deviation).
dx
e
x
P
x x
³
f
2
2
2
1
S
(1)Multiplying the resulting probabilities by the number of nodes in the UK, at each voltage level, estimates the number of substations which may require fault current limitation, as summarised in Table 5. The analysis was repeated to consider DNOs A and B only, to exclude '12&¶Vrural bias.
All three DNOs DNOs A and B 11 kV 33 kV 11 kV 33 kV Approx. percentage of
nodes with negative headroom
5.2% 1.0% 5.9% 1.9%
Number of potentially affected nodes in the UK
[image:2.595.315.542.508.598.2]282 42 320 75
Table 5: Potential UK-wide requirement for fault current limitation, at 11 kV and 33 kV
2.3 Assumptions and discussion
The results illustrate that a significant number of UK substations, particularly at 11 kV, may require fault current limitation. Other countries faced with similar future DG connection may have similar issues with fault levels, indicating a worldwide market for SFCLs.
[image:2.595.39.293.645.725.2]even spread is assumed. Clustering would increase the fault level at individual nodes, but the number of nodes affected would reduce. Thus, an assumed homogeneous spread of DG/storage probably leads to a reasonably accurate estimate. This analysis does not account for new substations which may be needed to support the significant electrical demand increase, or the potential to purchase cheaper switchgear with a lower fault current rating (e.g., 16 kA instead of 25 kA) if SFCLs are used. TKH ³LQWDQJLEOH´ YDOXH RI 6)&/s, such as the potential for increased security of supply, increased power quality, and perhaps reduced losses (because of the reduced system impedance due to increased interconnection) is not evaluated. However, an SFCL may itself add electrical losses and operational costs; these have also been ignored.
Many of these simplifications are justified as being relatively small compared to the variability of the viable cost of an SFCL. This can be estimated, although very approximately, from the range of costs of competing solutions for managing fault levels [5], [6]. If SFCLs can be offered at the lower cost levels, their adoption is likely to be high.
3
Technical issues with fault current limitation
The protection and control issues described in this section all relate to the inherent operation of an SFCL during a fault, or any system transient that leads to current in excess of the VXSHUFRQGXFWRU¶V FULWLFDO FXUUHQW YDOXH. During a fault, the superconductor in a resistive SFCL will rapidly transit from the superconducting state to a resistive state. However, up to several minutes may be required for recovery to the superconducting state [10]. It is assumed that the SFCL should be removed from service during this period; however the possibility of recovery under load (RUL) is being explored [9]. The potential for SFCLs to interfere with the operation of overcurrent and distance protection schemes has been discussed in [2], [7], [8]; this paper will focus on other issues relevant to utilities.
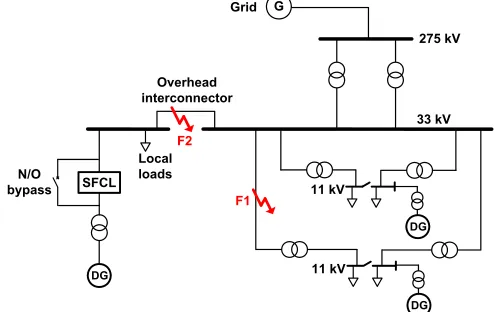
A case study network has been used to demonstrate the protection issues for a DG connection via an SFCL, as illustrated in Figure 2. It is assumed that the DG would increase the fault level in the local vicinity to a level beyond the rating of existing switchgear, and hence the SFCL is necessary to curb the generator¶VIDXOWOHYHOFRQWULEXWLRQ It is also assumed that circuit breakers are installed on each feeder, and isolators are located in series with the SFCL. The SFCL may also be installed on the generator side of the connecting transformer.
Note that simple scenarios are considered in this paper and other factors may need to be considered in detail, such as: power quality; undervoltage and underfrequency protection; the type of distributed generation and whether it is centrally despatchable or not; regulatory issues; and the stability of the DG/islanded system (such as lack of voltage control and loss of synchronism) as well as the grid. Other SFCL locations are also likely [2], [10]. In particular, the bus-tie location, as described in [3], is expected to minimise the effects of SFCLs
on existing protection systems [2], as well as significantly reducing fault currents.
G
33 kV 275 kV
N/O bypass
Local loads SFCL
DG
DG Grid
F2
F1 11 kV
11 kV Overhead
interconnector
[image:3.595.303.550.111.267.2]DG
Figure 2: DG connected to the grid via an SFCL
3.1SFCL issues for remote faults
The requirement for DG ride-through during remote faults may be problematic for systems that incorporate SFCLs. First, considering a permanent fault at F1 in Figure 2, which is assumed to be on an underground cable feeder, the DG may be required to ride-through this disturbance while the fault is cleared by the appropriate network protection scheme. However, the SFCL may operate, which (although necessary) consequently requires disconnection of the SFCL (and DG) for recovery. There are several potential solutions to this problem:
x An SFCL that does not require a recovery period could be used, such as a DC-biased pre-saturated iron-core device [10].
x Faster-acting protection schemes could help reduce the energy absorbed by the SFCL and potentially reduce its recovery time. However, circuit breaker operation time (several cycles) relative to SFCL operation time (sub-cycle) may diminish the net benefit achieved by reducing fault detection and location times.
x The act of removing the faulted feeder from service (e.g., the feeder with fault F1 in Figure 2) may reduce the fault level at the 33 kV busbar, thereby allowing the SFCL to remain out of service while recovering (with the normally-open bypass being used to enable the DG to remain in service). Furthermore, before activating the bypass, network automation could manipulate normally-open/closed points to reduce the prevailing fault level (possibly at the expense of security of supply and power quality) [6]. This would also allow the SFCL to be removed from service for maintenance. Such a scheme may require relatively low-latency communications between intelligent electronic devices (IEDs) throughout the system.
x Energy storage could potentially be integrated with protection to support loads during the recovery time.
x It may be deemed acceptable to remove the DG (and shed some loads, if required) during SFCL recovery, because such faults are rare and some disturbance should be expected.
Second, many faults on distribution-level overhead lines are transient in nature and hence supply can often successfully be restored by automatic reclosing schemes [1]. Multi-shot reclose schemes may also be used on distribution lines, particularly if there is a high occurrence of semi-permanent faults. The requirement for reclosure capability further complicates the issues described for DG fault ride-through with fault current limitation.
For transient or semi-permanent faults, such as F2 in Figure 2, the SFCL will become resistive and limit the fault current during the protection operating time of the initial trip (see Figure 3). However, the SFCL may not recover to the superconducting state during the dead time, therefore delaying supply restoration unduly. Although increased dead time may increase the chance of a successful reclosure (because the arc has longer to de-ionise, which is increasingly important at higher voltages), it is unlikely that typical dead times (perhaps several seconds at most [1], [4]) will be sufficient to permit SFCL recovery.
Fault occurs
Protection operates
CB fully
open Reclosure
CB fully closed
Re-sync and reclosure
CB fully closed Dead time
Dead time and SFCL recovery
Time (a)
Typical reclosure
(b) Reclosure with SFCL recovery
Figure 3: Comparison of simplified reclosure times for a transient fault
Further potential solutions to SFCL issues during transient faults include:
x In some cases the DG must be disconnected during the dead time, regardless of the desirable ride-through or reclosing strategy, to prevent damage due to out-of-sync reclosure [4]. Alternatively, the subsystem could RSHUDWH LVODQGHG WKH 6)&/¶V QRUPDOO\-open bypass could be closed to supply the local loads from the DG. This assumes that the DG is necessary to supply the local loads, to prevent load shedding. Islanding should prevent fault level violations, and the island can be reconnected to the grid when the SFCL recovers (by attempting to reclose on the faulted feeder). Clearly many other issues exist with islanding, particularly resynchronisation with the grid.
x An additional SFCL in its superconducting state (or another element in a dual-element unit) could be connected during the dead time. This may significantly
increase capital and operational costs, and may still be insufficient to support multi-shot reclosure schemes.
x A resistive or reactive SFCL bypass could also reduce WKH '*¶V IDXOW OHYHO FRQWULEXWLRQ EXW WKH DVVRFLDWHG voltage drop may be unsatisfactory; there may also be overheating problems. However, the voltage drop could be compensated with a tap changer transformer managed by a local automation scheme.
3.2Protection mal-operation by non-fault transients
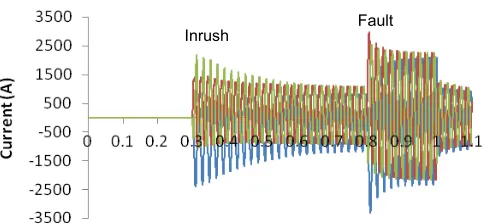
[image:4.595.303.556.308.469.2]The large currents seen during non-fault transients, such as transformer inrush and motor starts, could cause SFCLs to operate spuriously [11]. Transformer protection uses harmonic restraint to block trips during inrush [1]; this is not relevant for SFCLs. In some circumstances it may be desirable to dampen inrush with an SFCL, but the current should not be sufficient to require recovery to the superconducting state [3], [11].
Figure 4: Typical inrush current with DG disconnected (top) and with islanding (bottom)
For a simple radial network such as Figure 2, the effect of transformer inrush was simulated for a ³black start´ of the network (i.e., reconnection of the grid infeed), with and without DG connected. Figure 4 shows the currents for a black start at 0.3 seconds at (a) a grid infeed transformer (at the 33 kV side), and (b) the 33 kV bus. However, if DG is allowed to continue to supply loads (i.e., islanding is permitted), the corresponding ³EURZQ VWDUW´ currents are shown in (c) and (d). Clearly, the inrush currents are significantly reduced, because the 33/11 kV transformers remain energised. Note that a very high DG penetration is assumed, to help model local DG clustering.
Figure 5 shows that transformer inrush and certain faults can produce a similar peak current magnitude and DC offset. Hence, SFCLs have the potential to operate spuriously in response to transformer inrush current, albeit under relatively extreme situations. In this case, an SFCL at the 33 kV bus must be designed with a critical current that avoids operation for such currents (from 11 kV faults), and should only operate for faults at the 33 kV level which can result in peak fault current of approximately 18.2 kA, as shown in Figure 6.
(c) (d)
[image:4.595.44.293.404.493.2]Figure 5: Inrush current at grid infeed compared with a 3-phase to earth fault at an 11 kV bus (without DG)
Figure 6: Inrush current at grid infeed compared with a 3-phase to earth fault at the 33 kV bus (without DG)
4
Conclusions
The statistical analysis presented in this paper illustrates the potential need for fault current limiters in the UK ± perhaps several hundred devices ± and alludes to a significant worldwide market.
SFCLs can complicate existing protection and control schemes in distribution networks, particularly if the device requires a recovery period. The issues with DG fault ride-through, auto-reclosure schemes, and transformer inrush are described. Islanding may have a role to play in the practical and economical use of resistive SFCLs. The case study has shown how islanding could help mitigate the recovery time during certain faults, and help mitigate the problem of transformer inrush. Automation schemes could also be used to temporarily manipulate the system topology to reduce the fault level, such that, ideally, all DG remains in service and all loads are supplied while an SFCL recovers. Modelling of typical SFCL operation and recovery time characteristics is needed in future studies to better understand the interaction between SFCLs and protection and control schemes.
Acknowledgements
This work was carried out within the Rolls-Royce University Technology Centre at the University of Strathclyde. The
authors gratefully acknowledge the funding and support offered byRolls-Royce.
References
[1] Areva. ³Network Protection & Automation Guide´, ISBN: 2951858906, (2005).
[2] S. Blair, N.K. Singh, C. Booth, and G. Burt. ³2SHUDWLRQDO &RQWURO DQG 3URWHFWLRQ ,PSOLFDWLRQV RI Fault Current Limitation in Distribution Networks´, Proceedings of the 44th International Universities
Power Engineering Conference, University of
Strathclyde, (2009).
[3] R. Dommerque, et al. ³)LUVW &RPPHUFLDO 0HGLXP Voltage Superconducting Fault-Current Limiters ± Production, Test and InstallatiRQ´IEEE/CSC & ESAS
European Superconductivity News Forum (ESNF),
(2010).
[4] R. Dugan and T. McDermott. ³'LVWULEXWHGJHQHUDWLRQ´,
IEEE Industry Applications Magazine, vol. 8, pp. 19-25,
(2002).
[5] EPRI. "Fault Current Management Guidebook", Technical Update, Document ID: 1012419, (2006). [6] KEMA. "The contribution to distribution network fault
levels from the connection of distributed generation", BERR, Contract number: DG/CG/00027/00/00. URN number: 05/1249, (2005).
[7] J. Langston, M. Steurer, S. Woodruff, T. Baldwin, and J. Tang. ³$JHQHULFUHDO-time computer Simulation model for Superconducting fault current limiters and its DSSOLFDWLRQ LQ V\VWHP SURWHFWLRQ VWXGLHV´ IEEE
Transactions on Applied Superconductivity, vol. 15, pp.
2090-2093, (2005).
[8] B.W. Lee, J. Sim, K.B. Park, and I.S. Oh. ³3UDFWLFDO Application Issues of Superconducting Fault Current Limiters for Electric Power Systems´, IEEE
Transactions on Applied Superconductivity, vol. 18, pp.
620-623, (2008).
[9] J.H. Llambes, D.W. Hazelton, and C.S. Weber. ³5Hcovery Under Load Performance of 2nd Generation HTS Superconducting Fault Current Limiter for Electric Power Transmission Lines´, IEEE Transactions on
Applied Superconductivity, vol. 19, pp. 1968-1971,
(2009).
[10]M. Noe and M. Steurer. ³+LJK-temperature superconductor fault current limiters: concepts, applications, and development status´, Superconductor
Science and Technology, vol. 20, pp. R15-R29, (2007).
[11]P. Tixador. ³High Temperature Superconductivity 2´, Springer, ISBN: 3540406396, p. 12, (2004).
[12]UK Statute Law. "Climate change act 2008," UK Government, (2008).
Inrush Fault
Inrush