Calculation of a Lower Bound Ratchet Limit Part 2 - Application to a Pipe Intersection with Dissimilar Material Join
James Urea, Haofeng Chena, David Tippingb
a
Dept of Mechanical and Aerospace Engineering, University of Strathclyde, Glasgow, Scotland, G1 1XJ
b
Central Engineering Support, EDF Energy Nuclear Generation Ltd., Barnwood, Gloucester, GL4 3RS
Abstract: In an accompanying paper in this issue a lower bound method based on Melan's theorem was derived and implemented into the Linear Matching Method ratchet analysis procedure. This paper presents a ratchet analysis of a pipe intersection subject to cyclic thermo-mechanical loading using the proposed numerical technique. This work is intended to demonstrate the applicability of the lower bound method to a structure commonly seen in industry and also to better understand the behaviour of this component when subjected to cyclic loading. The pipe intersection considered here has multiple materials with temperature dependent properties. Verification of the results is given via full elastic-plastic analysis in Abaqus.
Keywords: Shakedown, Ratchet limit, Lower bound, Linear Matching Method, Pipe Intersection 1. Introduction
Pipe intersections and branch connections are common in piping systems, and their assessment is an important consideration in ensuring the structural integrity of existing plant systems. The widespread use of pipe intersections has led to many studies of their behaviour over a number of years from early elastic analyses (Lekkerkerker, 1971) through to more recent analyses considering creep effects including the effects of welded regions (Han et al, 2010). In particular, studies to calculate limit and plastic collapse loads are common for both internal pressure and bending modes, for example the semi-theoretical solutions proposed by Kim et al (2006). These equations use several geometric parameters to predict whether failure will occur in the nozzle, the main pipe or the intersection of the two for a monotonically applied bending moment or pressure.
Despite their common use in piping systems, very few studies have been published regarding this geometry subject to cyclic loading. A study by Nadarajah et al (1996) used the Elastic Compensation Method to conduct a parametric study of this geometry subject to internal pressure and cyclic bending moments. Systematically altering the mean radii and shell thicknesses of the pipe and nozzle allowed a variety of thin walled (radius to thickness ratio between 50 and 200) to be analysed. Both the limit load surface and elastic shakedown limit was calculated for each geometry using an elastic-perfectly plastic material model. The parametric studies found a strong interaction between the loads, with small nozzles (having a radius of less than one fifth of that of the main pipe) having a near linear interaction curve. Larger nozzles (i.e. with a radius of two fifths of the main pipe) still displayed a strong interaction between the loads, but had a circular interaction curve which is more akin to the conventional Bree like shakedown boundary.
FEA and stress categorisation methods. The Elastic Compensation Results presented for this case show little interaction between the bending moment and internal pressure. This is attributed to the thick shells, which serve to isolate the loadings from each other. Again, internal pressure and cyclic in-plane moments were considered. Apart from these studies, no further shakedown examples of this geometry could be found.
Within the UK nuclear industry assessment code R5 (Ainsworth, 2003), components are allowed to operate beyond traditional elastic shakedown limits into the reverse plasticity region (also known as global shakedown). However, because R5 is based on simplified assessment procedures, at times it may prove difficult to show that a component is in shakedown status (whether elastic or global). To alleviate this, EDF Energy has incorporated the Linear Matching Method (Chen 2010a, 2010b; Chen and Ponter, 2010) into their R5 research programme. The Linear Matching Method is a direct method for assessing shakedown and ratchet limits which avoids the need for full nonlinear finite element analysis. Instead the bounding theorems of Koiter (1960) and Melan (1936) are used to calculate the shakedown and ratchet limits of the component.
In an accompanying paper elsewhere in this issue (Chen et al, 2012) the theoretical basis is given for the extension of Melan's theorem to the assessment of the ratchet limit, which shows the boundary between global shakedown and ratcheting behaviour. The numerical implementation of this theorem is also described and demonstrated through the benchmark of a plate with a central hole subject to cyclic thermal and mechanical loading. The purpose of the current paper is to apply this method to a pipe intersection with a dissimilar material join. Firstly, this will increase the knowledge of the behaviour of this component when subject to cyclic thermal and mechanical loading. Secondly, this will verify the applicability of the latest LMM procedure to larger and more complex problems than the typical benchmarks seen. The remainder of this paper briefly summarises the Linear Matching Method before going on to explain the geometry and finite element model used here. Two load cases are considered: a constant internal pressure and 1) cyclic thermal loading and 2) a cyclic in-plane bending moment applied to the branch pipe. Discussion of the results is provided and verification is given through a full nonlinear elastic-plastic step-by-step analysis in Abaqus. 2. The Linear Matching Method
The premise of the linear matching method is that the nonlinear elastic plastic behaviour of metallic materials can be substituted for a linear material model in an iterative solution scheme. A series of linear elastic solutions is performed and the modulus is reduced in regions where the stress in the material has exceeded the yield stress. The subsequent iteration uses these modified modulus values, which allows the stresses to redistribute in the structure in a way which very closely mimics that of an elastic plastic material.
theorem which states that if 1) any kinematically admissible strain rate can be found such that the strain rate is compatible with the applied displacement and 2) the plastic dissipation within the structure is less than or equal to the applied work, then shakedown does not occur.
In the accompanying paper (Chen et al, 2012), an extension to Melan's theorem was derived which made the calculation of the lower bound on the ratchet limit possible. Melan's theorem states that for a given load set the structure will shakedown if a constant residual stress field can be found such that the yield condition is not violated for any combination of cyclic elastic and residual stresses. If the cyclic loading is large enough to cause reverse plasticity, then a varying residual stress field is also formed in addition to the constant residual stress present. The extension to Melan's theorem comes from the idea that this varying residual stress field can be combined with the elastic stress at the corresponding point in the load cycle to create the total varying stress. With the addition of a steady state stress to this total varying stress, if a constant residual stress field can be found such that the yield condition is not violated for any point in the load cycle, then it can be said that the component is not ratcheting.
The LMM is currently implemented in the Abaqus using the UMAT user subroutine (Abaqus, 2009). This extension to Melan’s theorem for calculation of the lower bound ratchet limit has been added into stage 2 of the LMM subroutines. The cyclic elastic stresses and associated varying residual stresses calculated during stage 1 are combined to form the total varying stress. Stage two uses this, along with the additional steady state stress, to calculate a constant residual stress field which will mean that yield is satisfied at each point in the load cycle.
3. Pipe Intersection
The pipe intersection analysed in this paper is similar to that analysed in the EPERC example (1999), and is shown in Figure 1. The small intersecting pipe is welded to the main pipe, with the weld itself modelled as a chamfer between the two shells (as per the EPERC example). The main pipe is made from 316 stainless steel, a common material in nuclear plant components. The intersecting pipe was chosen to be from low alloy steel SA508 and the weld material is Inconel 82/182. Recently the UK nuclear industry has been analysing the residual stresses present in this dissimilar weld with a view to investigating stress corrosion cracking (Brust et al, 2010; Smith et al, 2010a, 2010b).
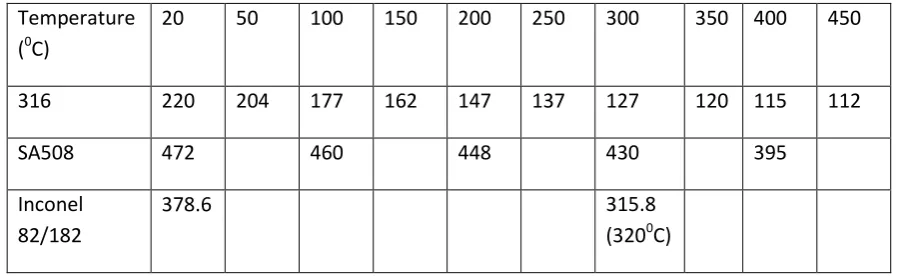
When conducting thermal analyses it is important to consider the effects of temperature dependent material properties. The temperature dependent yield stresses used for all three materials is shown in Table 1. During the analysis linear interpolation/extrapolation is used to calculate the yield stress at intermediate and outlying temperatures. The data for 316 and SA508 were taken from the British Standard (2007) and a paper by Hurrell et al (2005) respectively. Material data for the Inconel weld in the as-welded condition is limited, with the micromechanical tests of Kim et al (2009) being the only elevated temperature tests which could be found. Linear extrapolation is performed to provide an approximation to the temperature dependency, which will give a more accurate solution than if temperature independent properties were assumed throughout the weld. An elastic perfectly plastic material which satisfies the von-Mises yield criterion is assumed throughout this work.
dependent yield stress is considered once the linear matching process has begun, but because the elastic solutions have been performed before this process a single value of thermal expansion must be assumed. This is fine for a single ratchet analysis at a fixed level of cyclic thermal load, but to create the Bree diagram a new set of elastic solutions would need to be created for each level of thermal loading considered. To avoid this, the worst case thermal expansion scenario was chosen. When the temperature dependency of the thermal expansion coefficients of the materials in Smith et al (2010b) is examined, it can be seen that the difference between the three values remains almost constant. The magnitude increases, but does so uniformly for all three materials. Therefore, with a maximum temperature considered never larger than 6000C, the expansion values at this temperature were used for all thermal analyses conducted. Therefore values of 1.8E-5 for 316, 1.5E-5 for Inconel 82/182 and 1.4E-1.5E-5 for SA1.5E-508 are used. This assumption gives conservative results in all cases.
Two separate load cases are considered for this pipe intersection. The first is a steady state internal pressure and a cyclic thermal load. The second load case is the combined action of a steady state internal pressure and a cyclic in plane bending moment.
4 Internal Pressure and a Cyclic Thermal Load
The thermal cycle chosen for this analysis has three load instances. The first point is where the intersection is at ambient temperature, θ0, throughout the entire structure. The second point is
where the inner surface is at an elevated temperature, θ0 + Δθ, whilst the outer surface remains at
ambient, θ0. This results in a linear temperature gradient through the wall of the pipe with a
temperature difference ∆θ. The differential expansion of the inner and outer surfaces results in a linear distribution of elastic stress through the wall thickness. Finally, the case where the entire structure is held at a uniform elevated temperature, θ0 + Δθ, is considered. The different thermal
expansion coefficients of the materials create thermal stresses at the material boundaries. In addition to this cyclic thermal loading, an internal pressure is applied. The closed end condition is assumed, which is applied in the model as an axial tension to both pipes. In addition, both free ends of the intersection are constrained to expand in plane, which simulates the expansion of a long pipe. Due to the symmetry present in the geometry and the applied loads, a quarter model with appropriate symmetry boundary conditions was used to model the pipe intersection. The mesh is refined in the region of the weld as all of the structural and material discontinuities are in this region. This gives the model a total of 4038 elements as shown in Figure 2. Element type DC3D20 elements used for the two heat transfer analyses. These temperature distributions were then applied as predefined fields in linear elastic structural analyses (using C3D20R elements), giving the stresses shown in Figure 3.
and demonstrates the ability of the LMM to produce lower and upper bound limits for both shakedown and ratcheting.
4.1 Results
The Bree diagram for the pipe intersection subject to a constant internal pressure and the thermal cycle is shown in Figure 4. The applied constant internal pressure, P, is normalised against the initial applied internal pressure, P0, of 10MPa. The applied temperature difference, ∆θ, is normalised
against the initial applied temperature difference, ∆θ0, of 1000C. Both temperature dependent and
temperature independent results (using the yield stress at 200C in Table 1) are plotted, and demonstrates that temperature dependant yield stress significantly reduces the ratchet and reverse plasticity limits of the component.
The point corresponding to zero cyclic load (point A in Figure 4) represents the limit load for internal pressure. The failure mechanism for this loading predicted by the LMM calculation is at the crotch corner (Figure 5a), which is typical of this geometry subject to pressure loading. This mechanism dominates the failure at low levels of cyclic loading. When the cyclic thermal load increases in magnitude (point C), the material mismatch begins to play a more significant role in the failure. The difference in the thermal expansions causes a reverse plasticity mechanism at the material joins. When the internal pressure is applied, this then interacts with the concentration at the crotch corner to produce a failure mechanism which has a contribution from both loads as shown in Figure 5b. At large levels of cyclic loading (point E), the material mismatch dominates the failure mechanism. The concentration due to the mismatch at these levels of thermal loading is such that even the severe stress raiser at the crotch corner is no longer a factor in the ratchet mechanism (Figure 5c). Figure 6 shows the convergence for Points B and D respectively. These plots show the convergence of the upper and lower bound multipliers when temperature dependent material properties are used. Considering point B first, it can be seen that the upper bound solution converges rapidly to the least upper bound for this finite element mesh. The convergence of the lower bound at this point is comparatively slow. As highlighted in the benchmark example in the accompanying paper, this is typical behaviour for both upper and lower bound solutions. Lower bounds are calculated using the stresses at each integration point in the model. It may be difficult to satisfy yield at integration points in these regions, and so the lower bound solution will be dictated by these points. The solution may require a number of increments to redistribute the stress to surrounding points and bring all stresses below the yield stress. The upper bounds are based on energy integrals over the volume of the structure, which dilutes the effects of stress concentrations allowing upper bounds to converge in fewer increments than lower bounds.
the two final converged solutions can be validated against one another and give confidence in their accuracy.
4.2 Verification
It is important to verify the results to ensure that these analyses have been correctly carried out and that the ratchet boundary has been correctly calculated. Figure 7 shows the results calculated by the LMM using temperature dependent results and the load points selected for full step by step analysis in Abaqus. Load points F, G, H and I are used to verify the ratchet boundary itself, and the points J to O were used to compare with the plastic strain ranges predicted by the LMM.
Point F lies within the elastic shakedown region, point H lies within the reverse plasticity region and the points G and I are beyond the ratchet limit. The step by step analyses were performed and the equivalent plastic strain at the most critical locations were checked to determine the cyclic response of the structure, and these correlate well with the ratchet bound predicted by the LMM. Figure 8 shows the plastic strain history for points F, G, H and I taken at the points of maximum plastic strain. Point F shows an elastic shakedown response, the plastic strain ceasing to increase after ten cycles. Point G exhibits a clear ratcheting response. The plastic strain increases with every cycle at a constant rate, indicating a ratchet mechanism. Point I also shows a very strong ratchet mechanism. The plastic strain history for point H should form a reverse plasticity mechanism, but it can be seen in Figure 8 that the plastic strain is still marginally increasing with each cycle. Further Investigation of this load case reveals that, although the plastic strain is increasing within the cycles plotted, the rate of accumulation of plastic strain with each cycle is decreasing. Figure 9 plots the rate of change of plastic strain for point H when the analysis is performed for over 1000 cycles. It can be seen that the accumulation of plastic strain in each cycle falls to less than 3x10⁻³ % per cycle and is still falling. If allowed to continue it is expected that this would fall to zero and a reverse plasticity mechanism would form. This result highlights the usefulness of the LMM in the analysis of cyclic problems in general. If step by step analysis were used alone, the result at point H may be interpreted as a ratcheting response. The LMM removes any ambiguity in these results, proving that the component is not ratcheting.
A qualitative verification of the LMM comes from its prediction of where the maximum plastic strains will occur. Figure 10 compares the equivalent plastic strain from points H, I and the corresponding point on the ratchet boundary at ∆θ/∆θ0 =2.5. When comparing these contour plots
an allowance must be made for the varying levels of internal pressure applied. Taking this into account the LMM predicts a plastic zone very similar to that from both step by step analyses, around the toe of the weld.
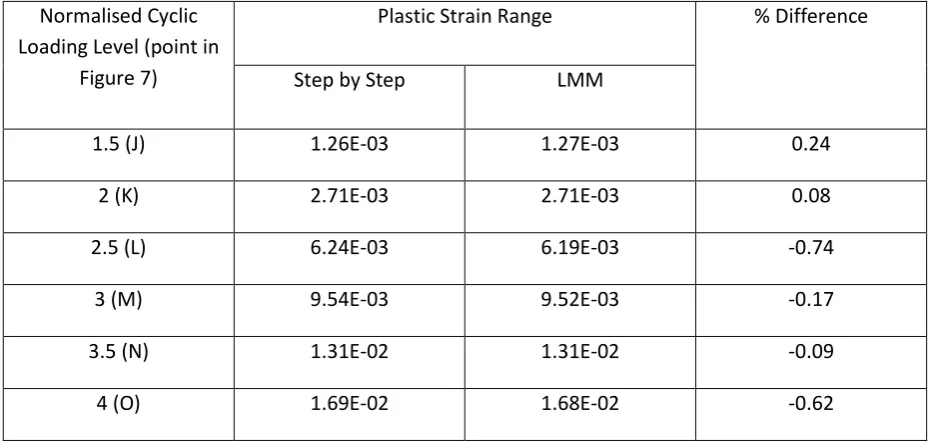
predicted by the LMM at the same level of cyclic loading. Table 2 shows a comparison of the maximum plastic strain range calculated by both methods, and a very good agreement is observed.
5. Internal Pressure and Cyclic Moment Loading
The same geometry of pipe intersection was also analysed subject to a constant internal pressure and a cyclic in-plane bending moment. A half symmetry model was used, and once again the mesh was highly refined in the region of the weld. The length of the main pipe was reduced in an attempt to reduce the number of elements, giving the final model 4200 elements as shown in Figure 11. Abaqus C3D20R elements were used for the analysis as per section 4. The cyclic bending moment is applied as a pure moment to the end of the small pipe, and has two load instances. The Abaqus DLOAD subroutine was used to create a linear distribution of stress across the small pipe, and this was used to create the elastic solution required to start the LMM process. Figure 12 shows the elastic solutions used to begin the LMM calculation process.
5.1 Results
The ratchet interaction diagram was calculated for the dissimilar material pipe intersection subjected to this cyclic moment and constant internal pressure. This is shown in Figure 13, along with the reverse plasticity limit calculated by the LMM shakedown limit procedure (Chen, 2010a). The applied constant internal pressure, P, is normalised against the initial applied internal pressure, P0, of 10MPa. The applied cyclic moment, M, is normalised against the initial applied moment, M0, of
741.95Nm. The form of the interaction diagram differs from that of Figure 4 in that there is a limit to the level of cyclic loading. This is typical of cyclic mechanical loads, which if large enough are able to cause limit state in the component.
From this diagram it is instantly noticeable that there is little interaction between the pressure and moment loads. The ratchet boundary is relatively vertical at low levels of cyclic moment, and is relatively horizontal at low levels of constant pressure. This is easily explained by examining the elastic solutions in Figure 12. The internal pressure primarily affects the main pipe and the region around the crotch corner. There is a large stress concentration here, and all other stresses remain relatively low. Likewise the moment loading primarily affects the small pipe, causing comparatively small stresses in the main pipe. With both loads acting relatively remotely from each other, an interaction is only possible when both loads reach high levels. This occurs at the "corner" of the interaction diagram, where both load levels are high.
stress concentration at the weld from moment loading with the concentration at the crotch corner from pressure loading.
In a finite element study, hypothetical situations can be explored to determine the effect various parameters have on the resulting behaviour. In the pipe intersection analysed here, the room temperature yield stress of the SA508 small pipe is more than double that of the 316 of the main pipe, and the weld material yield is also significantly larger. It was postulated that if the yield stresses of the small pipe and weld were reduced then there may be more of an interaction between the two loads. Figure 15 shows the original results from Figure 13 with two further ratchet boundaries and their accompanying reverse plasticity limit. One is for the case where the entire pipe intersection is made from 316 steel (including the weld), named Case 1. The second is where the main pipe has properties of 316 and the small pipe and weld are given a yield stress which is 75% of that of 316, named Case 2.
Several observations can be made from this set of results. First of all, the limit load for internal pressure is unaffected. This is to be expected as the failure occurs at the crotch corner in the main pipe where the yield stress is unchanged from the original case. The gradient of the ratchet bound at low levels of moment loading is unchanged, meaning that there is no change to the interaction of the loads at these levels of cyclic bending. To gain more of an insight into the interaction at higher levels of cyclic bending moment, the same results were plotted with the cyclic bending moment normalised against the limit moment for the small pipe, ML. This is shown in Figure 16. When the
results are normalised in this way it is clear that the reduced yield stresses of Case 1 and Case 2 cause the interaction to begin at lower levels of normalised cyclic moment. This is confirmed by the contour plots in the transition region, which show the same shift in mechanism as in Figure 14 but at lower values of normalised cyclic bending moment.
6. Conclusion
The Linear Matching Method has been used in this work to calculate the ratchet interaction diagrams for a pipe intersection subject to cyclic thermal and mechanical loading. This example, with three materials and temperature dependent material properties, was chosen to demonstrate the applicability of the new lower bound calculation procedure to problems which are more representative of those seen in industry. The verification provided in this work by full nonlinear elastic-plastic step by step Abaqus analyses confirms the accuracy of the LMM lower and upper bound ratchet limits, plastic strain ranges and the predicted locations of failure.
When the pipe intersection is subject to internal pressure and cyclic thermal loading, failure mechanisms at low levels of thermal loading occurred at the crotch corner. At higher levels of thermal loading the material mismatch has a more significant effect and causes the mechanism to move to the material boundaries.
bending at the limit state. Reduction of the yield stress of the small pipe and weld relative to the main pipe causes the interaction to begin at lower levels of cyclic moment.
Acknowledgements
The authors gratefully acknowledge the support of the Engineering and Physical Sciences Research Council of the United Kingdom, The University of Strathclyde and EDF Energy during the course of this work.
References
Abaqus, 2009. User's Manual Version 6.9.
Ainsworth R.A. (editor), 2003. R5: an assessment procedure for the high temperature response of structures. British Energy Generation Ltd.
Barrera O., Cocks A.F.C., Ponter A.R.S, 2009. Evaluation of the Convergent Properties of the Linear Matching Method for Computing the Collapse of Structural Components. European Journal of Mechanics - A/Solids, 28, 655-667.
British Standards Institute (BSI), 2007. BS EN 10028-7 Flat Products Made for Pressure Purposes Part 7 - Stainless Steels.
Brust F. W., Zhang T., Shim D., Kalyanam S., Wilkowski G., Smith M., Goodfellow A., 2010. Summary of Weld Residual Stress Analyses for Dissimilar Weld Nozzles in: Proceedings of the 2010 ASME Pressure Vessels and Piping Conference, 6, 1521-1529.
Chen H.F., 2010a. Lower and upper bound shakedown analysis of structures with temperature-dependent yield stress. ASME Journal of Pressure Vessel Technology, 132(1):011202 (8 pages). Chen H.F., 2010b. Linear Matching Method for Design Limits in Plasticity. Computers, Materials & Continua, 20(2), 159-183.
Chen H., Ure J., Tipping D., 2012. Calculation of a Lower Bound Ratchet Limit Part 1 - Theory, Numerical Implementation and Verification. European Journal of Mechanics - A/Solids, (volume), (Page Numbers).
Chen H.F., Ponter A.R.S., 2010. A Direct Method on the Evaluation of Ratchet Limit. Journal of Pressure Vessel Technology, 132(4), 041202 (8 pages).
European Pressure Equipment Research Council, 1999. Design By Analysis Manual.
Kim J. W., Lee K., Kim J. S., Byun T. S., 2009. Local Mechanical Properties of Alloy 80/182 Dissimilar Weld Joing Between SA508 G.r1a and F316 SS ant RT and 320oC. Journal of Nuclear Materials, 384, 212-221.
Kim Y., Lee K., Park C., 2006. Limit Loads for Thin-Walled Branch Junctions Under Internal Pressure and In-Plane Bending. International Journal of Pressure Vessels and Piping, 86, 645-653.
Koiter W.T., 1960. General theorems for elastic plastic solids, in: Sneddon J.N., Hill R. (Eds.), Progress in solid mechanics. North Holland, Amsterdam, pp. 167-221.
Lekkerkerker J. G., 1971. The Determination of Elastic Stresses Near Cylinder to Cylinder Intersections. Nuclear Engineering and Design, 20, 57-84.
Melan E., 1936. Theorie statisch unbestimmter systeme aus ideal-plastichem baustoff. Sitzungsber. d. Akad. d. Wiss. Wien 2A(145), 195–218.
Nadarajah C., MacKenzie D., Boyle J. T., 1996. Limit and Shakedown Analysis of Nozzle/Cylinder Intersections Under Internal Pressure and In-Plane Moment Loading. International Journal of Pressure Vessels and Piping, 68, 261-272.
Smith M. C., Muransky O., Bendeich P. J., Edwards L., 2010a. The Impact of Key Simulation Variables on Predicted Residual Stresses in Pressuriser Nozzle Dissimilar Weld Mock-Ups Part 1 - Simulation. in: Proceedings of the 2010 ASME Pressure Vessels and Piping Conference, 6, 1483-1494.
List of Tables
Table 1 - Temperature Dependent Yield Stress for all Three Materials
List of Figures
Figure 1 - Geometry of Pipe Intersection
Figure 2 - Pipe Intersection One Quarter FE Model and Mesh
Figure 3 - Elastic Stresses from a) Internal Pressure b) Linear Temperature Through Thickness and c) Uniform Elevated Temperature
Figure 4 - Shakedown and Ratchet Interaction Diagram Showing Effects of Temperature Dependency
Figure 5 - Plastic Strain Plot Showing Locations of the Ratchet Mechanisms at a) Point A, b) Point C, and c) Point E
Figure 6 - Convergence of Load Multipliers at Points B and D
Figure 7 - Points Chosen for Verification of LMM Results by Step-by-Step Analysis
Figure 8 - Plastic Strain History at Most Critical Model Locations for Load Points F, G, H and I Figure 9 - Rate of Change of Plastic Strain at Point H
Figure 10 - Predicted Plastic Strain Locations for a) Point H b) LMM at ∆θ/∆θ0 =2.5 and c) Point I
Figure 11 - Half Model and Mesh for Cyclic Moment Loading
Figure 12 - Elastic Solutions for a) Internal Pressure and b) Moment Loading, Showing the Application of the Bending Moment
Figure 13 - Ratchet Interaction Diagram for Pressure/Moment Loading Figure 14 - Predicted Failure Mechanisms for Points a) P b) Q and c) R Figure 15 - Ratchet Interaction Diagram for Original Pipe, Case 1 and Case 2
Table 1 - Temperature Dependent Yield Stress for all Three Materials
Temperature (0C)
20 50 100 150 200 250 300 350 400 450
316 220 204 177 162 147 137 127 120 115 112
SA508 472 460 448 430 395
Inconel 82/182
378.6 315.8
Table 2 - Comparison of Plastic Strain Ranges from LMM and Abaqus Step by Step Analysis
Normalised Cyclic Loading Level (point in
Figure 7)
Plastic Strain Range % Difference
Step by Step LMM
1.5 (J) 1.26E-03 1.27E-03 0.24
2 (K) 2.71E-03 2.71E-03 0.08
2.5 (L) 6.24E-03 6.19E-03 -0.74
3 (M) 9.54E-03 9.52E-03 -0.17
3.5 (N) 1.31E-02 1.31E-02 -0.09
[image:14.595.65.532.97.321.2]