City, University of London Institutional Repository
Citation
:
Baronchelli, A., Catanzaro, M. & Pastor-Satorras, R. (2008). Random walks on
complex trees. Physical Review E (PRE), 78(1), 011114. doi: 10.1103/PhysRevE.78.011114
This is the accepted version of the paper.
This version of the publication may differ from the final published
version.
Permanent repository link:
http://openaccess.city.ac.uk/13936/
Link to published version
:
http://dx.doi.org/10.1103/PhysRevE.78.011114
Copyright and reuse:
City Research Online aims to make research
outputs of City, University of London available to a wider audience.
Copyright and Moral Rights remain with the author(s) and/or copyright
holders. URLs from City Research Online may be freely distributed and
linked to.
City Research Online:
http://openaccess.city.ac.uk/
[email protected]
arXiv:0801.1278v2 [cond-mat.stat-mech] 10 Jun 2008
Andrea Baronchelli, Michele Catanzaro, and Romualdo Pastor-Satorras
Departament de F´ısica i Enginyeria Nuclear, Universitat Polit`ecnica de Catalunya, Campus Nord B4, 08034 Barcelona, Spain
(Dated: February 19, 2013)
We study the properties of random walks on complex trees. We observe that the absence of loops reflects in physical observables showing large differences with respect to their looped counterparts. First, both the vertex discovery rate and the mean topological displacement from the origin present a considerable slowing down in the tree case. Second, the mean first passage time (MFPT) displays a logarithmic degree dependence, in contrast to the inverse degree shape exhibited in looped networks. This deviation can be ascribed to the dominance of source-target topological distance in trees. To show this, we study the distance dependence of a symmetrized MFPT and derive its logarithmic profile, obtaining good agreement with simulation results. These unique properties shed light on the recently reported anomalies observed in diffusive dynamical systems on trees.
PACS numbers: 89.75.Hc, 05.40.Fb, 05.60.Cd
I. INTRODUCTION
Diffusion problems on tree structures pop up in a wide range of scientific domains, such as theoretical physics [1, 2, 3], computer science [4, 5], phylogenetic analysis [6] and cognitive science [7]. Moreover, dynam-ics in tree structures have gained a renewed interest in the physics community as a spin-off of the attention devoted to the structural properties of complex networks [8, 9] and dynamical processes taking place on top of them [10]. Thus, along with the widely explored scale-free (SF) net-works [11], also SF trees have started to be used as under-lying topologies for dynamical processes. Interestingly, the absence of loops in trees turns out to have a strong impact on the considered dynamics, and relevant differ-ences between looped networks and tree topologies have been recently reported in several dynamical models, such as the voter model [12], the naming game [13], the ran-dom walk and the pair-annihilation processes [14], and a model for norm spreading [15]. The properties of most dynamical processes on looped network can be reason-ably accounted for by annealed mean-field theories [10], which rely only on information about the degree distribu-tion and degree correladistribu-tions [16], and consider the net-work as maximally random at all other respects. The behavior observed in trees, different from the annealed mean-field predictions, must thus be explained in terms of the non-local constrain of absence of loops imposed in this kind of graphs, which is hard to implement in theoretical approaches.
In this paper we explore the peculiarities induced in dy-namical processes by the absence of loops by considering the simplest possible example, namely the uncorrelated random walk [17, 18]. Several works have been devoted in the past to the study of random walks on complex networks, showing in general a good agreement between theory and simulations on looped networks, while differ-ences were reported in tree networks in Ref. [14]. Here, we find that the global constraint of lack of loops induces a general slowing down of diffusion, as measured by the network coverage and the mean topological displacement
from the origin. As well, it profoundly alters the degree dependence of the mean-first passage time. This is due to the fact that the source-target distance is dominating in trees. In order to account for this features, we study the mean round trip time versus distance and find an analytic expression of its dependence on degree.
II. RANDOM WALKS ON COMPLEX
NETWORKS AND TREES
We consider random walks on general networks defined by a walker that, located on a given vertex of degree k at time t, hops with probability 1/k to one of the k neighbors of that vertex at time t+ 1. We have mea-sured the properties of random walks on growing SF trees created with the linear preferential attachment (LPA) algorithm [11, 19]: at each time step s, a new vertex with m edges is added to the network and connected to an existing vertex s′ of degree k
s′ with probability
Πs→s′ = (ks′ +a)/(2m+a)s. This process is iterated
until reaching the desired sizeN. The resulting network has degree distribution P(k) ∼k−γ with tunable expo-nentγ = 3 +a/m, with γ < 3 for a < 0. For m = 1 the LPA model yields a strict tree topology. Degree cor-relations, measured by the average degree of the nearest neighbors of the vertices of degree k [20], are given by ¯
2
adding z neighbors to a randomly selected leaf (i.e. a vertex whose degree isk= 1) at each time steps(z+ 1 neighbors are added to the first vertex). The resulting tree contains only vertices with degree k = z+ 1, and leaves withk= 1.
To check our results against looped structures, we have considered the uncorrelated configuration model (UCM) [22], yielding uncorrelated networks with any pre-scribed SF degree distribution. The model is defined as follows: (1) Assign to each vertex i in a set of N ini-tially disconnected vertices a degree ki, extracted from the probability distributionP(k)∼k−γ, and subject to the constraintsm≤ki≤N1/2 andPiki even. (2) Con-struct the network by randomly connecting the vertices with P
iki/2 edges, respecting the preassigned degrees and avoiding multiple and self-connections. Using this algorithm, it is possible to create SF networks which are completely uncorrelated. Additionally, by selecting the minimum degreem≥2, we generate connected networks with probability almost 1. The effect of correlations in looped structures can be checked by means of the config-uration model (CM) [9], which is analogous to the UCM, but allows degrees to range in the interval m≤ki ≤N [23]. In all present simulations, we set for looped neworks m= 4, tree networks corresponding to m= 1 (z= 4 for the RC tree).
III. RANDOM WALK EXPLORATION
We start by studying two properties of a random walk that quantify the speed at which it explores its neigh-borhood in the network. The first one is the coverage S(t), defined as the number of different vertices visited by a walker at timet, averaged for different random walks starting from different sources. For looped networks, the coverage reaches after a short transient the functional form [24, 25]SL(t)∼t[43], in accordance with theoreti-cal theoreti-calculations for the Bethe lattice [26], and eventually saturates to SL(∞) = N, due to finite size effects. A scaling form for the coverage has been proposed [24] to be SL(t) = N f(t/N), with f(x) ∼ x for x ≪ 1 and f(x)∼1 forx≫1.
The origin of the scaling of the coverage with system size can be understood by means of a simple dynamic mean-field argument. Let us define ρk(t) as the proba-bility that a vertex of degreekhosts the random walker at timet. During the evolution of the random walk, this probability satisfies, in a general network with a correla-tion pattern given by the condicorrela-tional probabilityP(k′|k)
that a vertex of degreekis connected to another vertex of degreek′ [16], the mean-field equation
∂ρk(t)
∂t =−ρk(t) +k
X
k′
P(k′|k)
k′ ρk′(t). (1)
In the steady state,∂tρk(t) = 0, the solution of this equa-tion, for any correlation pattern, is given by the
normal-0 5 10 15
10-6 10-4 10-2 100
sk
(t) N=104
N=105
N=106
0 5 10 15
kt / (<k>N)
10-6 10-4 10-2 100
sk
(t) CM CM γγ=2.5, k=5=2.5, k=15
UCM γ=3.0, k=5
UCM γ=3.0, k=15
EM, k=5 EM, k=15
CM γ=2.5, k=5
N=106
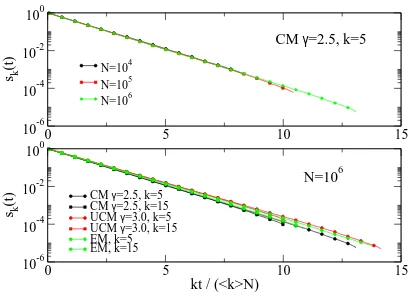
FIG. 1: (Color online) Coverage spectrum sk(t) in looped
complex networks as a function of kt/hkiN. Top: Curves
for the same degree and different network size N. Bottom:
Curves for different degrees and fixed network size.
ized distribution [18, 27]
ρk(t) =
k
hkiN. (2)
Let us now define the coverage spectrum sk(t) as frac-tion of vertices of degree k visited by the random walker at least once. Obviously, we have that S(t) =
NP
kP(k)sk(t). The spectrum sk(t) increases in time as the random walk arrives to vertices that have never been visited. Therefore, at a mean-field level, it fulfills the rate equation
∂sk(t)
∂t =k[1−sk(t)]
X
k′
P(k′|k)
k′ ρk′(t). (3)
Approximatingρk′(t) by its steady-state value (for not
too small times), we obtain
∂sk(t)
∂t = [1−sk(t)]
k
hkiN, (4)
whose solution, with the initial conditionsk(0) = 0 is
sk(t) = 1−exp
− kt
hkiN
. (5)
We therefore are lead to the general scaling expression
S(t)
N = 1−
X
k
P(k) exp
− kt
hkiN
. (6)
In the limit ofkt/hkiN ≪1, we recover the exact result S(t) ∼ t [26]. For SF networks, we obtain within the continuous degree approximation
S(t)
N = 1−(γ−1)m
γ−1Z ∞
m
k−γexp
− kt
hkiN
dk
= 1−(γ−1)Eγ
mt hkiN
[image:3.612.337.541.50.197.2]
10-6 10-4 10-2 100 102
t / N
10-8 10-6 10-4 10-2 100
S(t) / N
CM γ=2.5, N=104
CM γ=2.5, N=105
CM γ=2.5, N=106
UCM γ=3.0, N=104
UCM γ=3.0, N=105
UCM γ=3.0, N=106
EM, N=104 EM, N=105 EM, N=106
FIG. 2: (Color online) Rescaled coverage for looped com-plex networks. We plot in full lines the analytical predictions Eqs. (7) and (8), corresponding to SF and EM networks. Re-sults for CM, UCM, and EM networks have been shifted (top to bottom) in the vertical axis for clarity.
whereEγ(z) is the exponential integral function [28]. For EM networks, on the other hand, we find
S(t)
N = 1−
e m
Z ∞
m
e−k/mexp
− kt
hkiN
dk
= 1−e
−mt/hkiN
1 + mt
hkiN
. (8)
In Fig. 1, we can observe that the scaling predicted by Eq. (5) for the coverage spectrum sk(t) is very well satisfied in looped complex networks, independently of their homogeneous or SF nature, and in this last case, of the degree exponent and the presence or absence of correlations. In Fig. 2, on the other hand, we plot the total coverageS(t)/N, which can be fitted quite correctly by the analytical expressions Eqs. (7) and (8) for SF and EM networks.
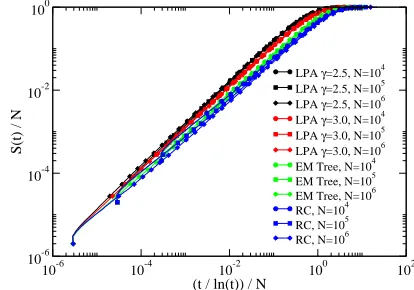
On tree networks we find a different scenario. In Fig. 3 we can see that the coverage spectrum does not scale as predicted by our mean-field argument. While we do not have theoretical predictions for the correct scaling form, a numerical analysis of the total coverage, Fig. 4, shows that, at short times, it grows in trees asST(t)∼t/ln(t), preserving an approximate scaling form
ST(t) =N f
t ln(t)N
, (9)
with a scaling function f(x) that depends slightly on the network details (degree exponent, correlations, etc.). This observation indicates the presence of a general slow-ing down mechanism in the random walk dynamics in trees: the dynamics turns out to be more recurrent and therefore it is more costly to find new vertices during the walk. It is easy to see that this situation will correspond to a walker deep in the leaves of a subtree that has other-wise completely explored. In order to find new vertices, the walker must first find the exit to the subtree. This
0 50 100 150 200 250 300
10-4 10-2 100
sk
(t) N=104
N=105
N=106
0 100 200 300 400 500 600
kt / (<k>N)
10-6 10-4 10-2 100
sk
(t) LPA LPA γγ=2.5, k=5=2.5, k=15
LPA γ=3.0, k=5
LPA γ=3.0, k=15
EM Tree, k=5 EM Tree, k=15
LPA γ=2.5, k=5
N=106
FIG. 3: (Color online) Coverage spectrumsk(t) in tree
net-works as a function ofkt/hkiN. Top: Curves for the same
degree and different network size N. Bottom: Curves for
different degrees and fixed network size. The scaling here is different from the mean-field prediction Eq. (5).
10-6 10-4 10-2 100 102
(t / ln(t)) / N
10-6 10-4 10-2 100
S(t) / N
LPA γ=2.5, N=104
LPA γ=2.5, N=105
LPA γ=2.5, N=106
LPA γ=3.0, N=104
LPA γ=3.0, N=105
LPA γ=3.0, N=106
EM Tree, N=104
EM Tree, N=105
EM Tree, N=106
RC, N=104
RC, N=105
RC, N=106
FIG. 4: (Color online) Rescaled coverage as a function of time
in complex trees. Results for LPA (γ= 2.5), LPA (γ= 3.0),
EM, and RC networks have been shifted (top to bottom) in the vertical axis for clarity.
difficulty in finding new vertices can be directly measured by the time lag ∆tbetween the discovery of two new ver-tices. In Fig. 5 we plot the probability distribution of time lags,P(∆t), computed for the discovery of the first 1% of the network, for looped and tree structures. We observe that, in looped networks, this distribution takes an exponential form, compatible with an almost constant time lag between the discovery of two new vertices. In tree networks, this distribution shows instead long tails, that can be fitted to a lognormal form, indicating that, in some events (i.e. when the walker is trapped in one leaf in a subtree) the discovery of a new vertex can take an unusually large time.
Acute signatures of slowing down can be found also in the analysis of the mean topological displacement (MTD)
¯
[image:4.612.76.278.49.194.2] [image:4.612.338.543.50.196.2] [image:4.612.333.540.278.423.2]4
0 2 4 ln(∆t) 6 8 10
10-8 10-6 10-4 10-2 100
P(ln(
∆
t))
LPA γ=2.5 LPA γ=3.0 RC EM tree
0 5 10 15 20
∆t
10-6 10-4 10-2 100
P(
∆
t)
CM γ=2.5 UCM γ=3.0 EM
FIG. 5: (Color online) Distribution of lag times in tree (top) and looped (bottom) networks can be fitted, respectively, by a log-normal (full lines) and an exponential (dashed line)
dis-tribution. Data refer to graphs of sizeN= 105.
100 101 102 103 104
t
100 101
d
(t)
CM γ=2.5 UCM γ=3.0 EM
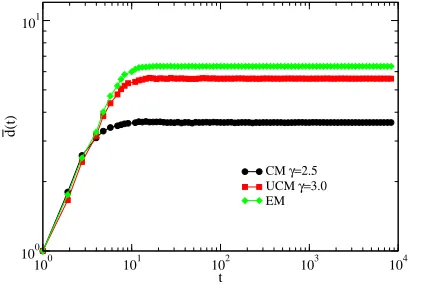
FIG. 6: (Color online) MTD as a function of time for looped
complex networks of sizeN= 106.
realizations. In other works, the mean square topolog-ical displacement (RMSTD) ¯d2(t) [25, 29] was instead
considered. In complex networks, and since the shortest path length is a positive definite quantity, both quantities yield the same scaling result, i.e. ¯d2(t)∼[ ¯d(t)]2 [44].
In looped networks, see Fig. 6, we observe a very rapid increase of the MTD with time. In previous works [29], the growth of the average distance (there measured in-stead as the RMSTD) was found to be a power law,
¯
d(t) ∼ tα at early times in SF networks, with the ex-ponentαdepending on the degree exponent. In our sim-ulations on looped networks generated with different al-gorithms, we do not find a clear signature for a power law behavior, which can only be approximately found in a tiny range of values of t at the very beginning of the walk, even for networks of size N = 106. At large
times, on the other hand, the MTD reaches a plateau, ¯
d(∞) = hd¯i, due to finite size effects. The value of this plateau can be estimated using simple quantitative ar-guments. Assume that the random walker starts from a source vertex of degree k. During its dynamics in the steady state, it visits vertices of degreek′ with
probabil-ity, see Eq. (2),k′/hkiN. On the other hand, vertices of
10-1 100 101 102 103 104
t / <d>
0 0.2 0.4 0.6 0.8 1
d
(t) / <
d
>
CM γ=2.5, Ν=104 CM γ=2.5, Ν=105 CM γ=2.5, Ν=106 UCM γ=3.0, Ν=104 UCM γ=3.0, Ν=105 UCM γ=3.0, Ν=106 EM, N=104 EM, N=105 EM, N=106
FIG. 7: (Color online) Rescaled MTD as a function of time for looped complex networks.
[image:5.612.339.542.50.195.2] [image:5.612.75.281.51.197.2] [image:5.612.74.285.263.405.2]degreekandk′ are, in average, at a topological distance
[30, 31]dk,k′; therefore, we will expect the random walker
to be at an average distance of a source of degreek
hd¯ik=
X
k′
k′P(k′)
hki dk,k′. (10)
A further average over all possibles sources, leads to an average distance of the walker, for any source vertex, given by
hd¯i=X k
P(k)hd¯ik=
X
k
kP(k)
hki dk, (11)
where dk =Pk′P(k′)dk,k′ is the mean topological
dis-tance from any vertex to a given vertex of degreek[31]. The scaling ofhd¯iwith system size can be easily predicted assuming the expressions ofdk in Ref. [31], namely
dk ≃ Aln
N
k(γ−1)/2
(SF networks) (12)
dk ≃ A′lnN−B′k (exponential networks), (13)
whereA,A′andB′are size-independent constants. This
yields in both cases
hd¯i ≃lnN. (14)
Turning to the numerical data for looped networks in Fig. 7, we observe that it is compatible with a scaling behavior of the form
¯
dL(t) =hd¯if
t
hd¯i
. (15)
This scaling indicates that, after a short characteristic timetc ∼ hd¯i ∼lnN, the walker is in average as far as the origin at it can be, and it can therefore freely explore the whole network.
In trees, Fig. 8, on the other hand, we observe a much slower growth of the MTD at early times, which can be approximately fitted with the form
¯
0 0.5 1 1.5 2
ln(t) / <d>1/α
0 0.2 0.4 0.6 0.8 1
d
(t) / <
d
>
N=104 N=105 N=106
LPA γ=2.5
LPA γ=3.0
EM Tree
RC
FIG. 8: (Color online) MTD as a function of time for complex
trees of size N = 106. The exponent α is determined by a
numerical fit from the observed relation ¯dT(t)∼(lnt)α(data
not shown). The values used in Figure areα≃0.91 for LPA
trees with γ = 2.5, α ≃ 1.04 for LPA trees with γ = 3.0,
α≃1.31 for EM trees andα≃1.62 for the RC tree.
where the exponentαdepends on the details of the net-work. The whole function ¯dT(t) is also observed to fulfill the scaling form
¯
dT(t) =hd¯if
lnt
hd¯i1/α
. (17)
This form implies that the characteristic time to es-cape from the neighborhood of the origin scales astc ∼ exp(hdi1/α)∼exp[(lnN)1/α], which means that the ex-ploration process is much more slower in trees, with the walker spending large amounts of time exploring the close vicinity of the origin of the walk. We remark that here the scaling function f(x) displays some further depen-dences on degree exponent, average degree and degree correlations in both looped and tree networks.
The fact that the presence of a tree-like structure slows down the distance explored by a random walker on a net-work, allows to interpret the results presented in Ref. [29], in particular the power-law behavior at initial times of
¯
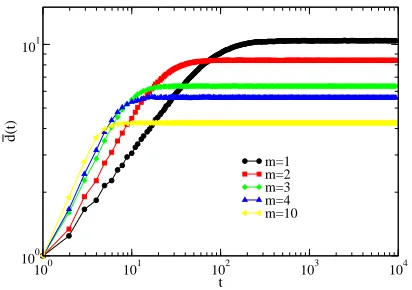
d(t). In fact, in Ref. [29] the substrate for the ran-dom walk simulations were SF networks generated with the CM model with minimum degree m = 1. In this case, simulations were performed on the giant compo-nent. Apart from the possible effect of degree correla-tions for γ < 3, the point is that, for m = 1, traces of tree-like structure are still present in the network, in the form of chains of small degree vertices [32]. Thus, a remnant slowing down effect of the tree component is observed, see Fig. 9, leading to an MTD that, at short times, scales as ¯d(t)∼t0.55for the data atm= 1 shown
in this graph, in excellent agreement with the observation in [29], namely ¯d2(t)∼t1.1 for the RMSTD.
A further remark concerns the relation between our results and the above mentioned analytical calculations for Bethe lattices [26], according to which these struc-tures exhibit a behavior analogous to the one observed in looped networks. The apparent incongruity vanishes
100 101 102 103 104
t
100 101
d
(t)
m=1 m=2 m=3 m=4 m=10
FIG. 9: (Color online) MTD as a function of time for UCM
looped networks (γ = 3.0 andN = 106) with varying
mini-mum degreem.
when noticing that, while Bethe lattices are infinite hier-archical structures, we have focused on complex (i.e. dis-ordered) finite trees. To recover numerically the Bethe lattice behavior, indeed, it is necessary to adopt special algorithms in order to simulate an infinite hierarchical tree [33, 34].
IV. MEAN FIRST-PASSAGE TIME
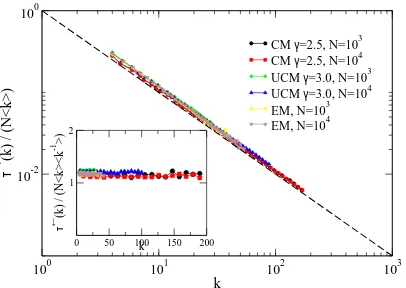
More information about the dynamics of random walks can be extracted from the analysis of the mean first pas-sage time (MFPT) [35]τ(i→j), defined as the average time that a random walker takes to arrive for the first time at vertexj, starting from vertexi[27]. In networks with no translation symmetry, the MFPT from a source i to a target j needs not be equal to the MFTP from source j to target i. Therefore, different reduced MF-PTs can be considered. We can thus define the direct MFTPτ→(k) as the MFPT on a target vertex of degree k, starting from a randomly chosen source vertex, and the inverse MFPTτ←(k) as the MFTP on a randomly target vertex, starting from a source vertex of degreek, namely
τ→(k) = 1
N X
i 1
Nk
X
j∈V(k)
τ(i→j), (18)
τ←(k) = 1
N X
j 1
Nk
X
i∈V(k)
τ(i→j), (19)
[image:6.612.337.543.49.194.2] [image:6.612.77.282.50.197.2]6
100 101 102 103
k
10-2 100
τ
→ (k) / (N<k>)
CM γ=2.5, N=103
CM γ=2.5, N=104
UCM γ=3.0, N=103
UCM γ=3.0, N=104
EM, N=103 EM, N=104
0 50 100k 150 200
1 2
τ
←(k) / (N<k><k
-1>)
FIG. 10: (Color online) Reduced MFPTs as a function of
the degree k for looped complex networks. We recover the
simple mean-field predictionsτ→
L(k)≃ hkiN/k (main figure)
andτ←
L(k)≃ hkihk−1iN (inset).
MFTP to vertexican thus be estimated as the average
τ→(ki) =X
t
tPa(i;t) =
hkiN
ki
. (20)
For the inverse MFPT, we notice that, in a random net-work, after the first hop, the walker loses completely the memory of its source degree, therefore we can approxi-mate
τ←(k) =X
k
P(k)τ→(k) =hkihk−1iN. (21)
Less trivial approaches [27, 37] show in fact that the MFPT from a source vertexito target vertexj depends on the degree of the target vertex as τ(i → j) ∼1/kj, but has a residual dependence on the source vertex and it is actually asymmetric,τ(i→j)6=τ(j→i). This fact could in principle affect the form of the reduced MFPTs in real networks, defined in Eqs. (18) and (19). Fig. 10, however, shows that for looped networks the behavior predicted for random uncorrelated networks turns out to be extremely robust with respect to changes in the topo-logical properties of the network: homogeneous or het-erogenous nature, degree exponent, presence or absence of correlations, etc. [29, 37, 38].
In trees, on the other hand, we find a completely dif-ferent picture, see Fig. 11. Now, the direct MFPT in SF trees decays withkmuch slower than in looped networks. In fact, we can fit it numerically to the form
τT→(k) =C1NlnN−C2Nln(k+C3), (22)
whereC1,C2andC3fitting parameters that depend only
slightly on the network size. The NlnN dependence can be directly observed by plotting τ→
T (1) for different system sizes, as shown in Fig. 12. For homogeneous EM networks, on the other hand, the direct MFPT can be fitted to the form
τT→(k) =D1NlnN−D2N k, (23)
100 101 102 103
k 0
2×10⁴ 4×10⁴ 6×10⁴ 8×10⁴ 1×10⁵
τ
→ (k)
LPA γ=2.5 LPA γ=3.0 τ→
(k) = C1Nln(N) - C2Nln(k+C3)
0 5 10 15 20
k
0
1×10⁵
2×10⁵
τ
→ (k)
EM Tree
τ→(k) = D1Nln(N) - D2Nk
FIG. 11: (Color online) Direct MFPT as a function of the
degreek for SF tree networks (N = 104). Dashed lines
cor-respond to nonlinear fittings to the empirical form Eq. (22).
Inset: Direct MFPT as a function of the degreek for
homo-geneous EM tree networks. The dashed line corresponds to a fitting to the empirical form Eq. (23).
see inset in Fig. 11. The scaling of τ→
T (1) in this case is also checked in Fig. 12. With respect to the inverse MFTP, it is again constant, but now scales with system size as τ←
T (k) ∼ NlnN for all kinds of trees (inset in Fig. 12).
The topological structure of the trees can explain the unusual form of the MFPTs. While in looped networks the number of access paths to the target vertex is re-lated to its degree, on the tree the path is unique, and is given by the one-dimensional set of links and vertices connecting the starting vertex to the target. In this case, the degree of the target is much less important from the point of view of the walker, since finding the target cor-responds to finding a particularleaf (i.e. ak= 1 vertex) of the sub-tree the random walker is exploring. This observation suggests that while in looped networks the MFPT into a vertex is dominated by its degree (because the latter is related the multiplicity of the entry paths to the vertex), in trees the distance between the source and the target can be much more relevant, and thus induce a larger MFPT.
We therefore consider the MFPT as a function of the topological distancedij between the starting vertexiand the target j [37, 39]. Since the distance between two vertices is by definition a symmetric quantity, it seems natural to re-define the MFPT in terms of the symmetric mean round trip time (MRTT)
¯
τ(dij) =τ(i→j) +τ(j →i), (24)
i.e. the average time to go fromi toj and back or vice-versa. It has been recently proved [39] that, for complex scale-invariant networks, the MRTT averaged for all ver-tices at the same distance scales as
¯
τ(d)≃N dDw−Db
, (25)
[image:7.612.77.280.51.195.2] [image:7.612.340.544.51.196.2]net-102 104 106
N
100 102 104 106 108
τ
→ (1) / ln(N)
LPA γ = 2.5 LPA γ = 3.0 EM Tree RC
100 101 k 102 103
1 2
τ
←(k) / Nln(N)
FIG. 12: (Color online) Direct MFPT on leaves in complex
trees as a function of the network sizeN. The observed scaling
is τ→
T (1)∼ NlnN. Inset: Inverse MFPT on complex trees
for different network sizes (N = 103 full colored points,N =
3×10³ light colored points, N = 104 empty points). The
observed scaling is againτ←
T (k)∼NlnN.
0 5 10 15 20 25 30
d
0 5 10 15 20 25 30
τ
(d) / N
LPA γ=3.0, N=104
LPA γ=3.0, N=105
LPA γ=2.5, N=104
LPA γ=2.5, N=105
EM Tree, N=104 EM Tree, N=105 RC, N=104 RC, N=105
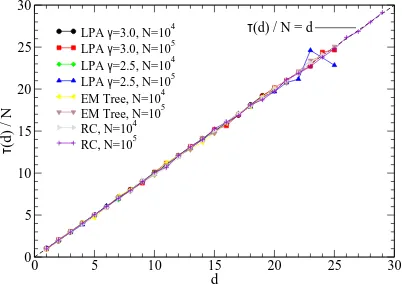
τ(d) / N = d
FIG. 13: (Color online) MRTT ¯τ(d) as a function of the
source-target topological distancedin trees. Different curves
collapse perfectly on ¯τT(d)∼N d.
works [40] corresponding to a tree structure, for which Dw−Db = 1, the authors of Ref. [39] obtained corre-spondingly a linear scaling ¯τT(d)≃N d. We have checked that this linear form holds for different SF, EM and RC trees, see Fig. 13, a result that leads us to conjecture that, for any complex tree,Dw−Db= 1.
We can use the result in Eq. (25) to gain insight on the behavior of the anomalous reduced MFPTs in tree networks. Considering an average over all vertices with the same degree, we have that ¯τ(dkk′) = τ(k → k′) +
τ(k′ →k). Averaging now over k′, we can consider the
reduced MRTT
¯
τ(k) =X
k′
P(k′)[τ(k→k′)+τ(k′→k)] =τ←(k)+τ→(k),
(26) defined as the average time to go from a randomly chosen vertex to a given vertex of degree k, and back (or vice-versa, since the MRTT is symmetric). Now, since ¯τ(dkk′)
100 101 102 103
10-2 10-1 100
N
τ
(k)/
τ
(1)-1
N=1000 N=3000 N=10000
100 101 102 103
k
10-2 10-1 100
N
τ
(k)/
τ
(1)-1
γ=2.5
γ=3.0
FIG. 14: (Color online) Rescaled MRTT ¯τT(t) as a function
of the source degreekand for randomly chosen targets in SF
trees. Predictions of Eq. (30), i.e. Nτ(k)/τ(1)−1 ∼ k(1−γ)/2, are plotted as dashed lines.
is linear indkk′ for tree networks, we have
¯
τ(k)≃X
k′
P(k′)N dkk′ =N dk. (27)
Assuming the scaling ofdkas given by Eqs. (12) and (13), we obtain
¯
τT(k)≃N Aln
N
k(γ−1)/2
(28)
for SF networks and
¯
τT(k)≃N(A′lnN−B′k) (29)
for EM networks. The unknown constant in Eq. (28) can be reabsorbed in the the value of ¯τT(1), to obtain a scaling form with system size for SF networks that reads
¯
τT(k)
¯
τT(1)
∼ 1
lnN ln
N
k(γ−1)/2
. (30)
In Fig. 14 we show that this scaling form is very well satisfied by the MRTT in SF trees, independently of the degree exponent and correlation patterns, at least for in-termediate values of k. The observed bending at small degrees can be ascribed to the presence of a constant in the logarithm analogous to empirical parameter C3 in
Eq. (22), that does not follow from our argument. Finite size effects, on the other hand, are responsible for the deviations present at large degrees, that are indeed more evident in SF trees with smaller values ofγ.
This observations allow us to interpret the anomalous functional form of the reduced MFTPs observed in trees. From Eq. (26), we have
τ→
T (k) = ¯τT(k)−τT←(k). (31)
Writingτ←
T (k)∼CNlnN, from Eq. (28) we obtain, for SF networks,
τT→(k)∼(A−C)NlnN−
A(γ−1)
[image:8.612.336.541.48.193.2] [image:8.612.77.281.51.201.2] [image:8.612.77.278.292.436.2]8
while for homogeneous EM networks, we have
τT→(k)∼(A′−C)NlnN−B′N k, (33)
in agreement with the empirical fitting found in Eqs. (22) and (23).
This argument cannot be extended to looped networks, since here ¯τ(dkk′) is not linear in dkk′. The k
depen-dence of the MRTT can be however trivially obtained from the reduced MFPTs as ¯τL(k) =τ→
L (k) +τL←(k)≃
hkiN(hk−1i+ 1/k).
V. CONCLUSIONS
In this paper we have shown that complex tree-like topologies heavily affect the behavior of a random walk performed on top of them, with a global slowing down of the dynamics and a logarithmic dependence of the first passage time properties in SF networks. These features are intrinsically connected with the complex tree struc-ture and cannot be attributed to the mere presence of leaves, while they are radically different from the ones exhibited by Bethe lattices, i.e. infinite and hierarchical tree structures.
We have studied the random walk exploration prop-erties and we have shown that complex trees induce a slower dynamics, compared to looped networks, for
both the coverage and the mean topological displace-ment problems. Moreover, by means of the analysis of the symmetrized MFPT (the MRTT), we have been able to recognize the different role played by the degreek of the target vertex in looped and tree structures. In the former, a larger degree corresponds to a larger number of access ways to the target vertex. In the latter, on the other hand, the target vertex is always seen as a leaf by the random walker, and its degreek affects the MFPT only through the dependence of the average distancedk between it and the rest of the vertices. These results pro-vide important insights into diffusion problems on trees, and help explaining the characteristic slow dynamics ob-served on diffusive processes taking place on top of tree networks [12, 13, 14]. Moreover, they are also interesting in the study of dynamics in real-world networks, in which the so-called border trees motifs [41] have been recently shown to be significantly present.
Acknowledgments
We acknowledge financial support from the Spanish MEC (FEDER), under project No. FIS2007-66485-C02-01, and additional support from the DURSI, Generalitat de Catalunya (Spain). M. C. acknowledges financial sup-port from Universitat Polit`ecnica de Catalunya.
[1] B. Huberman and M. Kerszberg, J. Phys. A: Math. Gen.
18, L331 (1985).
[2] C. P. Bachas and B. A. Huberman, Phys. Rev. Lett.57,
1965 (1986).
[3] P. Sibani and K. H. Hoffmann, Phys. Rev. Lett.63, 2853
(1989).
[4] E. Lee and D. Raymond, Encyclopedia of
Microcomput-ers11, 101 (1993).
[5] S. Card, J. Mackinlay, and B. Schneiderman,Readings in
Information Visualization: Using Vision to Think (Mor-gan Kaufmann, San Francisco, 1999).
[6] L. Cavalli-Sforza and A. Edwards, Evolution 21, 550
(1967).
[7] D. Fisher, Machine Learning2, 139 (1987).
[8] R. Albert and A.-L. Barab´asi, Rev. Mod. Phys.74, 559
(2002).
[9] S. N. Dorogovtsev and J. F. F. Mendes, Evolution of
networks: From biological nets to the Internet and WWW
(Oxford University Press, Oxford, 2003).
[10] S. Dorogovtsev, A. Goltsev, and J. Mendes,
Crit-ical phenomena in complex networks (2007), e-print arXiv:0705.0010v2.
[11] A.-L. Barab´asi and R. Albert, Science286, 509 (1999).
[12] C. Castellano et al., Phys. Rev. E71, 066107 (2005).
[13] L. Dall’Asta, A. Baronchelli, A. Barrat, and V. Loreto,
Phys. Rev. E74, 036105 (2006).
[14] J. D. Noh and S. W. Kim, Journal of the Korean Physical
Society48, S202 (2006).
[15] M. Nakamaru and S. Levin, Journal of Theoretical
Biol-ogy230, 57 (2004).
[16] M. A. Serrano, M. Bogu˜n´a, R. Pastor-Satorras, and
A. Vespignani, in Large scale structure and dynamics
of complex networks: From information technology to fi-nance and natural sciences, edited by G. Caldarelli and A. Vespignani (World Scientific, Singapore, 2007), pp. 35–66.
[17] B. Hughes, Random walks and random environments
(Clarendon Press, Oxford (UK), 1995).
[18] L. Lov´asz, inCombinatorics, Paul Erd¨os is Eighty(J´anos Bolyai Mathematical Society, Budapest, 1996), p. 353. [19] S. N. Dorogovtsev, J. F. F. Mendes, and A. N. Samukhin,
Phys. Rev. Lett.85, 4633 (2000).
[20] R. Pastor-Satorras, A. V´azquez, and A. Vespignani,
Phys. Rev. Lett.87, 258701 (2001).
[21] A. Barrat and R. Pastor-Satorras, Phys. Rev. E 71,
36127 (2005).
[22] M. Catanzaro, M. Bogu˜n´a, and R. Pastor-Satorras, Phys.
Rev. E71, 027103 (2005).
[23] M. Bogu˜n´a, R. Pastor-Satorras, and A. Vespignani, Euro.
Phys. J. B38, 205 (2004).
[24] D. Stauffer and M. Sahimi, Phys. Rev. E 72, 46128
(2005).
[25] E. Almaas, R. V. Kulkarni, and Stroud, Phys. Rev. E68,
056105 (2003).
[26] B. D. Hughes and M. Sahimi, J. Stat. Mech. 29, 781
(1982).
[27] J. Noh and H. Rieger, Phys. Rev. Lett.92, 118701 (2004).
mathe-matical functions.(Dover, New York, 1972).
[29] L. K. Gallos, Phys. Rev. E70, 046116 (2004).
[30] J. A. Holyst et al., Phys. Rev. E72, 026108 (2005).
[31] S. N. Dorogovtsev, J. Mendes, and J. Oliveira, Phys. Rev.
E73, 056122 (2006).
[32] A. N. Samukhin, S. N. Dorogovtsev, and J. F. F. Mendes,
Phys. Rev. E77, 036115 (2008).
[33] P. Argyrakis and R. Kopelman, Chemical Physics 261,
391 (2000).
[34] D. Katsoulis, P. Argyrakis, A. Pimenov, and A.
Vi-tukhnovsky, Chemical Physics275, 261 (2002).
[35] S. Redner, A Guide to First-Passage Processes
(Cam-bridge University Press, Cam(Cam-bridge (UK), 2001).
[36] M. E. J. Newman, inHandbook of Graphs and Networks:
From the Genome to the Internet, edited by S. Bornholdt and H. G. Schuster (Wiley-VCH, Berlin, 2003), pp. 35– 68.
[37] A. Baronchelli and V. Loreto, Phys. Rev. E73, 026103
(2006).
[38] A. V´azquez, M. Bogu˜n´a, Y. Moreno, R. Pastor-Satorras,
and A. Vespignani, Phys. Rev. E67, 046111 (2003).
[39] S. Condamin, O. B´enichou, V. Tejedor, R. Voituriez, and
J. Klafter, Nature4501, 77 (2007).
[40] C. Song, S. Havlin, and H. Makse, Nature Physics2, 275
(2006).
[41] P. Villas Boas, F. A. Rodrigues, G. Travieso, and
L. Costa,Border trees of complex networks(2007), eprint
arXiv:0706.3403v1.
[42] D. J. Watts and S. H. Strogatz, Nature393, 440 (1998).
[43] In the following, the subscripts L and T will indicate
looped and tree networks, respectively.
[44] Differences can however appear in networks with and un-derlying metric space, such as the Watts-Strogatz