Abstract—The skin of the fuselage and wings of the high
supersonic aircraft is designed using titanium-based thermal shield structures to prevent high temperatures from being transferred into the interior of an aircraft. A thermal shield structure consists of double panels, and the outer skin panels, those in contact with the outside, are designed using thin plates with a thickness of 0.5 to 1.0 mm. Because of acoustic loading caused by aerodynamic flow and engine noise, the thin skin panels are exposed to acoustic loading of more than 150 dB OASPL. Sonic fatigue damage of thin skin panels can occur due to such acoustic loading. In this paper, the time domain and frequency domain fatigue life prediction for a thin titanium skin panels of the high supersonic aircraft subjected to acoustic loading were performed. Frequency domain fatigue damage results were compared with time domain fatigue damage results. In addition, a method for reducing the calculation time of the time domain fatigue life prediction method for the skin panel subjected to acoustic load SPL which is without phase information was studied.
Index Terms—Supersonic vehicle, Acoustic loading, Sound
pressure level, Fatigue life
I. INTRODUCTION
he temperature of the skin of the fuselage and wings of supersonic aircraft is raised to approximately 300 ˚C by aerodynamic heating during supersonic flight. Those structures are designed using titanium-based thermal shield structures to prevent high temperatures from being transferred into the interior of an aircraft [1, 2]. The thermal shield structure consists of double panels, and the skin panels in contact with the outside are designed using thin plates with thickness of 0.5 to 1.0 mm [1]. Because of acoustic loading caused by aerodynamic force and engine noise, thin skin panels are exposed to acoustic loading of more than 150 dB OASPL in the range of 0 to 10 kHz [1, 2]. Fatigue damage of thin skin panels can occur due to such acoustic loading.
Manuscript received March 20, 2018; revised April 17, 2018.
This work was supported by the Agency for Defense Development (ADD-06-201-801-014), Republic of Korea.
E. S. Go is with Chungnam National University, Daejeon, Republic of Korea (e-mail: [email protected]).
I. G. Kim is with Chungnam National University, Daejeon, Republic of Korea (corresponding author: +82-42-821-6684; fax: +82-42-825-9225; e-mail: [email protected]).
M. G. Kim is with Chungnam National University, Daejeon, Republic of Korea (e-mail: [email protected]).
J. S. Park is with Chungnam National University, Daejeon, Republic of Korea (e-mail: [email protected]).
M. S. Kim is with the Agency for Defense Development, Daejeon, Republic of Korea (e-mail: [email protected]).
Therefore, it is necessary to predict the fatigue life of skin panels subjected to acoustic loading.
Fatigue life can be predicted using the time domain fatigue life prediction method and the frequency domain fatigue life prediction method. The time domain fatigue life prediction method is considered to be the most accurate method. However, the time domain fatigue life prediction method requires long time response results to reduce statistical uncertainty and predict stable fatigue life [3]. The frequency domain fatigue life prediction views stress range distribution as a specific probability density function (PDF) and predicts fatigue life using the probabilistic characteristics of this distribution [4, 5]. An advantage of the frequency domain fatigue life prediction method is that fatigue life can be accurately estimated at a relatively low cost compared to the time domain fatigue life prediction approach.
Acoustic loading during the flight of a supersonic aircraft is generally expressed as Sound Pressure Level (SPL) in a frequency band without phase information. Regarding the time domain, it is difficult to predict fatigue life for the acoustic load SPL in the frequency band without phase information. Also, much time is required to calculate the long time response.
In this paper, time domain and frequency domain fatigue life predictions for the thin skin panels of supersonic aircraft subjected to acoustic loading were performed. The supersonic aircraft titanium skin panels were simply modeled as square plates. Frequency response analysis (FRA) was performed, and frequency transfer function was obtained. The acoustic loading history in the time domain was calculated by converting the acoustic loading SPL to a sine series of random phase. Time domain and frequency domain fatigue life predictions were performed using frequency transfer functions and time domain acoustic loading. In addition, several cases of time domain acoustic loading were generated with different phases, and the calculation time reduction method for the time domain fatigue life prediction method was examined by comparing the fatigue life of the structure according to each acoustic loading cases.
II. THEORETICAL BACKGROUND
A. Conversion of Acoustic Loading
The acoustic loading SPL without phase information should be converted to the acoustic loading history of the time domain with phase information to realize time domain fatigue life predictions. The acoustic loading SPL is converted to RMS pressure, as shown in (1), and RMS pressure is converted to acoustic loading PSD, as shown in
Fatigue Life Prediction for Supersonic Aircraft
Skin Panels Subjected to Acoustic Loading
Eun-Su Go, In-Gul Kim, Mun-Guk Kim, Jae-Sang Park, Min-Sung Kim
(2).
5 20
2 10 10
SPL
rms
p (1)
2 rms psd p p f (2) f
is the frequency interval of the SPL. Converted acoustic loading PSD without phase information is converted into sine type acoustic loading history using random phases from 0 to 2. Therefore, when the same acoustic load SPL is converted into a sine acoustic loading history using a random phase, different results are obtained for different random phases.
B. Time Domain Fatigue Life Prediction
The time domain fatigue life prediction method uses cycle counting to calculate the number of cycles according to the amplitude of the stress history in the time domain, and predicts fatigue life using an S-N curve and the Palmgren-Miner rule. The number of constant amplitudes for time signals can be calculated by level crossing counting, peak counting, range counting and rainflow counting. Cycle counting using rainflow counting has been proved by Dowling to be the most accurate [6]. Rainflow counting specified in ASTM E 1049-85 is applied as a standard [7]. Using the Palmgren-Miner's cumulative damage equation as represented in (3), the fatigue damage of structures can be obtained by using the number of each amplitude calculated by rainflow counting and the number of cycles the fatigue failure occurs at each amplitude can be determined from the S-N curve. If the damage is greater than 1, it is predicted that the failure of a structure occurs.
1 1 i n i i f N D N
(3)Fatigue life is given by (4). 1
Fatigue Life D
(4)C. Frequency Domain Fatigue Life Prediction
Frequency domain fatigue life predictions are calculated using the PSD of response stress calculated using frequency transfer function. Using the spectral moment of stress PSD, the probability density function for the stress range distribution defined in the fatigue analysis model is calculated, and fatigue damage is predicted using an S-N curve and the damage equation.
The frequency domain fatigue life prediction method includes the narrowband method and wideband method [9, 10]. The PDF of the narrowband follows the Rayleigh distribution. When the narrowband method is applied to a wideband signal, fatigue life tends to be predicted inaccurately too short. Therefore, fatigue damage due to the wideband effect should be calculated by using a correction
coefficient to correct fatigue damage predicted by the narrowband method or by applying a new PDF capable of wideband expression instead of the Rayleigh distribution. The fatigue life prediction methods considering the wideband effect are the Wirsching and Light method [11], 0.75 method
[12], Dirlik method [13] and Benasciutti and Tovo method [14, 15].
Narrowband Method
The PDF of the narrowband follows the Rayleigh distribution, and cumulative fatigue damage is given by
1
0 0
1
( 2 ) (1 )
2 k NB
D C m k (5)
where 0 is the expected position zero crossing intensity, C and k are the fatigue parameters of the material, m0 is the
0-th spectral moment and is the Euler gamma function [9, 10].
Wirsching and Light Method
The Wirsching and Light corrected the narrowband method using the empirical correction factor as given by (6) [9-11].
WL WL NB
D D (6)
The empirical correction factor is defined as
( )
( ) [1 ( )](1 )b k
WL a k a k
(7)
where ε is the spectral width parameter, the best fitting parametersa k( ) and b k( ) depend on the slope k of the S-N curve.
0.75
Method
The 0.75 method calibrates the narrowband method using
the spectral parameter 0.75 as in (8) [9, 10, 12]. 2
0.75
AL NB
D D (8)
Dirlik Method
Dirlik proposed a probability density function approximating the stress amplitude distribution as shown in (9) by combining the stress amplitude distribution derived from RFC with exponential distribution PDF and the Rayleigh distribution PDF [9, 10, 13].
2 2
2
( )
1 2 2 2
3 2
0
1
( ) [ ]
Z Z Z
Q R
DK
G G Z
p s e e G Ze
Q R
m
(9)
In the Dirlik method, fatigue life intensity is given by
1 2
0 1
2 3
[ (1 )
( 2) (1 )( )]
2 k k DK P k k
D C m G Q k
k
G R G
where Z, G1, G2, G3, R, Q and xm are coefficients and
variables [9, 10, 13].
Benasciutti and Tovo Method
Benasciutti and Tovo proposed a method to calculate fatigue life as a linear combination of the upper and lower fatigue damage intensity limits [9, 10, 14, 15]. The fatigue damage intensity of the Benasciutti and Tovo method is
1
2 2
[ (1 ) k ]
BT NB
D b b D (11)
where b is calculated by approximation with numerical simulation data.
D. The Fatigue Life Prediction Method and The Time Reduction Method for The Time Domain Method
The process of the fatigue life prediction methods for structures subjected to acoustic loading SPL is as follows: The acoustic pressure SPL without phase information is converted to acoustic pressure PSD without phase information, and acoustic pressure history is converted to sine series acoustic pressure using a random phase from the acoustic pressure PSD, as shown in Fig. 1. Acoustic pressure history with phase information is converted to real and imaginary part through Fast Fourier Transform (FFT). The real and imaginary parts of acoustic pressure can be converted to acoustic pressure PSD, and the response stress PSD can be calculated using the acoustic pressure PSD and frequency transfer function of the structure. The calculated response stress PSD can be used to predict fatigue life in the frequency domain. In addition, the real and imaginary parts of acoustic pressure can calculate the real and imaginary parts of response stress using the frequency transfer function of the structure, and can be converted to response stress history using Inverse Fast Fourier Transform (IFFT). The calculated response stress history can be used to predict the fatigue life in time domain.
The time domain fatigue life prediction method requires long time response results to reduce statistical uncertainty and predict stable fatigue life. However, much time is needed to calculate long time responses. Therefore, it is necessary to
examine a method to reduce the calculation time. In this paper, a method to reduce the time needed to calculate fatigue life in the time domain was examined. In order to reduce calculation time, several short time acoustic loading histories with different phases from the same acoustic pressure SPL were generated, and fatigue life was predicted by the average value of fatigue life for each acoustic loading.
III. ANALYSIS
A. Numerical Analysis Model
A supersonic aircraft thin titanium skin panel was selected as the numerical analysis model to examine fatigue life, as shown in Fig. 2. The thin skin panel was simplified to a thin plate of 300×100×0.5 mm and each edge had a fixed boundary condition to simulate boundary conditions similar to the skin panels of actual aircraft. The analysis model used material properties of Ti-6Al-4V, as shown in Table I. Acoustic loading was assumed to be pressure uniformly applied over the entire skin panel.
Fig. 2. The numerical analysis model.
A. Modal Analysis and Frequency Response Analysis The modal analysis was performed to obtain the mode shape and natural frequency of the analysis model. The frequency response analysis was performed to calculate the frequency transfer function of the analysis model. The frequency response analysis was performed with a 2D shell element using MSC. Nastran, and the mesh size were 10 mm. The frequency range of the analysis was 0~1000 Hz, in 0.1 Hz steps. The stress of the analysis model was calculated at the center of the model. The frequency transfer function calculated through the frequency response analysis was converted into a frequency transfer function for PSD using (12) [9].
2
( ) ( ) ( )
SS FF
S f H f S f (12)
B. Fatigue Analysis
The time domain acoustic loading history was calculated by converting the acoustic loading SPL to a sine series of random phase. Time domain and frequency domain fatigue life predictions were performed using the frequency transfer function and time domain acoustic loading. The time domain fatigue life was predicted using rainflow counting, an S-N curve, and Palmgren-Miner's cumulative damage equation. The frequency domain fatigue life prediction was made using the narrowband method, the Wirsching-Light method, the
0.75
method, the Dirlik method, and the Benasciutti-Tovo method.
IV. RESULTS AND DISCUSSION
A. Conversion of Acoustic Loading Results
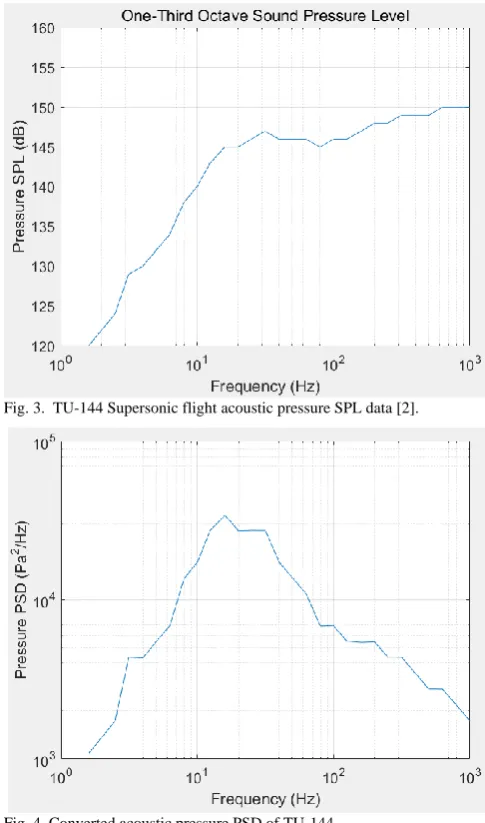
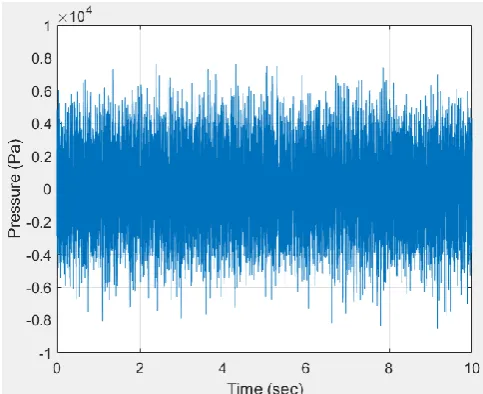
The flight acoustic pressure SPL of the actual supersonic aircraft TU-144 was used as the acoustic loading SPL, as represented in Fig. 3 [2]. The acoustic loading SPL of a 1/3 octave band was converted to acoustic pressure PSD in the frequency domain as shown in Fig. 4. The converted acoustic pressure PSD was converted into time domain acoustic pressure history using a random phase. The converted acoustic pressure history displayed in Fig. 5 was used as a reference, and ten acoustic pressure histories with different phases were generated. The ninth acoustic pressure history is shown in Fig. 6. Because the phase was different, the first and ninth acoustic pressure histories were different.
TABLEI
MATERIAL PROPERTIES OF TI-6AL-4V Property Unit Value Elastic modulus GPa 113 Poisson’s ratio 0.32 Density 3
/
[image:4.595.303.546.61.473.2]kg m 4470
Fig. 5. Converted acoustic pressure history of TU-144 (1st).
Fig. 4. Converted acoustic pressure PSD of TU-144.
[image:4.595.307.546.491.687.2]B. Modal Analysis Results
The mode shapes of the analysis model are shown in Fig. 7, and the natural frequencies of each mode are shown in Table Ⅱ. It was confirmed that the center of the plate was excited at mode #1, #3, #5 and #10.
C. Frequency Response Analysis Results
The frequency response analysis was performed to calculate the frequency transfer function of the analysis model. The frequency transfer function is shown in Fig. 8. It was confirmed that a high response occurred at the same frequency as the excitation mode at the center of the plate.
D. Fatigue Analysis Results
The fatigue life prediction results are shown in Fig. 9. The frequency domain fatigue life prediction results were more conservatively predicted than the time domain fatigue life prediction results calculated using rainflow counting. Regarding the frequency domain fatigue life prediction results, the narrowband method predicted the most conservative results, and the Wirsching Light method predicted a long fatigue life. The time domain fatigue life predictions were made using 10 seconds of response stress data to reduce the calculation time. It was too time consuming to calculate the response stress of a long time. Therefore, it is expected that there will be errors in the time domain fatigue life prediction results using response stress with a duration of 10 seconds.
E. Time Reduction Method Results
[image:5.595.309.544.49.233.2]To predict precise fatigue life, time domain fatigue life predictions must be based on long duration response stress. However, it is time consuming to calculate long duration response stress using the frequency transfer function and acoustic load history. In order to reduce computation time and improve accuracy, several acoustic load histories with random phases were generated, and fatigue life in the time domain was predicted. The fatigue life prediction results based on the acoustic loading histories of several cycles are
Fig. 8. Frequency transfer function of the analysis model. Fig. 6. 9th converted acoustic pressure history of TU-144.
Fig. 9. Time domain and frequency domain fatigue life prediction results (t=0.5mm).
TABLEⅡ
NATURAL FREQUENCY OF THE ANALYSIS MODEL
Mode Natural
frequency Mode
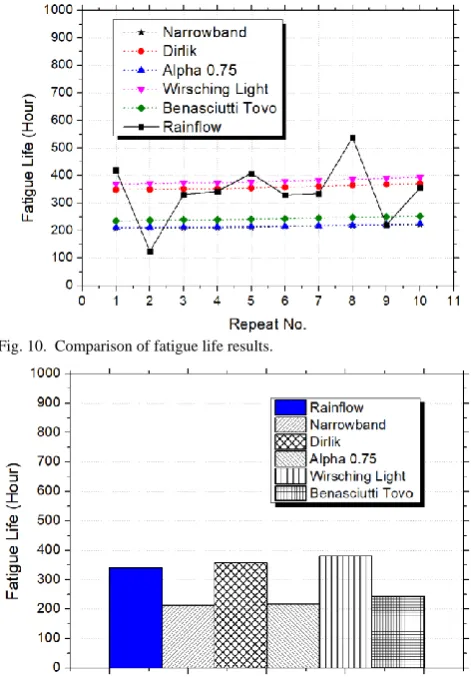
[image:5.595.46.288.50.247.2] [image:5.595.55.279.343.464.2] [image:5.595.311.543.462.618.2]shown in Fig. 10. Since the acoustic loadings of several cycles were calculated through the same SPL, the frequency domain fatigue life prediction results were calculated to be virtually equal. However, the time domain fatigue life predictions calculated by rainflow counting were wide ranging from 125.1 to 538.3 hours. It was confirmed that the differences in the time domain fatigue life prediction results occurred largely according to the phase of acoustic loading. Using the response stress history of a long duration, the differences in the time domain fatigue life prediction results according to acoustic loading is reduced. Therefore, the results of the time domain fatigue life predictions calculated using acoustic load history with different phases were used as the average values to have the same effect. The fatigue life prediction results using the average values are shown in Fig. 11. It was confirmed that the average values of the time domain fatigue life prediction results were similar to the average values of the Dirlik method.
V. CONCLUSION
In this paper, time domain and frequency domain fatigue life predictions for a supersonic aircraft thin skin panel subjected to acoustic loading were examined. The supersonic aircraft titanium skin panel was simply modeled using a rectangular plate. Frequency response analysis was performed, and frequency transfer function was obtained. The acoustic loading history regarding the time domain was calculated by converting the TU-144 acoustic loading SPL to a sine series of random phase. Time domain and frequency
domain fatigue life predictions were realized using frequency transfer function and time domain acoustic loading. The frequency domain fatigue life prediction results were more conservatively predicted than the time domain fatigue life prediction results calculated using rainflow counting. Regarding the frequency domain fatigue life prediction results, the narrowband method realized conservative predictions whereas the Wirsching Light method predicted a long fatigue life.
In addition, several cases of time domain acoustic loading were generated with different phases, and a calculation time reduction method for the time domain fatigue life prediction method was examined by comparing the fatigue life of the structure according to each acoustic loading case. Frequency domain fatigue life prediction results were shown to be approximately equal. However, the time domain fatigue life prediction results calculated by rainflow counting were wide ranging. The average value was calculated in order to have the same effect as the fatigue life results predicted by the long time response stress history. It was confirmed that the average value of the time domain fatigue life prediction results was similar to the average value of the Dirlik method.
REFERENCES
[1] R. D. Blevins, D. Bofilios, I. Holehouse, V. W. Hwa, A. L. Laganelli, P. Pozefsky and M. Pierucci, Themo-vibro-acoustic loads and fatigue of
hypersonic flight vehicle structure, Goodrich Aerostructures Group,
Final Report, 2009.
[2] T. Beier and P. Heaton, High speed research program sonic fatigue
summary report, The Boeing Company, St. Lousi, Missouri, USA,
2005.
[3] J. B. Park, C. H. Kang, K. S. Kim, J. M. Choung and C. H. Yoo, “A study on frequency domain fatigue damage prediction models for wide-banded bimodal stress range spectra,” Journal of the Society of
Naval Architects of Korea, vol. 48, no. 4, pp. 299-307, 2011.
[4] B. L. Clarkson, Stresses in skin panels subjected to random acoustic
loading, Technical Report, Institute of Sound and Vibration Research,
Southampton Univ., United Kingdom, 1967.
[5] Y. Zhou, W. Wu, Z. Tan and Q. Fei, “Temperature dependence of acoustic fatigue life for thermal protection structures,” Theoretical and
Applied Mechanics Letters, vol. 4, no. 2, 2014.
[6] N. E. Dowling, “Fatigue failure predictions for complicated stress-strain histories”, Journal Materials, vol. 7 no. 1, pp. 71-87, 1972. [7] ASTM E 1049-85 (2005), Rainflow counting method, 1987.
[8] N. W. M. Bishop, The use of frequency domain parameters to predict
structural fatigue, PhD Thesis, University of Warwick, 1988.
[9] M.Mršnik, J. Slavič and M. Boltežar, “Frequency domain methods for a vibration-fatigue-life estimation-Application to real data,” International journal of fatigue, vol. 47, pp. 8-17, 2013.
[10] T. Irvine, Estimation fatigue damage from stress power spectral
density functions revision A, Vibrationdata, 2014.
[11] P. H. Wirsching and M. C. Light, “Fatigue under wide band random stresses,” Journal of the Structural Division, vol. 105, issue 7, pp. 1593-1607, 1980.
[12] D. Benasciutti, Fatigue analysis of random loadings, PhD Thesis, University of Ferrara, Italy, 2004.
[13] T. Dirlik, Application of Computers in Fatigue Analysis, PhD Thesis, University of Warwick, 1985.
[14] R. Tovo, “Cycle distribution and fatigue damage under broad-band random loading,” International Journal of Fatigue, vol. 24, no. 11, pp. 1137-1147, 2002.
[15] D. Benasciutti and R. Tovo, “Spectral methods for lifetime prediction under wide-band stationary random processes.” International Journal
of Fatigue, vol. 27, no. 8, pp. 867-877, 2005.
[image:6.595.48.284.284.623.2][16] A. Halfpenny and F. Kihm, “Rainflow cycle counting and acoustic fatigue analysis techniques for random loading”, 10th International Conference on Recent Advances in Structural Dynamics RASD, 2010. Fig. 11. Results of fatigue life predictions using average values.