QUARTERLY
ECONOMIC
COMMENTARY
SPRING
201
8
KIERAN MCQUINN
,
CONOR O'TOOLE
, PHILIP ECONOMIDES AND
TERESA MONTEIRO
ECONOMIC
FORECASTING
March
201
8
QUARTERLY ECONOMIC COMMENTARY
Kieran McQuinn
Conor O’Toole
Philip Economides
Teresa Monteiro
Spring 2018
The forecasts in this Commentary are based on data available by 15 March 2018
Draft completed on 16 March 2018
A subscription to the Quarterly Economic Commentary costs €327 per year, including VAT and postage.
© The Economic and Social Research Institute, Whitaker Square, Sir John Rogerson’s Quay, Dublin 2.
ISBN 978-0-7070-0452-5 ISSN 0376-7191
DOI https://doi.org/10.26504/qec2018spr
The Economic and Social Research Institute is an independent research institute working towards a vision of ‘Informed policy for a better Ireland’. The ESRI seeks to support sustainable economic growth and social progress in Ireland by providing a robust knowledge base capable of providing effective solutions to public policy challenges.
The Institute was founded in 1960 by a group of senior civil servants, led by Dr T.K. Whitaker, who identified the need for independent and in-depth research to support the policymaking process in Ireland. Since then, the Institute has remained committed to independent research and its work is free of any expressed ideology or political position. The Institute publishes all research reaching the appropriate academic standard, irrespective of its findings or who funds the research.
The ESRI brings together leading experts from a variety of disciplines who work together to break new ground across a number of research initiatives. The expertise of its researchers is recognised in public life and researchers are represented on the boards and advisory committees of several national and international organisations.
ESRI researchers uphold the highest academic standards. The quality of the Institute’s research output is guaranteed by a rigorous peer review process. Research is published only when it meets the required standards and practices. Research quality has also been assessed as part of two peer reviews of the Institute, in 2010 and 2016.
ESRI research findings are disseminated widely in books, journal articles and reports. Reports published by the ESRI are available to download, free of charge, from its website. ESRI staff members communicate research findings at regular conferences and seminars, which provide a platform for representatives from government, civil society and academia to discuss key findings from recently published studies and ongoing research.
The Commentary is edited by Kieran McQuinn and Conor O’Toole. Kieran McQuinn is Research Professor and Conor O’Toole is a Senior Research Officer at the Economic and Social Research Institute (ESRI). Philip Economides and Teresa Monteiro are Research Assistants at the ESRI.
Special Articles are published in the QEC in order to foster high-quality debate on
various aspects of the Irish economy and Irish economic policy. They are subject to refereeing prior to publication.
TABLE OF CONTENTS
Summary Table ... ii
National Accounts 2017, 2018, 2019 ... iii
CHAPTERS The Irish Economy – Forecast Overview ... 1
The International Economy ... 3
The Domestic Economy ... 12
General Assessment ... 50
Detailed Forecast Tables ... 53
SUMMARY TABLE
2015 2016 2017 2018 2019 Output (Real Annual Growth %)
Private Consumer Expenditure 4.2 3.3 1.9 2.4
3.0
2.5
2.6
9.5
8.7
5.9
5.6
7.6
7.7
3.8
3.6
3.5
3.33.1
2.5
Public Net Current Expenditure 1.8 5.3 1.8 2.5 3.0
Investment 27.9 61.2 -22.3 12.6 13.3
Exports 38.4 4.6 6.9 7.4 7.8
Imports 26.0 16.4 -6.2 9.7 11.0
Gross Domestic Product (GDP) 25.6 5.1 7.8 4.8 3.9
Gross National Product (GNP) 16.4 9.6 5.2 4.7 3.9
Prices (Annual Growth %)
Consumer Price Index (CPI) -0.3 0.0 0.4 0.7 1.1
Growth in Average Hourly Earnings 1.4 1.7 2.1 2.5 3.5
Labour Market
Employment Levels (ILO basis (‘000)) 2,058 2,133 2,195 2,254 2,298
Unemployment Levels (ILO basis (‘000)) 226 195 158 129 108
Unemployment Rate (as % of Labour Force) 10.0 8.4 6.7 5.4 4.5
Public Finance
General Government Balance (€bn) -5.0 -1.8 -0.8 0.5 1.8
General Government Balance (% of GDP) -1.9 -0.7 -0.3 0.2 0.6
General Government Debt (% of GDP) 76.9 72.8 70.9 68.0 64.2
External Trade
Balance of Payments Current Account (€bn) 28.6 9.2 37.1 29.4 23.7
Current Account (% of GNP) 13.9 4.1 15.4 11.6 8.9
Note: Detailed forecast tables are contained in an Appendix to this Commentary.
NATIONAL ACCOUNTS 2017
A: EXPENDITURE ON GROSS NATIONAL PRODUCT2016 2017 Change in 2017 € bn € bn Value Price Volume
Private Consumer Expenditure 96.6 99.7 3.2 1.3 1.9
Public Net Current Expenditure 28.4 29.5 4.2 -2.3 1.8
Gross Fixed Capital Formation 87.7 69.5 -20.8 2.0 -22.3
Exports of Goods and Services 335.0 355.6 6.1 -0.7 6.9
Physical Changes in Stocks 2.4 2.0
Final Demand 550.1 556.3 1.1 0.1 1.0
less:
Imports of Goods and Services 274.4 260.1 -5.2 1.1 -6.2
Statistical Discrepancy -0.1 -0.1
GDP at Market Prices 275.6 296.1 7.5 -0.4 7.8
Net Factor Payments -48.8 -54.9
GNP at Market Prices 226.7 241.2 6.4 1.1 5.2
B: GROSS NATIONAL PRODUCT BY ORIGIN
2016 2017 Change in 2017 € bn € bn € bn %
Agriculture 3.2 3.3 0.1 2.0
Non-Agriculture: Wages, etc. 80.3 84.4 4.2 5.2
Other 107.4 117.6 10.1 9.4
Adjustments: Stock Appreciation 0.4 0.4
Statistical Discrepancy 0.1 0.1
Net Domestic Product 191.4 205.8 14.4 7.5
Net Factor Payments -48.8 -54.9 -6.1 12.5
National Income 142.6 150.9 8.3 5.8
Depreciation 64.5 69.4 5.0 7.8
GNP at Factor Cost 207.0 220.3 13.3 6.4
Taxes less Subsidies 19.7 20.9 1.2 5.9
GNP at Market Prices 226.7 241.2 14.4 6.4
C: BALANCE OF PAYMENTS ON CURRENT ACCOUNT
2016 2017 Change in 2017 € bn € bn € bn
X – M 60.8 95.2 34.5
F -47.6 -53.8 -6.1
Net Transfers -3.8 -4.3 -0.5
Balance on Current Account 9.2 37.1 27.9
NATIONAL ACCOUNTS 2018
A: EXPENDITURE ON GROSS NATIONAL PRODUCT2017 2018 Change in 2018 € bn € bn Value Price Volume
Private Consumer Expenditure 99.7 103.1 3.4 1.0 2.4
Public Net Current Expenditure 29.5 30.6 3.5 1.0 2.5
Gross Fixed Capital Formation 69.5 80.4 15.7 2.8 12.6
Exports of Goods and Services 355.6 385.8 8.5 1.0 7.4
Physical Changes in Stocks 2.0 3.0
Final Demand 556.3 603.0 8.4 1.2 7.1
less:
Imports of Goods and Services 260.1 294.9 13.4 3.4 9.7
Statistical Discrepancy -0.1 -0.1
GDP at Market Prices 296.1 308.0 4.0 -0.7 4.8
Net Factor Payments -54.9 -57.7
GNP at Market Prices 241.2 250.3 3.8 -0.9 4.7
B: GROSS NATIONAL PRODUCT BY ORIGIN
2017 2018 Change in 2018 € bn € bn € bn %
Agriculture 3.3 3.4 0.1 2.5
Non-Agriculture: Wages, etc. 84.4 88.9 4.5 5.3
Other 117.6 120.6 3.0 2.5
Adjustments: Stock Appreciation 0.4 0.4
Statistical Discrepancy 0.1 0.1
Net Domestic Product 205.8 213.3 7.5 3.7
Net Factor Payments -54.9 -57.7 -2.8 5.1
National Income 150.9 155.6 4.8 3.2
Depreciation 69.5 73.1 3.6 5.2
GNP at Factor Cost 220.3 228.7 8.4 3.8
Taxes less Subsidies 20.9 21.6 0.7 3.4
GNP at Market Prices 241.2 250.3 9.1 3.8
C: BALANCE OF PAYMENTS ON CURRENT ACCOUNT
2017 2018 Change in 2018 € bn € bn € bn
X – M 95.2 90.7 -4.5
F -53.8 -56.5 -2.7
Net Transfers -4.3 -4.8 -0.5
Balance on Current Account 37.1 29.4 -7.7
NATIONAL ACCOUNTS 2019
A: EXPENDITURE ON GROSS NATIONAL PRODUCT2018 2019 Change in 2019 € bn € bn Value Price Volume
Private Consumer Expenditure 103.1 106.8 3.5 1.0 2.5
Public Net Current Expenditure 30.6 31.8 4.1 1.0 3.0
Gross Fixed Capital Formation 80.4 93.4 16.2 2.6 13.3
Exports of Goods and Services 385.8 423.5 9.8 1.8 7.8
Physical Changes in Stocks 3.0 3.0
Final Demand 603.0 658.5 9.2 1.8 7.3
less:
Imports of Goods and Services 294.4 335.4 13.7 2.4 11.0
Statistical Discrepancy -0.1 -0.1
GDP at Market Prices 308.1 323.0 4.9 0.9 4.8
Net Factor Payments -57.7 -60.0
GNP at Market Prices 250.3 263.1 5.1 1.2 4.7
B: GROSS NATIONAL PRODUCT BY ORIGIN
2018 2019 Change in 2019 € bn € bn € bn %
Agriculture 3.4 3.4 0.0 1.4
Non-Agriculture: Wages, etc. 88.9 93.7 4.8 5.4
Other 120.6 126.4 5.9 4.9
Adjustments: Stock Appreciation 0.4 0.4
Statistical Discrepancy 0.1 0.1
Net Domestic Product 213.3 224.0 10.7 5.0
Net Factor Payments -57.7 -60.0 -2.3 3.9
National Income 155.6 164.1 8.4 5.4
Depreciation 73.1 76.7 3.6 4.9
GNP at Factor Cost 228.7 240.7 12.0 5.3
Taxes less Subsidies 21.6 22.3 0.8 3.5
GNP at Market Prices 250.3 263.1 12.8 5.1
C: BALANCE OF PAYMENTS ON CURRENT ACCOUNT
2018 2019 Change in 2019 € bn € bn € bn
X – M 90.7 87.8 -2.9
F -56.5 -58.7 -2.2
Net Transfers -4.8 -5.3 -0.5
Balance on Current Account 29.4 23.7 -5.6
The Irish Economy – Forecast Overview
Initial official estimates indicate that the Irish economy grew by 7.8 per cent in 2017. Preliminary data for 2018 indicate that the economy looks set to experience further expansion in the present year. Strong domestic sources of growth along with improving international conditions lead to an expected growth rate of 4.8 per cent in 2018. We also expect that these components will result in growth of approximately 3.9 per cent in 2019. In preparing forecasts for 2019, we assume that a European Economic Agreement (EEA) will exist between the UK and the EU.
Assessing the continued strong performance of the Irish economy is still bedevilled by difficulties with the National Accounts. Estimates of overall output growth as well as some of the major components of growth, investment and the terms of trade, are influenced by large transactions of a select number of firms. While there are ongoing efforts to provide additional indicators of economic activity, it is now apparent that a more comprehensive approach to the preparation of the National Accounts is required. As well as the standard set of indicators, a parallel set of accounts which are not impacted by these large transactions should also be prepared. Such accounts should be available on both the output and the expenditure side.
From a policy perspective, this becomes all the more pressing given the persistently strong rates of growth experienced in recent years, thereby giving rise to the possibility of overheating in the domestic economy. It is almost impossible to derive accurate estimates of sustainable economic growth based on the current set of National Accounts. Given the large amount of public investment proposed in the recent national development plan, it is imperative that reliable estimates of sustainable economic growth are available so that policymakers can accurately gauge when the economy is encountering capacity constraints.
for the average household between €892 (increase in non-tariff trade costs) and €1,360 (tariffs plus other trade cost increases). Along with the estimated impact of a hard Brexit on Irish fiscal space in Garcia (2017),1 this represents another tangible example of how a hard Brexit would impact the domestic economy.
1
The International Economy
Forecasts for the international economy have been recently revised upwards in light of robust, well-distributed global growth. Contributing factors towards this improved outlook include the strong performance among major nations such as Germany, Spain, Canada and China.2 This, coupled with newly passed US tax policy adjustments, has resulted in IMF projections for global growth in 2017 rising by 0.1 percentage points to 3.7 per cent. Global growth is expected to accelerate to 3.9 per cent in 2018 and 2019.
The Eurozone maintains its improving performance as record-low interest rates look likely to be maintained in the short run. The combined effects of prolonged accommodative monetary policy, strong labour market performance and robust consumer sentiment are important components of current growth and look likely to persist over the short to medium term. While all of these factors are indicative of a recovering economy, the annualised inflation rate for the Euro Area remains relatively muted at 1.3 per cent in January 2018. Gros (2018) addresses this issue in a recent CEPS report, suggesting inflation is largely under-estimated in the Euro Area relative to other economic regions. This is due to the Euro Area’s exclusion of the cost of owner occupied housing, which is included in US statistics.3 When housing is incorporated into inflation estimates, the Euro Area rate is closer to the 2 per cent inflation rate target. FocusEconomics estimates European GDP growth of 2.5 per cent for 2017 while unemployment should fall below double digits to 9.1 per cent. The improved Eurozone performance increases the probability that the ECB will begin to unwind exceptional monetary policy measures and increase the policy rate.
Gross Domestic Product in the UK is estimated by the Office of National Statistics (ONS) to have increased by 1.7 per cent in 2017 compared with growth of 1.9 per cent in 2016. In our previous Commentary, we considered in detail the UK and noted that declining UK productivity growth was evident even before the Brexit referendum had occurred. Recent data from the UK suggest moderate growth will occur in 2018, however continued uncertainty regarding the exact nature of Brexit still hangs over the medium-term outlook. Since the referendum in Q2 2016, the Sterling to Euro exchange rate has depreciated by 12.8 per cent, while there have been substantial levels of volatility in net investment; an immediate net outflow of funds in 2016 was followed by a significant inflow in 2017. The
2
IMF, World Economic Outlook Update, January 2018.
3
recent weakness of the Pound has resulted in the value of imports increasing significantly. This has resulted in UK inflation rates reaching 3 per cent, far above the Bank of England’s target rate. The latest Bank of England commentaries suggests rates may increase faster than previously expected in order to counteract these forces. Consumption should thus remain subdued as real wages are likely to remain static. Compared with other advanced economies, the outlook for the UK economy seems to be the most precarious which is problematic for Ireland given our strong economic ties.
The short-term growth outlook for the US has improved significantly, largely due to the introduction of major expansionary fiscal policy measures. In 2017, the US economy grew by 2.3 per cent with unemployment rates falling by 0.5 percentage points to 4.4 per cent. Significant tax reductions and windfalls from tax holidays are expected to increase US growth in 2018. The temporary nature of the tax holiday may contribute towards increased Balance of Payment inflows on a short-term basis. Introducing these stimulative policy measures during the current stage of the business cycle does risk overheating the US economy. An element of overheating may have manifested itself through the higher than expected US inflation rate of 2.1 per cent in January. Recent comments from the new Chairman of the Federal Reserve suggest that the US economy may be facing a period of gradual interest rates increases.4
Elsewhere in January, the Bank of Japan maintained its policy of quantitative easing in order to reach 2.0 per cent inflation. Japan’s trade outlook has improved given that the 11 remaining countries to the Trans-Pacific Partnership are expected to sign the deal in early March. Although growth rates improved to 1.7 per cent this year, the possibility of reduced labour supply threatens to slow further growth. For the first time in over two decades, unemployment fell to 2.8 per cent as of December 2017. The ratio of jobs to jobseekers rose for the month to 1.59:1 suggesting there are currently 159 openings for every 100 job seekers within the labour market. Improved labour market activity has not fed into wage growth with private consumption still weak as a result.
In 2017, China surpassed the government’s GDP target of 6.5 per cent growth for the year by 0.3 percentage points. Investment growth has moderated as the Chinese government attempts to rebalance growth towards services from high-capital intensity industries and also tries to reduce industrial pollution. According to the National Bureau of Statistics of China, the services sector now dominates GDP contributions, outpacing manufacturing since 2015. The improved global
4
outlook has resulted in the Chinese economy moving above target GDP growth rates through improvements in trade. More generally, other developing countries have continued benefiting from improved global demand with global trade volumes expected to increase by 5.9 per cent for emerging market economies. According to revisions in the IMF’s global outlook, Asian economies are particularly resurgent, averaging 4.7 per cent GDP growth for 2017. Latin American economies are expected to grow by 1.3 per cent, after contracting marginally by 0.7 per cent in 2016.
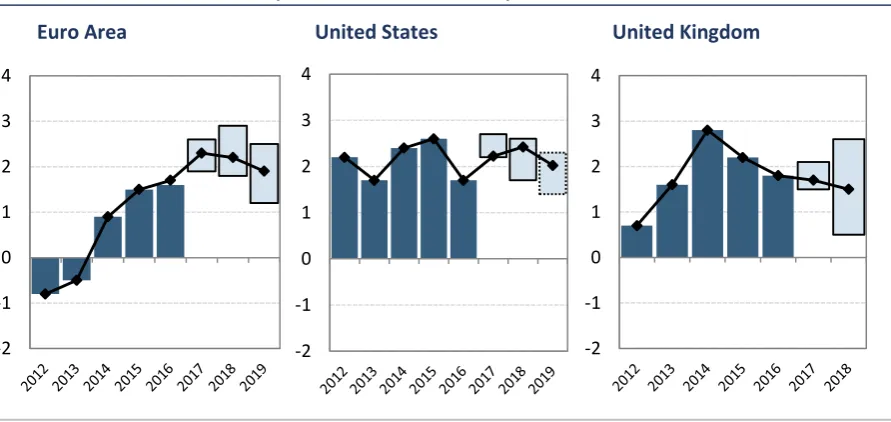
[image:16.595.76.522.381.592.2]Figure 1 summarises the forecasts for GDP growth produced by the major institutions of their respective economies. The outlook overall continues to remain positive over the next two years, with the majority of experts adding upward revisions to forecasts for both the Euro Area and the United States. HM Treasury has not yet released forecasts for 2019, but between Oxford Economics, NIESR, IMF and OBR growth projections suggest an increase in 2019 of 1.8 per cent for the UK.
FIGURE 1 REAL GDP GROWTH (% CHANGE, YEAR-ON-YEAR)
Euro Area United States United Kingdom
Sources: FocusEconomics, IMF, OECD, HM Treasury and Federal Reserve.
I
MPLICATIONS FORI
RISHE
XPORTS,
I
MPORTS AND THEB
ALANCE OFP
AYMENTSIn 2017, the Irish economy registered a 7.8 per cent annual increase in GDP. This growth was heavily influenced by the volatile nature of Irish trade balances. In Figure 2, the most recent quarter’s year-on-year growth rate of total Irish exports and imports reveal a 7.9 per cent increase in exports while imports fell dramatically by 8.4 per cent. Between 2016 and 2017, exports grew by 6.9 per cent while imports fell by 6.2 per cent.
-2 -1 0 1 2 3 4
-2 -1 0 1 2 3 4
FIGURE 2 ANNUAL GROWTH RATE (%) IN TOTAL IRISH EXPORTS AND IMPORTS
Source: Central Statistics Office.
As noted in our previous Commentary, a useful way to observe Irish trade is by splitting values into three categories; cross-border goods trade, ownership goods trade and services trade. Cross-border goods represent approximately 35 per cent of total Irish exports but this share has been declining in recent years. Services trade represents the largest portion of Irish exports at roughly 40-45 per cent. The remaining category, ownership goods, captures the exchange of goods outside of Ireland’s borders that fall under Irish-resident firm ownership. This represented 8.3 per cent of total exports in 2013 before rising sharply to an average of 25 per cent over the last three years. The increase is mainly due to major multinational enterprises shifting certain functions to Ireland, resulting in manufacturing contracts being registered as Irish exports when these goods are both produced and sold abroad.
The increase in exports is not evenly distributed between these three categories of trade. Cross-border exports of goods, a useful measure of domestic trade activity, increased annually by 2.4 per cent in 2017. Services exports rose by 12.6 per cent, largely driven by increases in computer services which represent almost half of total services exports. Ownership trade, however, is estimated to have risen annually by 3.5 per cent, maintaining highly erratic annual growth rates per quarter ranging between -26.1 per cent and +32.2 per cent. Overall, the outlook for export growth remains quite volatile due to the nature of ownership trade.
5,000 10,000 15,000 20,000 25,000 30,000
(20.00) (10.00) 10.00 20.00 30.00 40.00 50.00 60.00
Services represent over 60 per cent of total imports. Cross-border goods imports represent approximately 30 per cent of the total while ownership trade is far smaller under this measure at less than 10 per cent of total imports. A 6.9 per cent fall in services was the main factor behind the dramatic fall in Irish imports. Meanwhile, imported goods in 2017 rose annually by 3.7 per cent with respect to cross-border trade while ownership trade fell by an estimated 34.1 per cent. Declines in research and development as well as royalty/license fee payments were the major contributors towards service import declines. Figure 3 reveals net surpluses including adjustments for ownership trade. As of 2017, the growing influence of ownership trade significantly increases the headline figures for Ireland’s current trade balance.
FIGURE 3 CROSS-BORDER AND ADJUSTED NET EXPORTS OF GOODS AND SERVICES (€ MILLION)
Source: Central Statistics Office, QEC calculations.
Figure 4 highlights the rise in 2015 in ownership trade, which had a dramatic effect particularly on the export of goods in Ireland. In terms of domestic activity, exports appear to have grown far more gradually than quarterly National Accounts would imply.
20,000 40,000 60,000 80,000 100,000 120,000
2006 2007 2008 2009 2010 2011 2012 2013 2014 2015 2016 2017
FIGURE 4 GOODS EXPORTS AND IMPORTS BY TYPE (€ MILLION)
Source: Central Statistics Office, QEC calculations.
Focusing on the components of cross border trade, exports of food and live animals increased by 12.5 per cent between 2016 and 2017. Medical and pharmaceutical product exports rose by 17.3 per cent between the same periods, netting an increase of €5.2 billion. Organic chemicals, however, saw the largest decline by €3.9 billion (-16 per cent). Medical and pharmaceutical product imports grew 41.2 per cent, increasing by €2.5 billion in 2017. Road vehicles and other transport equipment imports saw the largest combined decrease of €1.7 billion (7 and 9.1 per cent respectively) between the same periods. In total, cross-border exports increased by €2.85 billion with imports rising by €2.76 billion. Ireland’s composition of trade partners has further concentrated amongst the UK, the US, the Euro Area and China while trade with the rest of the world, both in terms of imports and exports, fell between 2016 and 2017. In particular, exports to China rose by 34.7 per cent largely through machinery and transport equipment, contributing to a trade surplus with China. This was due to continued rise in electrical machinery exports, which increased from €87.7 million in 2015 to €1.2 billion and €2.3 billion in 2016 and 2017, respectively. Imports from the US rose 11.9 per cent driven by chemicals and related product imports reaching a 60.6 per cent growth rate.
Computer services accounted for 48 per cent of Ireland’s total service exports in Q4 2017 and this category has increased persistently over the last number of years. Total service exports increased by 14.3 per cent in 2017. Royalties, licenses
(30,000) (20,000) (10,000) 10,000 20,000 30,000 40,000 50,000 60,000 20 11Q1 20 11Q2 20 11Q3 20 11Q4 20 12Q1 20 12Q2 20 12Q3 20 12Q4 20 13Q1 20 13Q2 20 13Q3 20 13Q4 20 14Q1 20 14Q2 20 14Q3 20 14Q4 20 15Q1 20 15Q2 20 15Q3 20 15Q4 20 16Q1 20 16Q2 20 16 Q3 20 16 Q4 20 17Q1 20 17Q2 20 17Q3 20 17Q4
and business service imports comprise 84 per cent of services imports according to our most recent quarterly data. In 2017, royalties/licenses fell annually by 1.4 per cent while business service imports decreased by 16.1 per cent. Within the different business services, research and development saw the most dramatic decrease, falling by 43.1 per cent in 2017 (€20.3 billion). Increases in both royalty payments and research and technology are probably affected by the significant increase in the composition of the domestic capital stock accounted for by MNE intangible assets. The role of MNEs is also central to the 6.9 per cent decline in service imports.
Ireland’s composition of trade partners between EU and non-EU members splits evenly in terms of service exports whereas 64 per cent of service imports are sourced from regions beyond the EU28 zone. In terms of annual rates of change, exports and imports to the EU28 remained relatively stable for Q3 2017. Annually, Ireland grew non-EU28 service exports by 20.2 per cent in Q3 2017 while simultaneously lowering service imports by 25.8 per cent for the same period. Figure 5 illustrates how both exports and imports in the services industry have doubled since 2012.
[image:20.595.72.526.402.713.2]
FIGURE 5 EXPORTS AND IMPORTS OF SERVICES (€ MILLION)
Source: Central Statistics Office.
While shares of total trade are falling with respect to the UK, changes in these exports and imports for 2017 remain relatively stable as shown in Table 1 compared with the previous year. Exports and imports of chemicals and related
10,000 20,000 30,000 40,000 50,000 60,000
Imports, Total Exports, Total
Imports, Royalties/licences Exports, Computer services
products saw the largest changes, of 22 and 26 per cent respectively. There was also a significant increase in trade with the US within chemicals and related products (rising by 61 per cent), while there was relatively little growth overall with the rest of the EU for the same period.
[image:21.595.74.518.194.476.2]
TABLE 1 ANNUAL CHANGE (%) IN GOODS EXPORTS AND IMPORTS FOR THE UK, THE US AND THE REST OF EU FOR MAJOR COMMODITIES
Exports % Imports %
Total – UK 8 10
Food and live animals 8 7
Chemicals and related products 22 26 Machinery and transport equipment -3 1 Miscellaneous manufactured articles 3 -1
Total – Rest of EU 3 0
Food and live animals 16 8
Chemicals and related products 2 13 Machinery and transport equipment 6 -8 Miscellaneous manufactured articles -10 -2
Total – US 4 12
Food and live animals 16 -11
Chemicals and related products 8 61 Machinery and transport equipment -14 -9 Miscellaneous manufactured articles 11 2
Sources: Central Statistics Office.
FIGURE 6 IMPORT AND EXPORT GROWTH (2017-2019 FORECASTS)
Source: QEC calculations.
2017’s current account balance reached its highest level in 15 years at €37.1 billion. The figure is largely the result of a uniquely positive balance in net services trade as well as an improvement in goods trade. Primary income, which is income from loans and investments, remained relatively steady in comparison. Figure 7 depicts the current account by its various categories of income flows.
FIGURE 7 CURRENT ACCOUNT BALANCE, QUARTERLY (€ MILLION): Q1 2011 – Q4 2017
Source: Central Statistics Office.
-10 -5 0 5 10 15 20 25 30 35 40 45
2010 2011 2012 2013 2014 2015 2016 2017 2018 2019
Exports Imports -30,000 -20,000 -10,000 10,000 20,000 30,000 40,000 20 11Q1 20 11Q2 20 11Q3 20 11Q4 20 12Q1 20 12Q2 20 12Q3 20 12Q4 20 13Q1 20 13 Q2 20 13Q3 20 13Q4 20 14Q1 20 14Q2 20 14Q3 20 14Q4 20 15Q1 20 15Q2 20 15Q3 20 15Q4 20 16 Q1 20 16Q2 20 16Q3 20 16Q4 20 17Q1 20 17Q2 20 17Q3 20 17Q4
Services Merchandise Primary income
The Domestic Economy
O
UTPUTThe domestic section of the Commentary is organised as follows; we initially review the outlook for output growth before discussing developments in the Irish monetary and financial sectors. Prices and earnings in the economy are then discussed, followed by a review of demand-side factors such as consumption and housing market issues. On the supply side, we then examine developments in investment and the labour market before concluding with an analysis of the public finances.
The official Irish growth rates indicated that the domestic economy increased by a substantial 7.8 per cent in 2017. However, as with growth rates in 2015 and 2016, it is likely that the headline figure has been impacted by certain developments amongst a small number of multinational firms operating in the Irish jurisdiction. Therefore, it is very difficult to assess from the National Accounts what the rate of underlying activity in the Irish economy actually is. For example, investment and imports both registered highly volatile fluctuations throughout 2017. Figure 8 plots the year-on-year growth rates on a quarterly basis for both aggregates since 2009. The increased volatility in both series since 2015 is readily apparent.
FIGURE 8 YEAR-ON-YEAR GROWTH RATES (%) OF IRISH INVESTMENTS AND IMPORTS: Q1 2009 – Q4 2017
Sources: QEC calculations for Ireland, AMECO estimates for all other countries.
-60.0 -40.0 -20.0 0.0 20.0 40.0 60.0 80.0 100.0 120.0
2009Q1 2010Q1 2011Q1 2012Q1 2013Q1 2014Q1 2015Q1 2016Q1 2017Q1
Notwithstanding the new indicators which have and are about to be provided by CSO, it is time for a more ambitious project which seeks to produce National Accounts on a dual basis; one that captures developments in headline variables as per the ESA2010 definitions, and one that captures developments in the non-multinational sector of the economy. FitzGerald (2015) has called for the preparation of National Accounts for the MNE and the non-MNE sector.5 However, as noted in the investment section of the Commentary, it may not be sufficient to prepare National Accounts purely on this basis; information from the CSO Census of Industrial Production would suggest that large distortionary movements are also apparent for relatively small companies in the Irish economy i.e. ones that employ between ten and 49 people. Therefore, this argues for a more granular breakdown in the preparation of the National Accounts where firms with large distortionary transactions are excluded from a parallel set of accounts. This is required both for the output side of the National Accounts and on the expenditure side so that estimates of exports, imports and investment are also available.
In this Commentary we have the first forecast for a period which occurs during Brexit i.e. the UK is set to leave the EU in March 2019. Following Bergin et al. (2016), we assume that Brexit will impact the Irish economy on a gradual basis over the medium term. Therefore, we do not expect any significant impact on our 2019 forecasts. As with Bergin et al. (2016), our baseline technical assumption is that a European Economic Agreement (EEA) agreement will exist between the UK and the EU similar to that between Norway and the EU.6
M
ONETARY ANDF
INANCIALC
ONDITIONSTrends in lending
Figure 9 presents the annual growth rates of credit to households from Irish resident credit institutions. The data are split by loans for house purchase and other personal loans (auto finance, credit cards, student loans etc.). Overall, the change in credit for house purchase continues to decline, down -0.2 per cent year-on-year to Q3 2017. While the continued reduction in credit stocks indicates that deleveraging is still ongoing amongst households, the annual reduction of -0.2 per cent would suggest the process is slowing down. The expansion in the housing market and the increasing number of housing transactions is likely to see further increases in credit levels.
5
FitzGerald, J., 2015. ‘Problems Interpreting the National Accounts in a Globalised Economy – Ireland’, Quarterly Economic Commentary, Summer 2015, Economic and Social Research Institute (ESRI).
6
In Q3 2017, we observe an increase in the growth rate of lending for non-housing related household loans which are now up 5.5 per cent on a year-on-year basis. This represents a moderate decline in the rate of growth from 6.4 per cent in Q2 2017. As these loans are mainly for consumption purposes and auto financing, the broader recovery in household spending is undoubtedly leading to an increase in demand for this type of financing.
FIGURE 9 GROWTH RATES OF CREDIT TO HOUSEHOLDS (%)
Source: European Central Bank, Statistical Data Warehouse.
Notes: Data are taken from Central Bank of Ireland data release A.18, Growth rates series codes 777 and 1,252.
Turning to the provision of credit to Non-Financial Corporations, the overall stock of credit continues to decline, down by 9.7 per cent in Q3 2017 year-on-year which represents a marginal reduction in the pace of deleveraging from Q2 2017. However, when the financial and property related sectors are removed from the calculations, lending increased to the remaining sectors by 0.9 per cent in Q3 2017. The difference between the trends in credit provision for corporates and credit to the non-construction ‘real economy’ shows that the legacy of the financial crisis still remains in certain sectors of the Irish economy.
-20 -10 0 10 20 30 40
FIGURE 10 GROWTH RATES OF CREDIT TO PRIVATE SECTOR ENTERPRISES (%)
Source: Central Bank of Ireland, Credit, Money and Banking Statistics.
A healthy credit market provides adequate volumes of appropriately priced credit at prudent loan conditions to firms and households. As the Irish economy continues to grow, it is important to monitor emerging trends in new lending from two perspectives: 1) that sufficient credit is flowing to ensure new investments can be made and 2) that lending activity does not begin to become unsustainable or imprudent.
Using new mortgage lending data from the Banking and Payments Federation, in Q4 2017 the volume of new mortgage drawdowns increased by 13.5 per cent year-on-year, and the value of mortgages increased by 23 per cent year-on-year. The relatively higher growth rate in the value reflects the fact that borrowers are drawing down larger and larger loans given the increased house price environment. The average loan size for mortgages was €223,851 in Q4 2017 which is 88 per cent of the peak value in Q1 2008. Indeed, the value of new drawdowns exceeded €2 billion in Q3 2017 for the first time since 2009, indicating the heightened level of activity in the credit market. In Q4 2017, the value of lending was €2.2 billion for the quarter.
-20.0 -10.0 0.0 10.0 20.0 30.0 40.0 50.0
Total
Total ex Financial Intermediation
FIGURE 11 YEAR-ON-YEAR GROWTH RATE OF CREDIT TO HOUSEHOLDS (%)
Source: Banking and Payments Federation Ireland.
Given the increased lending apparent, the policy framework governing credit provision is clearly very important if financial stability is to be ensured. In that regard, the macroprudential framework currently being deployed by the Central Bank, with prudent loan-to-income limits are central to sustainable credit provision. The description of the underlying mortgage loans published in Kinghan et al. (2017)7 suggests origination is currently not overly risky, with low average LTI and LTV. The recent changes to the macroprudential regulations, announced in November 2017, maintain the prudency of the overall framework.
Another aspect of new lending that provides a guide to the health of the domestic economy is lending to small business. Loans to Irish small- and medium-sized enterprises (SMEs) grew steadily in 2016 (Figure 12). This continues the trend in overall SME lending which began to increase in 2015 from mid-2014 lows.
Gross new lending was €1,058 million in Q3 2017, down from €1,121 million one year earlier. This represents a trend of declining new lending throughout 2017. Given the buoyancy of the recovery in the domestic economy, a decline in new lending for SMEs is difficult to reconcile. However, uncertainties potentially related to Brexit may be affecting credit demand in some sectors.
7
Kinghan, C., P., Lyons, Y., McCarthy, and C., O’Toole, 2017. ‘Macroprudential Measures and Irish Mortgage Lending: Insights from H1 2017’, Economic Letters 13/EL/17, Central Bank of Ireland.
-80.0 -60.0 -40.0 -20.0 0.0 20.0 40.0 60.0 80.0 100.0
2006Q1 2007Q2 2008Q3 2009Q4 2011Q1 2012Q2 2013Q3 2014Q4 2016Q1 2017Q2
FIGURE 12 QUARTERLY NEW LENDING TO IRISH SMES BY SECTOR (4-QUARTER ROLLING AVERAGE)
Source: Banking and Payments Federation Ireland
Another sign of slightly deteriorating credit environment for SMEs is a rise in the rejection rates for Irish loans relative to European peers. Data from the ECB Survey on Access to Finance for SMEs (SAFE) provide a benchmark for rejection rates in Ireland relative to other European economies. These are presented in Figure 13. Following the financial crisis, rejection rates for Irish firms increased considerably, and were amongst the highest in the Eurozone. Since mid-2014 rejection rates have been declining in Ireland relative to other countries and by early 2016 rates were well below the median in the Euro Area. The most recent data for end 2016 indicate a pickup in rejection rates and this has continued into the first half of 2017.
0 200 400 600 800 1000 1200 1400
20
10Q4
20
11Q2
20
11Q4
20
12Q2
20
12Q4
20
13Q2
20
13Q4
20
14Q2
20
14Q4
20
15Q2
20
15
Q4
20
16
Q2
20
16Q4
20
17Q2
Other
Business Services including ICT and Finance
Hotels and Restaurants
Wholesale and Retail
Construction and Real Estate
Manufacturing, Transport and Utillities
FIGURE 13 AVERAGE REJECTION RATE FOR BANK LOANS – IRISH AND EUROPEAN SMES
Source: ECB SAFE Survey.
Interest rates and the cost of finance
A feature of the domestic recovery is that the cost of finance in Ireland for both corporate and household credit is high by European standards. More recently, competitive pressures are increasing in the mortgage market and some reductions in lending rates are occurring. The standard variable rate on new mortgage loans in Ireland stood at 3.32 per cent as of December 2017; this is down slightly year-on-year from 3.40 in December 2016. However, comparing Irish new house purchase loans relative to other Eurozone economies, it can be seen that new lending rates are the highest of the comparison group (Figure 14). As of December 2017, interest rates on new house purchase in Ireland were nearly 1.2 per cent higher than the median of the other countries presented. This gap has widened since mid-2014 when Irish interest rates began to decouple from the ECB policy rate.
0 5 10 15 20 25 30 35 40 45
FIGURE 14 INTEREST RATES ON NEW HOUSE PURCHASE LOANS TO HOUSEHOLDS – EUROPEAN COMPARISON
Source: ECB MFI data.
Notes: Countries included are: AT, BE, EE, ES, FI, FR, IE, IT, LT, NL, PT, SI. These countries are selected due to data availability. Data
differ between this chart presented and the text as the ECB comparison data include restructured mortgages whereas the new business SVR is only for new drawdowns.
A similar picture emerges in relation to corporate interest rates. Figure 15 presents the interest rates on new business loans for Non-Financial Corporations in Ireland relative to the average for the Eurozone. Two series are presented: 1) covering all loans and 2) capturing loans of less than €250,000 which is used as a proxy for loans for SMEs. In December 2017, the average rate on new loans for all Irish corporates was 2.83 per cent while the Eurozone average was 1.71 per cent. For small Irish corporate loans, the interest rate in December 2017 was 5.29 per cent compared with a Eurozone average of 2.39 per cent. Interest rates are down year-on-year for small corporates but remain considerably higher than for their European peers.
0.00 1.00 2.00 3.00 4.00 5.00 6.00 7.00 8.00
FIGURE 15 INTEREST RATES ON LOANS TO NON-FINANCIAL CORPORATIONS – EUROPEAN COMPARISON
Source: ECB MFI data. Small loans refer to loans less than €250,000.
Household and firm deposits
Central to understanding the financial position of households is information on their savings and investment behaviour. In this regard, the ESRI has, since 2010, compiled a monthly savings index, which examined how much households were saving as well as their attitudes to the savings environment.
However, since October 2017, the ESRI has begun publishing a revised and updated Savings and Investment Index with Bank of Ireland that incorporates not only households’ savings activity but also their investment behaviour. This broader and more insightful index will further deepen our understanding of the financial position of households in Ireland. The most recent data from the Index indicate that households have increased savings rates in 2017 and feel 2018 is a good time to save. Households’ views on the investment environment have also improved which probably reflects the improved domestic economic situation and global growth buoyancy. Box 1 below provides more detail on the new Index.
0 1 2 3 4 5 6 7 8
BOX 1 MONITORING HOUSEHOLD FINANCIAL DECISIONS – THE NEW BANK OF IRELAND/ESRI SAVINGS AND INVESTMENT INDEX
The Bank of Ireland/ESRI Savings and Investment Index tracks household attitudes towards savings and investment as well as monitoring their perspectives on the current and future savings and investment environment. Understanding savings behaviour provides insight into how households smooth consumption across economic cycles, plan for major purchases and build up buffers which can be drawn down in times of economic stress. Monitoring household investment patterns gives an understanding of how they are putting their money to work, their financial diversification, and their appetite for risk. The sample covers 800 consumers aged 16 years and above and is nationally representative.
The Index is built on two pillars: A Savings Pillar and an Investment Pillar. The Savings Index is composed of two sub-indices: Savings Attitudes (savings behaviour and how respondents feel about the amount they save) and Savings Environment (perceptions of the current savings environment and expectations for the environment in six months).
The new Investment Index mirrors the Savings Index with the survey looking at whether or not households invested in the following range of assets: stocks, pension plan, investment fund, bonds, property or other assets. These data are used, in conjunction with a question on whether or not households feel they are investing sufficiently, to create an Investment Attitudes Index. An Investment Environment Index is compiled based on questions about whether households think it is a good time to invest now or whether they expect it to be a good time in six months. These two elements are aggregated into an Investment Index.
TABLE A SAVINGS AND INVESTMENT INDEX
Month
Savings and Investment
Index
Savings Index Investment Index
Overall Attitudes Environment Overall Attitudes Environment
Nov-16 95.5 100.6 90.3
Dec-16 90.2 91.2 89.2
Jan-17 94.8 98.3 91.3
Feb-17 89.2 87.4 91.0
Mar-17 96.3 100.6 92.1
Apr-17 92.9 95.8 90.0
May-17 94.8 95.9 93.7
Jun-17 90.4 91.7 89.2
Jul-17 95.1 96.9 93.3
Aug-17 89.9 94.3 85.5
The Savings and Investment pillars are then averaged to provide an overall Savings and Investment Index. This broader and more insightful index will further deepen our understanding of the financial position of households in Ireland and explore what is driving their behaviour.
In terms of recent trends in the Index, the monthly Savings and Investment Index remained flat at 102 points in January 2018 relative to December 2017. While there was a decrease in savings and investment attitudes, consumer’s views on the savings and investment environment improved. Respondent’s positive views on the savings and investments environment may be driven by two aspects: 1) continued improvement in Irish consumer finances and the labour market; 2) reduced global uncertainty and a better international trading environment.
This box was prepared by Teresa Monteiro, Conor O’Toole, and Dorothy Watson.
P
RICES ANDE
ARNINGSThe Consumer Price Index (CPI) increased by 0.4 per cent in 2017 having not changed in 2016. Figure 16 shows the relatively low inflation rate persisting since early 2013. The increase in overall prices within 2017 was mainly driven by inflation within housing, water, electricity, gas and other fuels (up 2.0 per cent on average), restaurants and hotels (up 2.9 per cent on average) and transport (up 2.2 per cent). Compared to last year, price growth slowed in education as well as for goods such as alcoholic beverages and tobacco.
FIGURE 16 ANNUAL GROWTH IN INFLATION (%)
Source: Central Statistics Office.
The difference in price trends between goods and services continues to widen as the economy moves into 2018. The underlying trends in the CPI (Figure 17) indicate prices for services have averaged a 2.2 per cent increase in 2017 while the price of goods has fallen by 2.1 per cent. This follows an average 2.2 per cent rise in service prices and a 3.0 per cent fall in goods prices for 2016. Examining the CPI of goods in January 2018 reveals that prices have fallen to a level last seen in November 1999. Given our current forecasts of accelerated wage growth, increased private consumption expenditure and rising oil prices, it is expected that the disinflation experienced by certain goods will slow down through 2018.
-8 -6 -4 -2 0 2 4 6
FIGURE 17 DECOMPOSITION OF ANNUAL (%) CPI GROWTH INTO GOODS AND SERVICES GROWTH
Source: Central Statistics Office.
Fourth quarter earnings data from the CSO indicate that seasonally-adjusted Average Hourly Earnings increased by 0.2 per cent compared to the previous quarter. On an annual basis, earnings increased by 1.9 per cent up to €22.51. The largest increase for the quarter was observed in the professional, scientific and technical activities sector rising by 8.42 per cent (an additional €2.11 per hour) compared to the final quarter of the previous year. Other notable increases occurred in ICT and education, with earnings per hour rising by 4.6 per cent and 4.4 per cent, respectively. Figure 18 highlights rising earnings occurring both on an hourly and weekly basis within 2017.
-2.5 -2 -1.5 -1 -0.5 0 0.5 1 1.5 2 2.5
FIGURE 18 TRENDS IN AVERAGE EARNINGS PER WEEK AND PER MONTH (€)
Source: Central Statistics Office.
Note: The y-axis on the LHS scale has a very low range of values.
Since Q2 2016, the growth of average weekly earnings has increased. If this trend continues, improvements in households’ earnings are likely over the short to medium term. After a substantial rise in Q1 2017, growth remained relatively slower for the remaining three periods. As of Q4 2017, the average weekly earnings reached €726.31, representing a 2 per cent increase from €711.91 in Q4 2016. Increases in earnings should lead to continued consumption growth.
When examining these trends further, strong differences emerge between different sectors of the economy. The largest gains in earnings over the last year occurred within the public administration and professional, scientific and technical activity sectors with weekly earnings rising, on average, by €38.99 and €30.70 respectively. After an annualised drop in construction sector earnings both in the second and fourth quarters of 2017, pay only saw a modest rise of €1.34 on average in that sector. Of the 13 sectors examined, arts and entertainment experienced the only decline for the overall year, with weekly earnings averaging a 0.6 per cent fall, equating to a €2.78 reduction. Figure 19 presents a four-quarter moving average growth rate by sector to display the trends over time in earnings pressures. As of Q4 2017, a positive trend persists with overall earnings increasing by 2.3 per cent compared to the same period last year. The public administration sector exceeds this average, having emerged from a prolonged period of earnings reductions between 2013 and 2016.
670 680 690 700 710 720 730 21.2 21.4 21.6 21.8 22 22.2 22.4 22.6 20 11Q1 20 11Q2 20 11Q3 20 11Q4 20 12 Q1 20 12Q2 20 12Q3 20 12Q4 20 13Q1 20 13Q2 20 13Q3 20 13Q4 20 14Q1 20 14Q2 20 14Q3 20 14 Q4 20 15Q1 20 15Q2 20 15Q3 20 15Q4 20 16Q1 20 16Q2 20 16Q3 20 16Q4 20 17Q1 20 17Q2 20 17Q3 20 17Q4
FIGURE 19 FOUR-QUARTER MOVING AVERAGE GROWTH BY SECTOR IN WEEKLY EARNINGS
Source: Central Statistics Office.
Growth in employment appears to be contributing towards increased wage pressures in the Irish economy. In light of strong domestic demand and the continuously positive labour market performance, we expect both wages and prices to increase over the coming years. Furthermore, as Lawless and Morgenroth (2018) detail in their special article to this Commentary, the possibility of a hard Brexit in early 2019 may also add to price pressures on imported goods. Note a hard Brexit is different from the assumption made about Brexit in the Commentary for the 2019 forecast. Consumer prices are expected to increase moderately by 0.7 per cent in 2018, followed by 1.1 per cent in 2019. Earnings are forecast to rise by 2.5 per cent and 3.5 per cent for the same periods, meaning real wage growth is likely to continue rising as the economy approaches full employment levels.
TABLE 2 INFLATION MEASURES
2016 2017 2018 2019 Annual % Change
CPI 0.0 0.4 0.7 1.1
Growth in Average Hourly Earnings 1.7 2.1 2.5 3.5
Sources: Central Statistics Office and ESRI forecasts.
-3.0 -2.0 -1.0 0.0 1.0 2.0 3.0 4.0 5.0 6.0
2013Q3 2014Q3 2015Q3 2016Q3 2017Q3
Manufacturing Construction
D
EMANDHousehold sector consumption
Private consumption expenditure continues to benefit from the ongoing improvements in the labour market. The most up-to-date quarterly National Accounts show that, on an annualised basis, personal consumption expenditure increased by 2.8 per cent in Quarter 3, 2017 and 1.9 per cent in Quarter 4, 2017. On a quarter-on-quarter basis, consumption spending increased by 1.9 per cent and 0.3 per cent, respectively. The persistent fall in unemployment, increase in disposable incomes and an improvement in household balance sheets have all provided a supportive context for household spending.
FIGURE 20 QUARTERLY PERSONAL CONSUMPTION ON GOODS AND SERVICES – CONSTANT MARKET PRICES AND SEASONALLY ADJUSTED
Source: Central Statistics Office.
An important leading indicator for consumption is developments in retail sales. These indicators provide a snapshot of what goods and services households are purchasing and where the growth is coming from. Table 3 presents retail sales for selected items in terms of the annual growth rate in the volume of sales. For all businesses retail sales are up 7.2 per cent in the year to December 2017.
19,500 20,000 20,500 21,000 21,500 22,000 22,500 23,000 23,500 24,000 24,500 25,000 -6% -4% -2% 0% 2% 4% 6% 20 10Q1 20 10Q3 20 11Q1 20 11Q3 20 12 Q1 20 12Q3 20 13Q1 20 13Q3 20 14Q1 20 14Q3 20 15Q1 20 15Q3 20 16Q1 20 16Q3 20 17Q1 20 17Q3
TABLE 3 ANNUAL GROWTH IN SELECT RETAIL SALES (VOLUME) ITEMS (DECEMBER 2017)
Retail Business – NACE REV 2 Volume of Sales
Annual % change
Motor trades 1.9
Non-specialised stores (excluding department stores) 5.6
Department stores 9.0
Clothing, footwear and textiles 5.7 Furniture and lighting 17.3 Hardware, paints and glass 13.3
Electrical goods 16.0
All businesses excl. motor trades 7.6
All businesses 7.2
Source: Central Statistics Office.
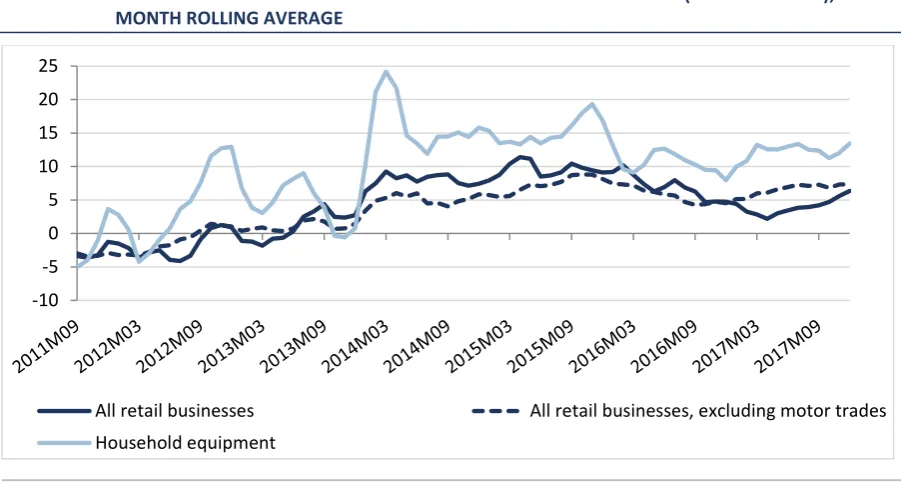
The rise in consumer expenditures seems to be closely related to the recovery in the housing market. In the year to December 2017 there was a significant increase in furniture and lighting (up 16.1 per cent year-on-year), electrical goods (up 16.0 per cent year-on-year) and hardware, paints and glass (up 13.3 per cent year-on-year). The overall trends in retails sales are displayed in Figure 21. This chart presents a three-month rolling average of retail sales for total sales, sales excluding the motor trade, and for household equipment. Of note is the high growth in housing equipment (13.4 per cent in December) and the continued strength of all retail sales excluding the motor trade (7.4 per cent in December). As the construction sector continues to grow and housing transactions increase, it is likely that the sales of goods related to housing formation will maintain strong growth.
FIGURE 21 AVERAGE GROWTH IN RETAIL SALES INDEX VOLUME ADJUSTED (BASE 2005=100), THREE- MONTH ROLLING AVERAGE
Source: Central Statistics Office.
-10 -5 0 5 10 15 20 25
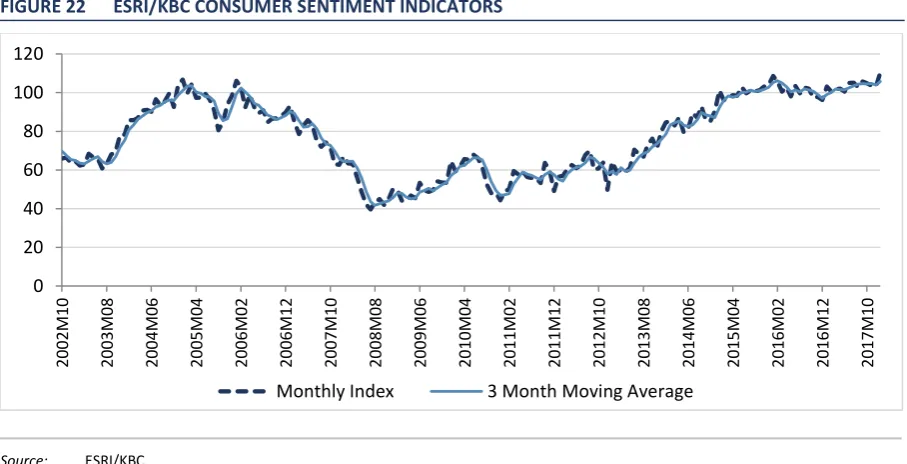
As a complement to the retail sales data, it is salient to review trends in consumer sentiment. Figure 22 presents the ESRI/KBC Consumer Sentiment Index which tracks the monthly views of households on their current and future economic perspectives. While international geopolitical factors were likely to have contributed to a weakening of consumer sentiment in mid to late 2016, from February 2017 to February 2018 the monthly index followed an overall positive trend. The three months moving average index reached its highest value in December 2017 (106.3 index points). One of the main drivers recently observed in the index was the strengthening of households’ views on their personal financial outlooks relative to 12 months ago. This suggests that economic growth is increasingly being felt by the wider population. The sentiment indicators correlate with the growth in average weekly earnings observed in the prices and earnings section of the Commentary.
FIGURE 22 ESRI/KBC CONSUMER SENTIMENT INDICATORS
Source: ESRI/KBC.
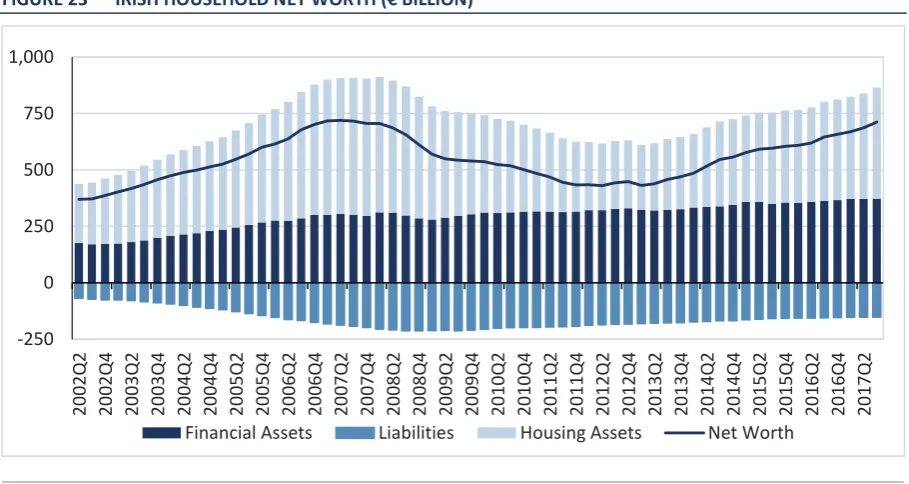
Irish household net worth continues to grow in Quarter 3, 2017 as loan repayments reduce the stock of outstanding liabilities and rising asset prices raise the total value of domestic balance sheets. The trend in the overall position of Irish households’ net worth, which is the stock of financial and housing assets minus the stock of liabilities, is presented in Figure 23. Net worth decreased considerably during the financial crisis as housing assets fell sharply in value. The recovery in the housing market has contributed to a rise in housing wealth which has improved overall net worth. Financial assets have grown modestly since 2010. As households continued to pay down debt balances, the liabilities side is continuing to decline.
0 20 40 60 80 100 120 2002M 10 2003M 08 2004M 06 2005M 04 2006M 02 2006M 12 2007M 10 2008M 08 2009M 06 2010M 04 2011M 02 2011M 12 2012M 10 2013M 08 2014M 06 2015M 04 2016M 02 2016M 12 2017M 10
FIGURE 23 IRISH HOUSEHOLD NET WORTH (€ BILLION)
Source: Central Bank of Ireland, Quarterly Financial Accounts.
In summary, household consumption is set to continue benefitting from elevated levels of consumer sentiment and an improved labour market over the next two years. We expect consumption expenditure to grow by 2.4 per cent this year and to grow at a slightly faster pace of 2.5 per cent in 2019.
Property market developments
The rate of increase in national property prices has been accelerating since the second half of 2016, reaching double digit growth rates in May 2017. Figure 24 plots the year-on-year changes in residential property prices by property type. In January 2018 prices increased by 12.5 per cent year-on-year, the fastest growth rate in over two years. This compares with an increase of 9.0 per cent in the year to the end of 2016 and an increase of 8.8 per cent in the year to January 2017. Increased prices can be attributable to several factors including the country’s economic recovery and low interest rates, while policy measures such as the government help-to-buy scheme and the loosening of Central Bank lending rules have also increased demand-side pressures in the market. Nevertheless, property prices remain 22.3 per cent lower than the peak reached in May 2007. In the year to January 2018, the price of apartments grew year-on-year by 13.6 per cent.
-250 0 250 500 750 1,000 20 02Q2 20 02Q4 20 03Q2 20 03Q4 20 04Q2 20 04Q4 20 05 Q2 20 05Q4 20 06Q2 20 06Q4 20 07Q2 20 07Q4 20 08Q2 20 08Q4 20 09Q2 20 09Q4 20 10Q2 20 10Q4 20 11Q2 20 11Q4 20 12Q2 20 12Q4 20 13Q2 20 13Q4 20 14Q2 20 14Q4 20 15Q2 20 15Q4 20 16Q2 20 16Q4 20 17Q2
FIGURE 24 ANNUAL HOUSE PRICE GROWTH (%) BY DWELLING
Source: Central Statistics Office.
House price developments are presented in Figure 25 on a geographic basis splitting out Dublin and the rest of Ireland. It is clear that the deceleration of price growth in Dublin in early 2015 was much more acute than outside the capital. Among other factors, this potentially reflects the fact that the Central Banks’ macroprudential rules in the housing market were more tightly binding for borrowers in the Dublin market who needed to use high to-value and loan-to-income ratios to purchase housing. Kinghan et al. (2017) provide some recent evidence of this. Furthermore, the looser loan-to-income cap for first time buyers purchasing properties less than €220,000 would have meant stricter limits in Dublin where average prices were higher. Prices in the rest of the country have been growing sharply, posting double digit growth every month since July 2016 with one exception. The year-on-year growth rates have increased further in January 2018, with Dublin prices growing at 12.6 per cent and prices in the rest of the county increasing by 11.4 per cent. While the growth in house prices in Dublin has remained fairly stable over the past few months, the rate of apartment price growth has accelerated. In the rest of the country, house price growth has increased considerably while apartment price growth appears to have slowed down.
In the 2018 Budget the Irish government announced the introduction of several measures in an effort to tackle the ongoing shortage of housing supply. Some of these measures include a doubling of the proposed vacant site tax levy (from the current 3 per cent to 7 per cent on land not sold by 2019), a new state-run
-40 -30 -20 -10 0 10 20 30 40 20 06 M0 1 20 06M0 8 20 07M0 3 20 07M1 0 20 08M0 5 20 08M1 2 20 09M0 7 20 10M0 2 20 10M0 9 20 11M0 4 20 11M1 1 20 12M0 6 20 13M0 1 20 13M0 8 20 14M0 3 20 14M1 0 20 15M0 5 20 15M1 2 20 16M0 7 20 17M0 2 20 17M0 9
lending vehicle (Home Building Finance Ireland) which will provide finance at commercially competitive rates to viable developers and increased capital allocation towards social housing.
According to government estimates, the €750 million allocated to the Home Building Finance Ireland has the potential to fund the construction of 6,000 homes. The additional capital allocation of €500 million allocated to the Social Housing programme should enable local authorities and approved housing bodies to deliver approximately 50,000 new social houses by 2021 (3,800 in 2018).8
[image:43.595.71.525.358.604.2]These measures will help alleviate the undersupply of housing in Ireland; however as the supply of social housing has been below the required level over the past four to five years, there is a significant pent-up demand for this type of accommodation.
FIGURE 25 ANNUAL HOUSE PRICE GROWTH (%) BY REGION
Source: Central Statistics Office.
House price expectations can be gleaned from the ESRI/AIB House Price Index which is presented in Figure 26. The index, which comprises questions on attitudes to buying and selling property as well as expectations of house prices 12 months from now, has started to trend upwards from the mid-point of 2016. This growth continued into Quarter 3 of 2017 while it slowed down in Quarter 4, 2017. 8 See rebuildingireland.ie. -40 -30 -20 -10 0 10 20 30 40 20 06M0 1 20 06M0 6 20 06M1 1 20 07M0 4 20 07M0 9 20 08M0 2 20 08M0 7 20 08M1 2 20 09M0 5 20 09M1 0 20 10M0 3 20 10M0 8 20 11M0 1 20 11M0 6 20 11M1 1 20 12M0 4 20 12M0 9 20 13M0 2 20 13M0 7 20 13M1 2 20 14M0 5 20 14M1 0 20 15M0 3 20 15M0 8 20 16M0 1 20 16M0 6 20 16M1 1 20 17M0 4 20 17 M0 9
In order to further understand the determinants of house price changes, the ESRI and AIB are reviewing the Housing Index with a view to publishing an improved and revised Index. It is expected that the new Index be published in Q2 2018 covering the Q1 2018 period.
FIGURE 26 ESRI/AIB HOUSE PRICE INDEX (BASE JULY 2013 = 100)
Source: Central Statistics Office.
Irish real house prices rose at the fifth fastest pace among OECD countries in the third quarter of 2017, based on year-on-year growth. According to the OECD House Price Index (Figure 27), real house prices in Ireland grew at 18.6 per cent only being surpassed by Iceland (36.3 per cent), Canada (23.4 per cent), Hungary (20.4 per cent) and New Zealand (18.9 per cent). This is well above the average growth rates for the entire OECD (7.7 per cent) and Euro Area (6.1 per cent) and contrasts with housing market developments in countries such as Turkey (-2.7 per cent), Italy (-1.7 per cent) and Greece (-1.7 per cent).
90.00 100.00 110.00 120.00 130.00 140.00 150.00 160.00 170.00 20 13M0 9 20 13M1 1 20 14M0 1 20 14M0 3 20 14M0 5 20 14M0 7 20 14M0 9 20 14M1 1 20 15M0 1 20 15M0 3 20 15M0 5 20 15M0 7 20 15M0 9 20 15M1 1 20 16M0 1 20 16M0 3 20 16M0 5 20 16 M0 7 20 16M0 9 20 16M1 1 20 17M0 1 20 17M0 3 20 17M0 5 20 17M0 7 20 17M0 9 20 17M1 1
FIGURE 27 OECD TOP TEN FASTEST GROWING HOUSING MARKETS, % GROWTH REAL HOUSE PRICES
Source: OECD Economic Outlook.
[image:45.595.71.525.529.774.2]National rents in Quarter 3, 2017 increased by 9.5 per cent on an annual basis, continuing the rise that has been observed since early 2013, as can be seen from Figure 28. Rents in Dublin had a steep increase in Quarter 3, 2017 of 9.9 per cent year-on-year, while rents in the Greater Dublin Area (excluding Dublin) and rents outside the Greater Dublin Area grew by 6.5 per cent and 9.2 per cent respectively for the same period. Since mid-2016 rents in Dublin are above the pre-crisis peak experienced in Quarter 4, 2007. As housing supply continues to be below the estimated structural demand, upward pressures in the rental market are expected to continue.
FIGURE 28 RESIDENTIAL TENANCIES BOARD NATIONAL RENTAL INDEX (BASE Q3 2007 = 100), ANNUAL PERCENTAGE CHANGE
Source: Residential Tenancies Board (RTB).
6.1% 7.7% 12.6% 13.8% 14.7% 16.4% 16.6% 18.6% 18.9% 20.4% 23.4% 36.3% Euro area OECD - Total Israel Slovak Republic Latvia Portugal Czech Rep. Ireland New Zealand Hungary Canada Iceland
Q3 2016 - Q3 2017
-20 -15 -10 -5 0 5 10 15 20 08Q3 20 09Q1 20 09Q3 20 10Q1 20 10Q3 20 11Q1 20 11Q3 20 12Q1 20 12Q3 20 13Q1 20 13Q3 20 14Q1 20 14Q3 20 15Q1 20 15Q3 20 16Q1 20 16Q3 20 17Q1 20 17Q3 National Dublin
Greater Dublin Area (excl Dublin) Outside Greater Dublin Area 2.9% 3.5% 6.4% 7.0% 7.1% 7.6% 8.1% 9.3% 9.7% 10.6% 11.7% 24.8% Euro area OECD Latvia New Zealand Australia Hungary Netherlands Portugal Czech Rep. Ireland Canada Iceland