Impact of Mobility on Communication Latency and
Reliability in Dense HetNets
Abdulkadir Kose
∗, Chong Han
∗, Chuan Heng Foh
∗, Mehrdad Dianati
† ∗Institute for Communication Systems (ICS), University of Surrey, Guildford, UK†Warwick Manufacturing Group, University of Warwick, Coventry, UK Email: {a.kose, chong.han, c.foh}@surrey.ac.uk, [email protected]
Abstract—One of the cutting edge requirements envisioned for next-generation mobile networks is to support ultra-reliable and low latency communication (URLLC), as well as to meet massive traffic demand in the next few years. Although network densification has been considered as one of the promising solutions to boost capacity and high throughput, the impact of mobility on latency and reliability in dense networks has not been well investigated. Moreover, handovers, especially in dense networks, can cause extra delay to the communication and degrade reliability performance. In this paper, we aim to analyse the impact of different handover hysteresis parameters on the performance metrics, such as end-to-end delay and packet loss ratio (PLR). In this regard, we compare latency and PLR performance around cell borders including the handover process with the overall period of simulation. Simulation results show that the impact of mobility becomes more significant in dense networks due to frequent exposure to cell borders and handovers.
Index Terms—Handover, HetNets, 5G, V2X. I. INTRODUCTION
By the 5G cellular networks, the outdoor ultra-dense small cells are expected to be introduced in the networks to extend coverage and capacity to mitigate the 1000x wireless traffic demands in the next decade that the current Heterogeneous Networks (HetNets) comprised of mostly macro cells and indoor small cells will not be able to meet [1]. Although densification of small cells has been considered as one of the promising solution to boost capacity and achieving high throughput, its impact on communication latency and reliabil-ity has not been well investigated.
Mobility management becomes quite challenging issue with the existence of small cells forming dense networks with var-ious cell coverages. Mobility performance of small cell dense networks may not be as good as the macro-only networks in presence of mobile nodes due to several issues, such as signalling overhead on network via frequent mobility events and higher occurrence of radio link or handover failures. As reported in [2], very high handover rates (120%-140%) can be observed with 10 small cells per macro as compared to macro only networks. When mobility robustness is concerned, the work in [3] shows that pico to pico and pico to macro handovers are one of the most problematic handover types in terms of handover failures. Although handover failures can be increased by small cell deployments as compared to macro-only case, it is stated in [3] that these impact can be mitigated by applying handover parameter optimisation
techniques, hence handover failure (HOF) rate is reduced to around 1-2%. However, it is also clearly stated in the paper that HOF rate cannot be minimised further by means handover optimisation due to coverage hole around small cell borders which cause quick signal degradation. Thus, such drawback cannot be ignored, especially in dense small deployment where frequent cell change is the dominant factor.
Although numerous efforts can be found in current studies to enhance mobility management, limited works have assessed the impact of mobility on communication latency and packet loss ratio in dense networks. Stringent latency requirements are required to meet certain vehicular applications. Mobility nature of vehicles leads more frequent switching between small cells to retain communication link [4]. Therefore, reliable vehicle-to-everything (V2X) communications in such denser networks are great challenge due to high mobility features of vehicles. In such scenario, poor radio condition and data interruption during handover can degrade delay performance which may affect user experience. This paper investigates and evaluates the impact of mobility on performance metrics, such as communication latency and packet loss ratio, with densely deployed small cells. To examine that, ns-3 network simulator [5] is used to conduct system level simulations. We used several handover parameters to assess the performance metrics. To analyse the impact, end-to-end delay and packet loss ratio results are given both for overall simulation period and observation window including handover period.
The remainder of paper is organized as follows. In Sec-tion II, handover process in LTE is explained and current enhancements on mobility management in dense networks are summarised. Section III focuses on the impact of mobility on performance metrics. In this regard, we give details of evaluation process and then we analyse the impact of mobility on performance metrics with different handover hysteresis values. Finally, Section IV summarises the key findings and addresses potential issues need to be considered in future works.
II. CONNECTEDMOBILITY IN DENSE NETWORKS
A. Handover Mechanism in LTE
Handover mainly happens due to degrading signal strength with serving cell while moving away, so that it has to connect to better cell in order to maintain connectivity. Handover in LTE is UE-assisted network controlled. In other words,
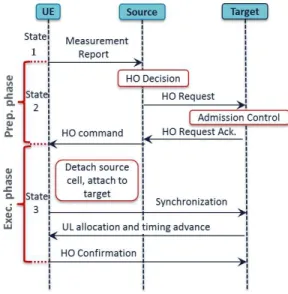
handover decision is performed by source cell based on UE measurement. UE measurement should be met by certain cri-teria, when neighbour cell becomes offset better than serving cell within TTT (Time To Trigger) period, which has been signalled from network when UE camped on a cell at first. As shown in Fig. 1, when this criteria is met, UE sends Measurement Report and Source eNB initiates HO preparation phase which lasts until UE receives HO command. That is the beginning of HO execution phase where UE follows random access procedures to attach Target cell. Once target cell has RRC complete message from UE, it informs MME/SGW to perform path switch. At the end, target cell informs Source cell to release UE related source since source cell still keeps UE context in case of handover failure.
Fig. 1. Handover signalling process.
B. Enhancements in Mobility Management
Densifying network can increase capacity and spatial spec-trum reuse within same area. However, due to increasing handovers in dense networks can reduce these benefits as a result of signalling overhead and data interruption time caused by handover procedures.
Many studies have been carried out to analyse the impact of handover parameters on mobility performance and proposed solutions to optimise handover to reduce HOFs and unnec-essary handovers [6]–[12]. By looking at current efforts on mobility enhancement in connected mode, three main areas are found to enable fast and reliable connected mobility; (i) to reduce HOFs which degrade user performance, and (ii) to reduce data interruption time during handovers, and (iii) ping-pong handovers also need to be avoided in order to avoid un-necessary signalling overheads. In this regard, several attempts have been made to reduce HOF and unnecessary handovers. A user/cell centric handover optimisation is adopted in [6]–[9]. The idea is that by knowing user mobility state and cell type, handover to small cell can be adaptive to avoid HOFs and ping-pongs. The work in [7] has proposed a mobility scheme
to enhance the accuracy of user mobility state estimation based on the number of handovers in dense HetNets where small cells could help to obtain more accurate mobility state detection. In this regard, authors develop minimum variance unbiased (MVU) estimator for user velocity prediction based on the number of handovers when travelling through cell borders in varying densities of small cells. In [10], the authors have proposed a scheme to enhance mobility performance by avoiding unnecessary handovers where some handovers are skipped to reduce the effect of handover delay introduced by each handover attempt in 1-tier dense cellular network considering stochastic geometry. Although these works can improve reliability and eliminate extra delay due to HOF, but signalling overhead due to frequents handovers and service interruption time are still its major bottleneck to achieve light/seamless HOs.
To investigate how upcoming 5G-NR (New Radio) would be integrated with LTE in such a way that data interruption during handover would be avoided while providing high data rates for vehicles. Handover delay and interruption time has been analysed via field test in [13], [14]. In [13], the authors anal-ysed 3 main key performance indicators, such as control/user plane latency, handover execution delay, and network coverage by utilising current LTE network infrastructure for connected mobility use cases. The results are evaluated by their com-patibility with LTE requirements and next generation stan-dardisation should envisage them to meet 5G requirements. It is found that due to break-before make handover feature of LTE, an interruption time around 40ms has been observed during handover which may be compatible with current LTE requirements. However, handover execution time is observed to even exceed 200ms in case of unsuccessful handovers. This clearly indicates that current handover execution time is insufficient to support safety related connected mobility use cases. Upcoming 5G aims to achieve zero mobility interruption to meet demand for vehicular use cases. By considering these works, it becomes more important to evaluate the impact of mobility on user performance in dense networks, so that the problem can be more identified and clear whether the effect is significant or not. In the next section, we provide the details of performance evaluation.
III. PERFORMANCEEVALUATION
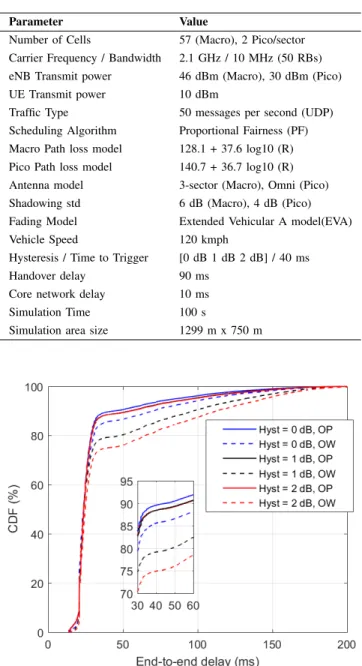
In this work, system level simulations are performed with ns-3 discrete network simulator. The main simulation param-eters can be found in Table I.
The metrics used to evaluate the performance is defined as below:
1) End-to-end delay (ms): it is defined as the time taken by a packet to be transmitted from source to destination across a network. Assuming i-th packet for user u is generated for transmission at the source node at time
Ti,udep and received successfully by destination node at timeTi,uarr,end-to-end delay can be defined as,
Delayi,u=T dep i,u −T
arr
which is one way delay either in downlink or uplink; 2) Packet loss ratio (PLR): it is defined as the ratio of
total number of lost packets to the transmitted packets, PLR= 1− Total Number of Received Packets
Total Number of Transmitted Packets (2) which can be expressed as percentage.
We consider UDP traffic generated by both ways from server to client and client to server every 20ms interval with 1MB packet size. Packet delay is measured at application level. Performance metrics are only shown for downlink transmis-sion. In this work, we develop a windowing mechanism to distinguish the packet transmission performance around handover period from the overall period as seen in Fig. 2. The observation window period is determined as follow; when absolute value of RSRP difference between serving cell and target cell is less than predefined threshold W,
|RSRPserving−RSRPtarget|< W (3)
observation window is set to be in the time range (W,−W). Here we set W as 2.5dB. Length of time window is fixed for different handover start case. Thus, impact of different han-dover hysteresis values can be evaluated inside that window.
Serving Cell Neighbour Cell Time (s) 1 2 Hysteresis (dB) A B C TTT 0 Observation Window Lower Margin Upper Margin RSRP (dBm)
Fig. 2. Observation window for data collection with different handover start point. A, B and C are different handover start points with hysteresis = [0dB 1dB 2dB] and TTT = 40ms respectively.
A. System Layout
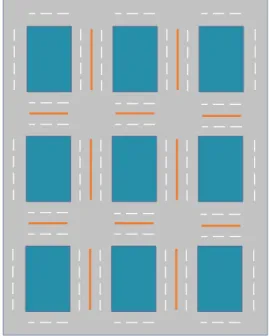
The considered cell deployment with user mobility bound-ary is shown in Fig. 3. The cell layout is a HetNets, with three-sector 19 macro sites (inter-site distance (ISD) = 500 m) and randomly deployed two pico cells per macro sector. Note that we only consider the inner ring and central site for evaluation and the outer ring is considered only for interference purposes, since a wraparound model is not implemented in ns-3. We create a 3x3 Manhattan Grid road configuration with two lanes per direction, covering 1299x750 meters as shown in Fig. 4. It follows the guidelines and scenarios provided in [15]. We use BonnMotion tool [16] to model vehicle movements in the manhattan grid.
Macro Site Pico Cell
Bouncing Circle
Fig. 3. Deployment layout in HetNet.
Fig. 4. Manhattan grid road configuration [15].
B. Simulation Results
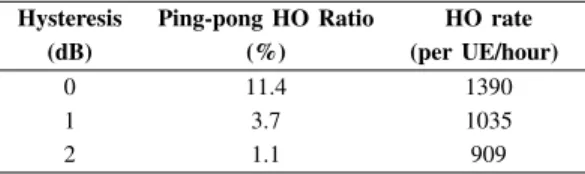
In this work, we aim to evaluate the impact of handover on user performance in the considered scenario. In this regard, the impact of varying handover hysteresis values on the communication latency and packet loss ratio are analysed. We compare end to end communication latency and packet loss ratio seen inside observation window with the overall period. In Fig. 5, the end-to-end delay CDFs results in downlink for different handover hysteresis is shown. It can be seen that higher handover hysteresis has negative impact on delay performance, especially this effect becomes visible by looking delay curve during observation window. One of the reasons for this is the received signal strength quickly decreases around cell edge of a small cell while users moving fast so the user has to stay in poor radio condition until handover process
TABLE I SIMULATIONPARAMETERS
Parameter Value
Number of Cells 57 (Macro), 2 Pico/sector Carrier Frequency / Bandwidth 2.1 GHz / 10 MHz (50 RBs) eNB Transmit power 46 dBm (Macro), 30 dBm (Pico) UE Transmit power 10 dBm
Traffic Type 50 messages per second (UDP) Scheduling Algorithm Proportional Fairness (PF) Macro Path loss model 128.1 + 37.6 log10 (R) Pico Path loss model 140.7 + 36.7 log10 (R) Antenna model 3-sector (Macro), Omni (Pico) Shadowing std 6 dB (Macro), 4 dB (Pico) Fading Model Extended Vehicular A model(EVA) Vehicle Speed 120 kmph
Hysteresis / Time to Trigger [0 dB 1 dB 2 dB] / 40 ms Handover delay 90 ms
Core network delay 10 ms Simulation Time 100 s
Simulation area size 1299 m x 750 m
Fig. 5. End-to-end packet delay in downlink. OP: Overall Period, OW: Observation Window.
is triggered and then completed. Another reason is the long handover delay which cause some packets being delayed until it connects target cell with good radio conditions. Since co-channel deployment is assumed between macro and small cell layer in this work, the interference is also a reason for worse delay performance around handover period. Note that this effect can be presumed as insignificant by only looking the impact on delay in overall simulation period. For example, dif-ference in delay values for Hyst = 1dB and Hyst =2dB are not visible by looking only overall period CDF curves. However this impact become more visible in observation window. The 95%-tile delay and mean delay values for different handover hysteresis values are also presented in Table II. Mean delay
TABLE II
END-TO-END PACKET DELAY IN DOWNLINK
Overall Period (ms) Observation Window (ms)
Hyst (dB) Mean 95%-tile Mean 95%-tile
0 31.0487 85.8837 34.3485 107.5195 1 32.1602 96.7708 39.8225 131.8800 2 32.3132 97.8780 44.4212 144.8830
value reaches up to 44.42 ms during observation period when handover hysteresis becomes 2dB while mean delay value during overall period shows small increase, nearly 2 ms, when hysteresis increase to 2 dB. It is also observed that 95%-tile delay of all packets are less than 100 ms in overall period and not much difference is observed between the case hysteresis is 1 dB and 2 dB. However, higher 95%-tile delays and larger differences in delay values for different handover hysteresis values are observed during observation window. Thus, con-sidering the delay performance over all transmitted packets during simulation can mislead to that impact of mobility is not significant. This is because few packets are transmitted during observation window as compared to overall period and their contributions to the averaged delay over all packets becomes very small. Furthermore, this impact can become even more severe when handover process is unsuccessful due to handover failures (HOFs). Note that we have not yet consider HOFs in this work.
Hyst=0 dB Hyst=1 dB Hyst=2 dB Handover Trigger Time (TTT = 40 ms) 0 2 4 6 8 10
Packet Loss Ratio (%)
Overall period Observation window 6.27% 4.64% 6.70% 4.45% 5.14% 7.68%
Fig. 6. End-to-end packet loss ratio in downlink.
Fig. 6 shows the packet loss ratio (PLR) for different handover hysteresis values. Packet loss ratio is more significant by looking the observation window. For example, in Fig. 6, average packet loss ratio is less than 5.2% for all cases in overall period while it reaches up to almost 7.8% with
Hysteresis = 2dB in observation window. There is also a little difference between hyst = 0dB and hyst = 1dB as compared to hyst= 3dB in during observation window. This is because lower hysteresis values may trigger early
han-TABLE III
PING-PONG HANDOVER RATIO AND TOTAL HANDOVER RATE
Hysteresis (dB) Ping-pong HO Ratio (%) HO rate (per UE/hour) 0 11.4 1390 1 3.7 1035 2 1.1 909
dovers due to channel fluctuations in presence of shadowing and fading effect, which can cause extra packet loss if the connected cell have not better quality. This can impact the performance of some applications, such as vehicle platooning and advanced driving which require almost 99.99% reliability [17]. Note that we consider fixed handover delay as 90ms and handover failures is not modelled, i.e. handover are assumed to be successful. Thus the PLR performance can be worse if handover failures occur, which causes longer exposure to cell border during handover.
In Table III, total handover rate and ping-pong handover ratio are also given for different handover time parameters. A ping-pong handover happens when a UE does HO from cell A to cell B and again it returns to cell A if the ”time of the stay”(ToS) in cell B is less than minimum time-of-stay (MToS). We consider M T oS = 0.5sec in this work. It is clearly seen in the Table III, higher ping-pong handover rate can be observed for lower handover hysteresis value. For example, while 3.7% and 1.1% of total number of handovers are found ping-pong handovers for Hyst = 1 and Hyst = 2 respectively, it increased dramatically to 11.4% when Hyst = 0. The one reason is that high speed vehicles can pass pico cells quickly, which increases ping-pong rates. It is also analytically shown in [18] that small cell link are more sensitive to the fluctuations in channel in presence of fading effect, which leads to rise in the ping-pong handover rate when shorter handover offset value is used.
IV. CONCLUSIONS
In this study, we evaluated the impact of handover hysteresis values on communication latency and packet loss ratio. It can be concluded that higher hysteresis values degrade the packet transmission performance. This effect can not be ig-nored especially when considering packets transmitted during observation window including handover period. Moreover, the impact will become more severe in case handover failures are considered. It should be noticed that even though handover delay is ignored there is still border effect due to rapid signal degradation at small cell edges. Hence, It will be crucial to improve reliability and enable fast handovers for connected-mobility in HetNets. As a future work, we want to continue to develop an analytical model for the delay introduced to the communication latency and reliability due to handover time, considering newly proposed handover mechanisms in the upcoming 5G-NR.
ACKNOWLEDGMENT
This work was supported by Jaguar Land Rover and the UK-EPSRC grant EP/N01300X/1 as part of the jointly funded Towards Autonomy: Smart and Connected Control (TASCC) Programme. We also would like to acknowledge the support of the University of Surrey 5GIC (http://www.surrey.ac.uk/5gic) members for this work. The first author is funded by Republic of Turkey Ministry of National Education.
REFERENCES
[1] D. L´opez-P´erez, M. Ding, H. Claussen, and A. H. Jafari, “Towards 1 gbps/ue in cellular systems: Understanding ultra-dense small cell deployments,” IEEE Communications Surveys & Tutorials, vol. 17, no. 4, pp. 2078–2101, 2015.
[2] 3GPP R2-131233, “Frequent handovers and signaling load aspects in heterogeneous networks,” Tech. Rep., Apr. 2013.
[3] T. Yamamoto and S. Konishi, “Impact of Small Cell Deployments on Mobility Performance in LTE-Advanced Systems,” inPersonal, Indoor and Mobile Radio Communications (PIMRC Workshops), 2013 IEEE 24th International Symposium on. IEEE, 2013, pp. 189–193. [4] Z. Zhang, A. Boukerche, and R. W. Pazzi, “A novel network mobility
management scheme for vehicular networks,” inGlobal Telecommuni-cations Conference (GLOBECOM 2010), 2010 IEEE. IEEE, 2010, pp. 1–5.
[5] ns 3, https://www.nsnam.org/, accessed: 20-02-2019.
[6] G. Kollias, F. Adelantado, and C. Verikoukis, “The impact of inter-site distance and time-to-trigger on handover performance in lte-a hetnets,” in Communications (ICC), 2015 IEEE International Conference on. IEEE, 2015, pp. 3969–3974.
[7] A. Merwaday and I. G¨uvenc¸, “Handover Count Based Velocity Estima-tion and Mobility State DetecEstima-tion in Dense Hetnets,”IEEE Transactions on Wireless Communications, vol. 15, no. 7, pp. 4673–4688, 2016. [8] R. Arshad, H. ElSawy, S. Sorour, T. Y. Al-Naffouri, and M.-S. Alouini,
“Velocity-aware handover management in two-tier cellular networks,”
IEEE Transactions on Wireless Communications, vol. 16, no. 3, pp. 1851–1867, 2017.
[9] M. Alhabo and L. Zhang, “Unnecessary Handover Minimization in Two-Tier Heterogeneous Networks,” in 2017 13th Annual Conference on Wireless On-demand Network Systems and Services (WONS). Inter-national Federation for Information Processing, 2017, pp. 160–164. [10] R. Arshad, H. ElSawy, S. Sorour, T. Y. Al-Naffouri, and M.-S. Alouini,
“Handover management in dense cellular networks: A stochastic ge-ometry approach,” inCommunications (ICC), 2016 IEEE International Conference on. IEEE, 2016, pp. 1–7.
[11] D. Lopez-Perez, I. Guvenc, and X. Chu, “Mobility Management Chal-lenges in 3GPP Heterogeneous Networks,”IEEE Communications Mag-azine, vol. 50, no. 12, 2012.
[12] A. Feki, V. Capdevielle, L. Roullet, and A. G. Sanchez, “Handover aware interference management in lte small cells networks,” inModeling & Optimization in Mobile, Ad Hoc & Wireless Networks (WiOpt), 2013 11th International Symposium on. IEEE, 2013, pp. 49–53.
[13] M. Lauridsen, L. C. Gimenez, I. Rodriguez, T. B. Sorensen, and P. Mo-gensen, “From lte to 5g for connected mobility,”IEEE Communications Magazine, vol. 55, no. 3, pp. 156–162, 2017.
[14] L. C. Gimenez, P. H. Michaelsen, and K. I. Pedersen, “Analysis of Data Interruption in an Lte Highway Scenario with Dual Connectivity,” in Vehicular Technology Conference (VTC Spring), 2016 IEEE 83rd. IEEE, 2016, pp. 1–5.
[15] 3GPP TR 22.885, “3rd Generation Partnership Project; Technical Speci-fication Group Services and System Aspects; Study on LTE Support for V2X Services (Release 14),” Tech. Rep., v.1.0.0, Sept. 2015.
[16] C. de Waal and M. Gerharz, “Bonnmotion: A mobility scenario gener-ation and analysis tool,” 2003.
[17] 3GPP TR 22.886, “3rd Generation Partnership Project; Technical Spec-ification Group Services and System Aspects; Study on enhancement of 3GPP Support for 5G V2X Services (Release 15),” Tech. Rep., v.15.0.0, Mar. 2017.
[18] K. Vasudeva, M. Simsek, D. L´opez-P´erez, and I. G¨uvenc¸, “Analysis of handover failures in heterogeneous networks with fading,” IEEE Transactions on Vehicular Technology, vol. 66, no. 7, pp. 6060–6074, 2017.