ABSTRACT
LI, ZHONGHUA. Computational Analyses and Simulations of Fluid-structure Interactions Applied to Stented Abdominal Aortic Aneurysms (under the direction of Dr. Clement Kleinstreuer)
An abdominal aortic aneurysm (AAA) is the localized dilation, bulging, or ballooning of an abdominal aorta segment due to a degenerative arterial disease causing local wall weakness. Sudden AAA rupture could result in mortality up to 80%. Approximately 200,000 people in the United States are diagnosed to have AAAs and 15,000 Americans succumb every year. Since the introduction of endovascular techniques in the early 90s, endovascular aneurysm repair (EVAR) has stimulated considerable interest. In EVAR, starting from the femoral artery, a stent-graft is deployed into the affected segment thereby forming a new blood vessel and shielding the weakened AAA-wall from the pulsatile blood flow. There are clear benefits compared with conventional open surgery in terms of minimal incision, early-recovery, reduced mortality and morbidity. However, post-operative complications, such as stent-graft migration, endoleaks, endotension and device failure may still occur.
Because blood vessels and stent-grafts are flexible, interactions between blood flow and wall deformation can involve a wide range of fluid-mechanical phenomena. The flow will affect movement of the walls and wall movements in turn influence the flow field. Hence, simultaneous fluid-structure interactions (FSIs) should be considered when studying the hemodynamics and biomechanics of stented aneurysms. Presently, FSIs relevant to non-stented aneurysms have been only discussed by a few investigators; but, so far there are no publications of computational FSI results for stented AAAs. The complex fluid-structure interactions occur between the lumen blood, stent-graft, cavity blood with possible intraluminal thrombus, and AAA wall. Post-operative problems, such as endoleaks, stent-graft migration, endotension as well as device failure are all examples of FSI dynamics. Hence, transient 3D FSI is very important to study the hemodynamics and biomechanics of stented AAAs.
migration, mechanism of endotension, proper stent-graft placement as well as optimal surgical recommendations; and (iv) improved stent-graft design.
The AAA-rupture risk analysis shows that the most likely rupture site is located near the anterior distal side for anterior-posterior asymmetric AAAs and the right distal side in lateral asymmetric AAAs. The rupture risk of lateral asymmetric AAAs is higher than that of anterior-posterior asymmetric AAAs. The neck angle impacts flow fields and wall-stress distributions remarkably, while the iliac bifurcation angle affects blood flow patterns insignificantly but plays an important role in wall-stress contributions. The aneurysm monitoring program based on eight biomechanical risk factors can evaluate the severity of AAA-rupture risk and hence provides useful recommendations for endovascular surgeons.
The transient 3D FSI simulations demonstrate that a secure stent-graft placement can significantly reduce sac pressure, mechanical stress, pulsatile wall motion, and maximum AAA diameter, and hence may prevent AAA rupture effectively. However, in spite of the absence of endoleaks, a certain sac-pressure level may be caused by fluid-structure interactions between the luminal blood, stent-graft, cavity blood, and AAA wall. The multi-factorial, time-varying sac (or cavity) pressure can be predicted by the stent-graft/ AAA compliance ratio.
The simulation results indicate that stent-graft migration depends on multi-factors, including blood flow conditions, stent-graft and aneurysm geometries, as well as wall mechanical properties. Excessive AAA neck angle, iliac bifurcation angle, neck aorta-to-iliac diameter ratio, stent-graft size, aorto-uni-aorta-to-iliac stent-graft, hypertension, and blood waveform are the key factors causing stent-graft migration.
depends on the pressure difference between AAA cavity and lumen/branches. At elevated sac-pressure due to endoleaks, they may mitigate the risk of stent-graft migration.
In the present stent-graft models, a higher von Mises stress is observed near the bending point of stent wires with large curvatures. Nitinol diamond-shaped stents can produce more than 20% of neck oversize and generate hoop forces of 10 to 15N. In contrast, stainless steel is not suited for diamond stents because it cannot provide sufficient neck-oversizing to secure stent-graft anchoring. A z-bend stent is very ductile and suitable for largely angulated necks; but, its hoop force is very low, which implies that hooks or barbs should be considered to secure the neck anchor. The ultra-thin 0.1mm ePTFE graft material is not suited for z-bend stent-grafts due to its low yield stress. Woven polyester (PET) graft is appropriate for both diamond and z-bend stent-grafts. Z-bend stent-grafts have a large wall-compliance and are good at matching irregular necks or aneurysm geometries, while PET stent-grafts are better in reducing the level of endotension. Stents with a PET graft sheath generate minimum axial shortening and are suitable for precise device-deployment in aneurysms with complex geometries.
BIOGRAPHY
The author was born on Setp.16, 1970 in Shandong Province of P.R.China. After graduating high school, he was admitted to China University of Mining&Technology in 1990 and studied in the Department of Mechanical Engineering. He continued his graduate study in the same university focusing on fluid mechanics and power engineering and received his master degree in 1997. Afterwards the author was employed as a teaching&research assistant in the same department and worked on thermal energy and power engineering for two years. From 1999-2001, the author worked as a research assistant in Institute of Refrigeration & Cryogenics in Shanghai Jiaotong University.
The author enrolled as a doctoral student under the direction of Dr. Clement Kleinstreuer in August, 2002 in the Department of Mechanical and Aerospace Engineering at North Carolina State University in Raleigh, NC. His dissertation research focused on Computational Analyses and Simulations of Fluid-structure Interactions applied to Stented Abdominal Aortic Aneurysms.
ACKNOWLEDGMENTS
I express my gratitude to my committee chair and advisor, Dr. Clement Kleinstreuer, for his vision, ideas, guidance, and generous support. I thank the other members of my committee, Drs. Farber, Seelecke, Lyons and Echekki, for their contributions to this work through excellent teaching, constructive reviews, and supportive comments. As the collaborator of the project, Dr. Farber, an endovascular surgeon at UNC-CH, provided insightful suggestions, useful CT-scan models, and clinical data sets.
I am grateful to both past and present members of Dr. Kleinstreuer’s research group, including Dr. Zhe Zhang, Dr. Sinjae Hyun, Dr. Worth Longest, Dr. June Mo Koo, Huawei Shi, Zheng Li, and Burton Kennedy for their nice suggestions, helpful discussions, and critical analyses. Dr. Hyun has offered me very useful resources, providing insightful constructions and encouragement. I thank these aforementioned research colleagues.
Special thanks must be given to my parents for their support and assistance. I sincerely thank Dr. Jeffrey Weirbaugh and his family for their nice help, persistent support and great encouragement.
I am personally grateful to my wife, Yunzhen, for her patience, love, and support throughout my graduate career. Special debt of gratitude goes to my lovely son, David Li, who has spent most days and nights without staying with his father.
TABLE OF CONTENTS
LIST OF TABLES... ix
LIST OF FIGURES ... xi
PART I: BACKGROUND INFORMATION 1 INTRODUCTION AND OVERVIEW ... 1
1.1 Occurrences and Causes of Aneurysms...1
1.1.1 Aneurysms ...1
1.1.2 Causes ...1
1.1.3 Types...2
1.1.4 Symptoms and Diagnosis...4
1.1.5 Treatments...5
1.2 The Biomechanics of Abdominal Aortic Aneurysms...7
1.2.1 AAA Generation ...8
1.2.2 AAA Mechanical Properties ...12
1.3 AAA Rupture Prediction ...15
1.4 AAA Repair ...27
1.4.1 Open Surgery ...27
1.4.2 Endovascular Aneurysm Repair (EVAR)...28
1.5 Problems of EVAR ...35
1.5.1 Device Migration ...35
1.5.2 Endoleaks...39
1.5.3 Endotension ...42
1.5.4 Device Failure ...46
1.6 Research Objectives ...52
PART II: MATHEMATICAL MODELING 2 THEORY, METHODS AND MODEL VALIDATIONS...56
2.1 Fluid-structure Interaction (FSI) Theory ...56
2.1.1 Arbitrary Lagrangian Eulerian (ALE) Method ...56
2.1.2 Other Numerical Techniques for Moving Boundary Problems...59
2.2.1 Blood Flow Equations...62
2.2.2 Multi-structure Equations ...63
2.2.3 Sub-models ...65
2.3. Numerical Methods...67
2.3.1 CFX-ANSYS Coupling FSI Solver ...68
2.3.2 ANSYS Arbitrary Lagrangian-Eulerian FSI Solver ...70
2.4 Model Validations...72
PART III: RESULTS AND DISCUSSION 3 EFFECT OF AAA MORPHOLOGY ON FLOW PATTERNS AND WALL- STRESS DISTRIBUTIONS...77
3.1 Overview...77
3.2 System...79
3.2.1Aneurysm Model and Parameters...79
3.2.2 Numerical Method ...81
3.3 Results and Discussion ...83
3.3.1 Wall-stress and Flow Fields...83
3.3.2 Effect of AAA Morphology on Flow Patterns and Wall-stress Distributions ...97
3.4 Conclusions...108
4 ASSESSMENT AND PREDICTION OF AAA-RUPTURE RISK...109
4.1 Prediction of AAA Wall Stress...109
4.1.1 Modified Laplace Equation to Assess AAA Wall Stress...109
4.1.2 Comparison ...112
4.1.3 Justification...113
4.2 AAA Rupture Prediction...114
4.3 Monitoring of AAA Severity Parameter...115
4.3.1 Development of Biomechanical Factors...115
4.3.2 Monitoring Program for AAA-rupture Risk ...119
4.3.3 Validation...123
4.5 Conclusions...126
5 FSI ANALYSIS OF STENTED AAA ...128
5.1 Overview...128
5.2 CFX-ANSYS FSI Solver for 2D stented AAA...129
5.2.1 Model and Parameters...129
5.2.2 Numerical Method ...132
5.2.3 Results and Discussion ...133
Comparison between Non-stented and Stented AAAs ...134
Velocity, Pressure, and Resulting Stress...135
Migration Analysis...136
5.2.4 Conclusions...139
5.3 ANSYS ALE FSI Solver for 3D Stented AAA ...145
5.3.1 Model and Parameters...145
5.3.2 Numerical Method ...148
5.3.3 Results and Discussion ...149
FSI Analysis of 3D Stented AAA...149
Comparison between Non-stented and Stented AAA...161
Wall Deformation and Stress Changing with Time...166
Migration Force ...167
Sac Pressure ...167
Effect of Intraluminal Thrombus ...168
5.3.4 Conclusions...171
6 DEVICE MIGRATION...172
6.1 Overview ...172
6.2 System...173
6.2.1 Model and Parameters...173
6.2.2 Numerical Method ...176
6.3 Results and Discussion ...176
6.3.1 Aorto-uni-iliac Stent-graft and Hypertension ...176
6.3.3 Main-body/iliac-leg Diameter Ratio ...178
6.3.4 Main-body/iliac-leg Length Ratio...179
6.3.5 Iliac Bifurcation Angle ...180
6.3.6 Neck Angle ...180
6.3.7 Stent-graft Wall Compliance ...185
6.3.8 Blood Viscosity...186
6.3.9 Sac-pressure ...186
6.3.10 Blood Pressure Waveform ...188
6.4 Conclusions...189
7 ENDOLEAKS ...190
7.1 Overview...190
7.2 System...190
7.2.1 Model and Parameters...190
7.2.2 Numerical Method ...193
7.3 Results and Discussion ...193
7.3.1 Type I Endoleaks ...193
Type I-a Endoleak...193
Type I-b Endoleak...201
7.3.2 Type II Endoleaks ...203
Type II-a Endoleak ...203
Type II-b Endoleak ...207
Type II-c Endoleak ...210
7.3.3 Type III Endoleaks...213
7.4 Conclusions...216
8 ENDOTENSION...217
8.1 Overview...217
8.2 System...218
8.2.1 Model and Parameters...218
8.2.2 Numerical Method ...219
8.3.1 Sac Pressure and Wall Stress ...220
8.3.2 Mechanism of Endotension Generation...222
8.3.3 Factors Influencing Endotension ...223
Aneurysm Asymmetry ...223
Young’s Wall Moduli ...225
Aneurysm Volume ...227
Wall Thickness...228
Intraluminal Thrombus ...230
8.3.4 Intra-sac Pressure Prediction...231
8.4 Conclusions...234
9 BIOMECHANICAL ANALYSIS OF STENT-GRAFTS ...235
9.1 Overview...235
9.2 Stent-graft Design ...237
9.2.1 Stent-graft Characteristics...237
9.2.2 Shape Memory Alloys ...238
9.2.3 Self-expandable Nitinol Stent ...239
9.3 Stent-graft System...240
9.3.1Model and Materials ...240
9.3.2 Numerical Methods...242
9.4 Results and Discussion ...243
9.4.1 Effects of Neck Oversize on Wall Stress and Hoop Force ...243
9.4.2 Stent-graft Wall Stress ...250
9.4.3 Compliance of Stent-Graft...255
9.4.4 Axial Shortening ...257
9.5 Limitations ...258
9.6 Conclusions...258
10 OVERALL CONCLUSIONS AND FUTURE WORK...260
10.1 Overall Conclusions...260
10.2 Future Directions...261
LIST OF TABLES
Chapter 1
Table 1.1 Composition of normal aorta and aneurysm...9
Table 1.2 Stent-graft system ...31
Table 1.3 Comparison between open surgery and EVAR ...32
Table 1.4 Stent-graft specifications ...34
Table 1.5 Mechanisms of endotension from literature review ...44
Table 1.6 Attributes to stent-graft failure ...46
Chapter 2 Table 2.1 Comparison of results between simulations and theoretical analyses ...72
Table 2.2 Experimental parameters for stented aneurysm...75
Chapter 3 Table 3.1 Parameters required in the simulation ...80
Table 3.2 Assumptions for blood flow and structure characteristics...81
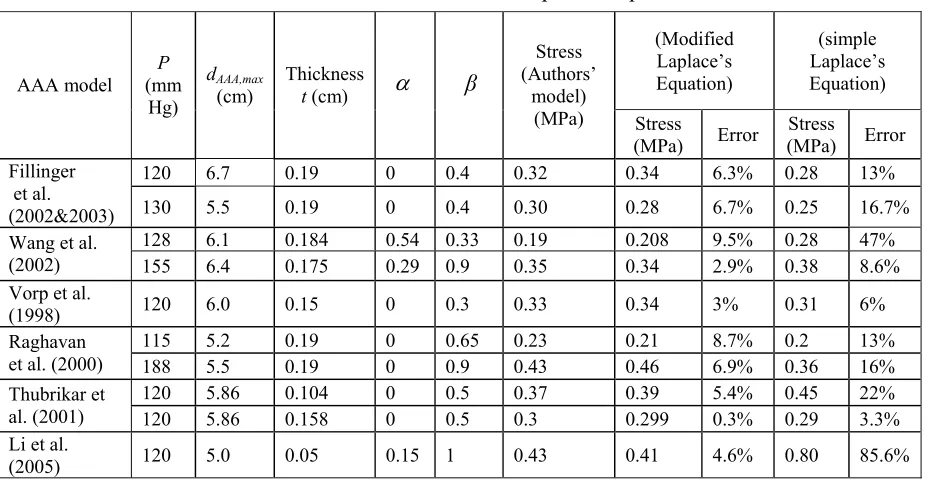
Chapter 4 Table 4.1 Validation of the modified Laplace’s equation...113
Table 4.2 Parameters used in AAA rupture prediction ...114
Table 4.3 Severity parameters for AAA rupture...116
Table 4.4 Validation of severity parameters for AAA rupture prediction ...123
Table 4.5 Rupture rate and surgery repair attitude ...124
Chapter 5 Table 5.1 Parameters required in the simulation ...131
Table 5.2 Assumptions for blood flow and structure characteristics...146
Table 5.3 Parameters required in the simulation ...147
Chapter 6 Table 6.1 Relationship between neck angle and migration risk ...183
Chapter 7
Table 7.1 Assumptions for blood flow and structure characteristics...192 Chapter 8
Table 8.1 Parameters required in the simulation ...219 Chapter 9
Table 9.1 Comparison of axial shortening between different stent-grafts
LIST OF FIGURES
Chapter 1
Figure 1.1 Schematic of thoracic aortic aneurysm...2
Figure 1.2 Dissecting aortic aneurysm...3
Figure 1.3 Abdominal aortic aneurysm ...3
Figure 1.4 Brain aneurysms ...4
Figure 1.5 Endovascular repair for aortic aneurysms ...6
Figure 1.6 Endovascular repair for cerebral aneurysm...7
Figure 1.7 AAA growth and rupture ...8
Figure 1.8 Schematic structure of artery...8
Figure 1.9 Collagen and elastin fibers in artery wall ...9
Figure 1.10 Comparison between AAA and normal aorta ...10
Figure 1.11 Three stages of AAA degeneration ...11
Figure 1.12 Stiffness of abdominal aortic aneurysm in men and women ...12
Figure 1.13 Effect of yield stress decrease on AAA ...13
Figure 1.14 Breaking stress decreases with age in a thoracic aorta ...13
Figure 1.15 Tensile strength of ascending thoracic aortic aneurysm ...15
Figure 1.16 Effect of ILT on tensile strength ...15
Figure 1.17 Open sugary...27
Figure 1.18 Endovascular repair for abdominal aortic aneurysm...29
Figure 1.19 Effect of endovascular repair for abdominal aortic aneurysm ...30
Figure 1.20 Schematics of stent-grafts...30
Figure 1.21 Schematics of AAA anatomy ...33
Figure 1.22 Schematic of stent-graft migration ...35
Figure 1.23 Enhanced neck fixation with hooks...36
Figure 1.24 Schematics of endoleaks...39
Figure 1.25 Fracture of stent wire...47
Figure 1.26 Metal corrosion...48
Figure 1.28 Stent row separation caused by suture fracture ...50
Chapter 2 Figure 2.1 Flow chart of numerical FSI procedure...67
Figure 2.2 Flow chart of CFX-ANSYS coupling solver...68
Figure 2.3 Coupled CFX-ANSYS procedure ...69
Figure 2.4 ANSYS ALE FSI Solution algorithm ...71
Figure 2.5 Comparison of velocity distributions between coupled CFX-ANSYS results and Womersley’s theory...74
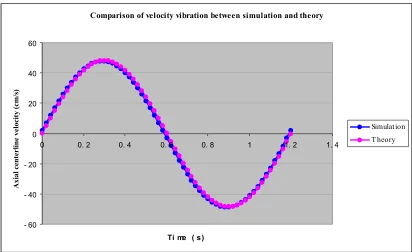
Figure 2.6 Comparison of local velocity variations with time between coupled CFX-ANSYS simulations and Womersley’s theory...74
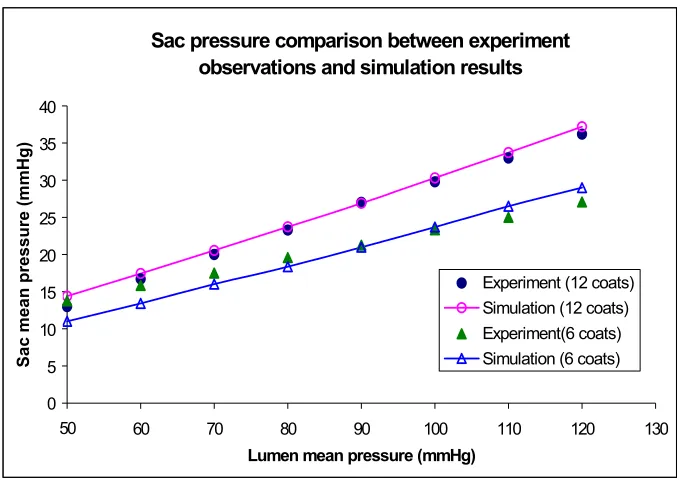
Figure 2.7 Comparison between simulation and experimental data ...75
Figure 2.8 Comparison between simulation and experimental data ...76
Chapter 3 Figure 3.1 Schematics of AAA models ...79
Figure 3.2 Boundary conditions...81
Figure 3.3 Model mesh ...82
Figure 3.4 3D contours of blood pressure, wall deformation and stress (t/T=0.2) ...86
Figure 3.5 Contours of pressure and wall deformation (mid-plane, t/T=0.1)...87
Figure 3.6 Contours of pressure and wall deformation (mid-plane, t/T=0.2)...88
Figure 3.7 Contours of pressure and wall deformation (mid-plane, t/T=0.27)...89
Figure 3.8 Contours of velocity and wall stress and velocity vector (mid-plane, t/T=0.1)...90
Figure 3.9 Contours of velocity and wall stress and velocity vector (mid-plane, t/T=0.2)...91
Figure 3.10 Contours of velocity and wall stress and velocity vector (mid-plane, t/T=0.27)...92
Figure 3.11 Contours of velocity and wall stress and velocity vector at slice A-A...93
Figure 3.12 Contours of velocity and wall stress and velocity vector at slice B-B ...94
Figure 3.13 Contours of velocity and wall stress and velocity vector at slice C-C ...95
Figure 3.15 Comparison between symmetric and asymmetric AAAs
(contour: wall stress, MPa) ...102
Figure 3.16 Effect of iliac angle on lateral asymmetric AAA (contour: wall stress, MPa) ...103
Figure 3.17 Effect of neck angle on lateral asymmetric AAA (contour: wall stress, MPa) ...104
Figure 3.18 Effect of iliac angle on anterior-posterior asymmetric AAA (contour: wall stress, MPa) ...105
Figure 3.19 Effect of neck angle on anterior-posterior asymmetric AAA (contour: wall stress, MPa) ...106
Figure 3.20 Wall stress and deformation distributions ...107
Chapter 4 Figure 4.1 Schematic of abdominal aortic aneurysm ...111
Figure 4.2 Relationship between wall stress and maximum diameter...112
Figure 4.3 Relationship between wall stress and thickness ...112
Figure 4.4 Relationship between wall stress and blood pressure...112
Figure 4.5 Relationship between wall stress and ILT/AAA area ratio ...112
Figure 4.6 Relationship between wall stress and asymmetry index ...113
Figure 4.7 Program of monitoring AAA-rupture risk...120
Figure 4.8 Interface of basic information input ...120
Figure 4.9 Input measurement data...121
Figure 4.10 Table of analyzed results ...121
Figure 4.11 Example of patient-I ...122
Figure 4.12 Example of patient-II...122
Chapter 5 Figure 5.1 Schematic of stented AAA model with inlet/outlet profiles ...130
Figure 5.2 Mesh of stented-AAA model...133
Figure 5.3 Comparison between stented and non-stented AAAs ...140
Figure 5.4(a) Comparison of AAA wall deformation changes with time (t/T=0.2) ...141
Figure 5.4(c) Sac pressure changes with time ...141
Figure 5.5 Profiles of Von Mises stress, velocity and sac pressure for stented AAA model...142
Figure 5.6 Relationship between maximum stent-graft fixation force and friction coefficient...143
Figure 5.7 Relationship between maximum stent-graft fixation force and neck...143
Figure 5.8 Relationship between maximum stent-graft fixation force and blood pressure ...144
Figure 5.9 Relationship between maximum stent-graft fixation force and neck dilation...144
Figure 5.10 Influence of neck configuration on maximum stent-graft fixation force ...145
Figure 5.11 Schematic of stented aneurysm model ...146
Figure 5.12 3D contours of blood pressure and wall stress (t/T=0.2) ...151
Figure 5.13 Contours of blood pressure and wall deformation in mid-plane (t/T=0.1)...152
Figure 5.14 Contours of blood pressure and wall deformation in mid-plane (t/T=0.2)...153
Figure 5.15 Contours of blood pressure and wall deformation in mid-plane (t/T=0.27).154 Figure 5.16 Contours of velocity and wall stress and velocity vector mid-plane (t/T=0.1)...155
Figure 5.17 Contours of velocity and wall stress and velocity vector mid-plane (t/T=0.2)...156
Figure 5.18 Contours of velocity and wall stress and velocity vector mid-plane (t/T=0.27)...157
Figure 5.19 Contours of velocity and wall stress and velocity vector in Slice...158
Figure 5.20 Contours of velocity and wall stress and velocity vector in Slice ...159
Figure 5.21 Contours of velocity and wall stress and velocity vector in Slice...160
Figure 5.22 Benefits of stent-graft placement on blood flow and AAA wall (t/T=0.27)...162
Figure.5.23 Wall stress levels and blood flow directions between non-stented and stented AAA s (t/T=0.1)...163
Figure 5.25 Wall stress levels and blood flow directions between non-stented
and stented AAA s (t/T=0.27)...165
Figure 5.26 Changes in maximum AAA diameter and wall stress as a function of time ...166
Figure 5.27 stent-graft migration force changing with time ...167
Figure 5.28 Sac pressure changing with time ...168
Figure 5.29 Influence of sac thrombus on AAA wall stress and stent-graft drag force (t/T=0.27) ...169
Figure 5.30 Influence of sac thrombus on AAA wall and blood flow (t/T=0.27) ...170
Chapter 6 Figure 6.1 AAA-systems with inlet/outlet profiles...174
Figure 6.2 Schematics of stent-graft models...175
Figure 6.3 Effect of aorto-uni-iliac stent-graft and hypertension on migration...177
Figure 6.4 Effect of stent-graft size on migration...178
Figure 6.5 Effect of main-body/iliac-leg diameter ratio on migration...179
Figure 6.6 Effect of main-body/iliac-leg length ratio on migration...179
Figure 6.7 Effect of iliac bifurcation angle on migration ...180
Figure 6.8 Effect of neck angle on migration force ...181
Figure 6.9 Effect of neck angle on migration value...184
Figure 6.10 Effect of neck angle on migration rate ...184
Figure 6.11 Effect stent-graft compliance on migration force...185
Figure 6.12 Effect of blood viscosity on migration force...186
Figure 6.13 Effect of sac pressure on migration force...187
Figure 6.14 Effect of pressure waveform on migration force...188
Chapter 7 Figure 7.1 Schematics of stented AAA model...191
Figure 7.2 Inlet and outlet boundary conditions ...192
Figure 7.3 Effect of Type I-a endoleak on stented AAA (Mid-plane, t/T=0.27) ...197
pressure distributions (t/T=0.27)...198
Figure 7.6 Effect of Type I-a endoleak on sac pressure ...199
Figure 7.7 Effect of Type I-a endoleak on maximum AAA wall stress ...199
Figure 7.8 Effect of Type I-a endoleak on stent-graft migration force ...200
Figure 7.9 Effect of Type I-a aperture size on leakage rate...200
Figure 7.10 Effect of Type I-a aperture size on sac pressure...200
Figure 7.11 Effect of Type I-a aperture size on maximum AAA wall stress ...201
Figure 7.12Effect of Type I-a aperture size on stent-graft migration force...201
Figure 7.13 Effect of Type I-b endoleak on stented AAA (Mid-plane, t/T=0.27) ...202
Figure 7.14 Sac pressure comparison between different Type I endoleaks...203
Figure 7.15 Sac pressure and leakage rate vary with time (Type II-a endoleak)...205
Figure 7.16 Effect of Type II-a endoleak on stented AAA (Mid-plane, t/T=0.12) ...206
Figure 7.17 Maximum AAA wall stress and stent-graft migration force vary with time (Type II-a endoleak) ...207
Figure 7.18 Effect of Type II-b endoleak on stented AAA (Mid-plane, t/T=0.27) ...208
Figure 7.19 Sac pressure and leakage rate vary with time (Type II-b endoleak) ...209
Figure 7.20 Maximum AAA wall stress and stent-graft migration force vary with time (Type II-b endoleak)...209
Figure 7.21 Sac pressure and leakage rate vary with time (Type II-c endoleak)...211
Figure 7.22 Effect of Type II-c endoleak on stented AAA (Mid-plane, t/T=0.27) ...212
Figure 7.23 Maximum AAA wall stress and stent-graft migration force vary with time (Type II-c endoleak) ...213
Figure 7.24 Effect of Type III endoleak on stented AAA (Mid-plane, t/T=0.27) ...214
Figure 7.25 Sac pressure and leakage rate vary with time (Type III endoleak) ...215
Figure 7.26 Maximum AAA wall stress and stent-graft migration force vary with time (Type III endoleak)...215
Chapter 8 Figure 8.1 Schematic of stented aneurysm and boundary conditions...218
Figure 8.2 Relationship between EVG lumen pressure, sac pressure and aneurysm wall stress ...221
Figure 8.4 Mechanism of endotension generation...222
Figure 8.5a Midplane view of a typical asymmetric aneurysm ...223
Figure 8.5b Artery neck (dashed line) projected onto the plane of maximum aneurysm cross section. ...223
Figure 8.6 Influence of aneurysm asymmetry on sac pressure and wall stress ...224
Figure 8.7 Influence of aneurysm wall Young’s modulus on sac pressure and aneurysm wall stress ...226
Figure 8.8 Influence of EVG wall Young’s modulus on sac pressure and aneurysm wall stress ...226
Figure 8.9 Influence of aneurysm volumes on sac pressure and aneurysm wall stress ..227
Figure 8.10 Influence of aneurysm wall thickness on intra-sac pressure and aneurysm wall stress ...229
Figure 8.11 Influence of aneurysm EVG thickness on intra-sac pressure and aneurysm wall stress ...229
Figure 8.12 Influence of ILT volume on the intra-sac pressure and aneurysm wall stress ...231
Figure 8.13 Relationship between sac pressure and EVG/aneurysm wall compliance and saccular index ...233
Chapter 9 Figure 9.1 Balloon-expandable stent and self-expandable stent...236
Figure 9.2 Characteristics of shape memory alloy...239
Figure 9.3 Geometry and mesh of diamond stent-graft model ...241
Figure 9.4 Geometry and mesh of z-bend stent-graft model ...242
Figure 9.5a Two common loading modes for stents...243
Figure 9.5b Schematic of hoop force caused by neck oversize ...244
Figure 9.6 Wall stress (von Mises) distribution in diamond stent with 20% of oversize ...245
Figure 9.7 Comparison of stress between different stent materials (diamond stent )...246
Figure 9.8 Comparison of hoop force between different stent materials (diamond) ...247
Figure 9.10 Comparison of stress between different stent materials (z-bend stent)...249
Figure 9.11 Comparison of hoop force between different stent materials (z-bend stent) ...249
Figure.9.12 Stress (von Miese) distributions in diamond stent-graft model (p=120 mmHg) ...251
Figure 9.13 Comparison of stent-stress in different stent-graft materials ...252
Figure 9.14 Comparison of graft-stress in different stent-graft materials ...252
Figure 9.15 Stress (von Mises) distributions of z-bend stent-graft (p=120 mmHg)...253
Figure 9.16 Comparison of stent-stress in different stent-graft materials (z-bend)...254
Figure 9.17 Comparison of graft-stress in different stent-graft materials (z-bend)...255
PART I: BACKGROUND INFORMATION
CHAPTER
1
1 INTRODUCTION AND OVERVIEW
1.1 Occurrences and Causes of Aneurysms
1.1.1 Aneurysms
An aneurysm is a local blood vessel ballooning greater than 50% of its nominal
diameter with a risk of sudden rupture. Aneurysms may result from local
weakening/deterioration of blood vessel walls, caused by disease, sudden injury, or
from birth. Aneurysms usually appear fusiform or saccular (see Fig.1.4). A thrombus is
often lined on the inside wall of an aneurysms. The patient could bleed to death in case
of a sudden aortic aneurysm rupture. If a cerebral aneurysm bursts, a stroke may occur.
Approximately 2,200,000 people in the United States are annually diagnosed with
aneurysms and 18,000 Americans are killed by all types of aneurysms.
1.1.2 Causes
Presently, causes of aneurysms include mainly atherosclerosis, atheroma, syphilis,
congenital defects, heart attacks, smoking, obesity, hypertension, trauma, inflammation
and/or hereditary conditions (e.g., Marfan's syndrome), as well as hemodynamics and
the arteries" called arteriosclerosis. At least 80% of aortic aneurysms are from
arteriosclerosis. However, the exact reason leading to aneurysm generation and rupture
is not very clear. It seems that aneurysm formation and rupture is a multi-factorial
problem. Many controversies still exist in this research field.
1.1.3 Types
Although aneurysms can occur in any blood vessel, i.e., artery or vein, there are
mainly four types of aneurysms with life-threatening risks: brain aneurysms, thoracic
aortic aneurysms, dissecting aortic aneurysms and abdominal aortic aneurysms (AAAs).
Thoracic Aortic Aneurysms. Thoracic aortic aneurysms (Fig.1.1) occur in the chest and can be detected with chest X-rays or CT-scans. Most thoracic aortic aneurysms
have no symptoms. Sudden rupture can cause rapid blood loss and death. Clinically,
thoracic aneurysms are not as common as brain or abdominal aortic aneurysms.
Hereditary conditions (e.g., Marfan's syndrome) are believed to be the main reason
causing thoracic aortic aneurysms.
Normal aorta
Descending aorta
Fig.1.2 Dissecting aortic aneurysm (Source: http://www.mayoclinic.org)
Fig.1.3 Abdominal aortic aneurysm (Source: http://www.mayoclinic.org)
Dissecting Aortic Aneurysm. A dissecting aneurysm (Fig.1.2) results from a tear between
the tissue layers of the aorta, caused by blood
flow pumped from the heart. This tear usually
occurs in the aorta close to the heart. Clinically,
the aorta is seldom dilated before the dissection
occurs. Risk factors include high blood pressure,
particularly high diastolic blood pressure.
Abdominal Aortic Aneurysm. As shown in Fig.1.3, abdominal aortic aneurysms are located
in abdominal aorta (below renal arteries and
above iliac bifurcation). 75% of abdominal aortic
aneurysms occur in people over 60 years of age.
The AAA shapes are irregular, including bulge,
prism, zigzag, boat, cylinder etc. Different
patients have different AAA shapes.
Brain Aneurysms. A brain aneurysm is a weak ballooning in the brain’s blood vessels (Fig.1.4).
Clinically, it is also called a cerebral or intracranial aneurysm. Brain aneurysms usually
occur at a branch of the brain arteries. If the brain aneurysm reaches a certain size (i.e.,
>2.5cm), the aneurysm may generate pressure on the surrounding brain tissue and cause
progressive problems. If an aneurysm ruptures and bleeds into the brain, stroke or death
may occur. 60% of people with ruptures will die within a year.
Tissue layer tear
1.1.4 Symptoms and Diagnosis
Symptoms of aneurysm will depend upon the location of the aneurysm. Most
aneurysms have no symptoms and can be detected with X-rays or Ultrasound images
during a routine examination. When symptoms occur, they could include a pulsing
sensation, pain, difficult swallowing, coughing or hoarseness. A ruptured aneurysm can
cause a severe pain. Most aneurysms have thrombi in the aneurysm cavities, which
probably leads to the danger of embolisms in distant organs.
(http://www.healthscout.com/ency/197/198/main.html).
Aneurysms can be detected by simple physical examination, e.g., X-rays or
Ultra-sonography. Angiography, Computed Tomography (CT) and Magnetic Resonance
Imaging (MRI) are commonly used for detecting AAAs. CT scans can detect the
location and shape with precision.
Fig.1.4 Brain aneurysms (Source: 2001 eCureMe.com)
Saccular Fusiform
1.1.5 Treatments
Open Surgical Repair. For aortic aneurysms, an incision is made in the patient’s chest and/or abdomen, the thrombus in the aneurysm is removed and the weakened portion of
the aorta is replaced with an artificial implant, called a graft (PTFE or Dacron). The
graft forms a new channel and allows blood to pass through it without causing a bulge.
When treating a cerebral aneurysm via open surgery, a section of the skull has to be
removed. To block blood flow into the aneurysm region, a tiny metal clip is usually
placed across the aneurysm neck
(http://www.brainaneurysm.com/aneurysm-treatment.html). In conventional open repair of an aneurysm, the patient must face a
large incision and possible pain. Hospitalization and recovery time are quite long.
Serious complications may occur.
Minimally Invasive Endovascular Repair. Minimally invasive endovascular repair is a new technology developed in the 1990s. Instead of open aneurysm repair, minimally
invasive treatment is performed inside the patient’s body using long catheters guided by
X-rays or other screens. For aortic aneurysms, the surgeon makes a small incision in
femoral artery and then passes the stent-graft through the leg artery to the aneurysm site.
After it is correctly positioned in the abdominal aorta, the stent-graft is released and
restores to its original shape under self-expandable or balloon-expandable mechanisms.
After expansion of the stent-graft, the delivery catheter is withdrawn. The aneurysm
cavity is excluded via the stent-graft. Blood flows though a new synthetic vessel
protecting the weakened aneurysm wall (http://www.vascularweb.org). Thus, the blood
pressure load is carried by the stent-graft and the aneurysm rupture is prevented
In case of a cerebral aneurysm, a catheter is also delivered starting from the
femoral artery to the head and into the aneurysm. To block blood flow into the
aneurysm and prevent rupture, tiny platinum coils are threaded through the catheter and
deployed into the aneurysm cavity. This endovascular coiling of the aneurysm is also
called embolization. If the opening of the aneurysm is too wide, a stent is often used to
prevent the coils from descending into the main artery (see Fig.1.6). More than 125,000
patients with cerebral aneurysm worldwide have been treated with detachable platinum
coils. (http://www.brainaneurysm.com).
Stent-graft
Fig.1.5 Endovascular repair for aortic aneurysms (Source: http://www.vascularweb.org; http://www.xueguan.net; http://www.slrsurgery.org/programs/aneurysm.html)
1.2 The Biomechanics of Abdominal Aortic Aneurysms
90 % of aortic aneurysms are located between renal arteries and iliac bifurcation,
called abdominal aortic aneurysms (AAAs). AAAs occur in 5-7% of people over 60.
About 200,000 patients are diagnosed with AAAs every year in the United States. It is
estimated that 15,000 patients die each year from ruptured AAA in the US, i.e., 80% of
total deaths caused by all types of aneurysms. AAA rupture is the 12th to 13th leading
cause of death in the US. The AAA characteristics are as follows:
z The ratio of male to female is 4:1; but, the rupture risk is four times in females than
in males even for the same AAA size.
z 75% of AAA patients are over the age of 60.
z The AAA wall distensibility decreases significantly with the increase in size.
z 80% of AAAs include thrombi;
z 90% have calcification in the wall.
Fig.1.6 Endovascular repair for cerebral aneurysm (Source: http://www.brainaneurysm.com) Stent
z 90% of the patients have no symptoms before rupture (see Fig.1.7).
1.2.1 AAA Generation
The arterial wall mechanics and
integrity are mainly determined by
the matrix components of the wall.
As shown in Figs.1.8&1.9, these are
predominantly elastin, collagen and
smooth-muscle cells. The distensible
elastin is load-bearing at low
pressures and responsible for the
elastic recoil of the artery. Collagen
is 1000 times stiffer and is
load-bearing at high pressures, preventing
over-dilation and rupture of the vessel. Smooth muscle cells have the potential for
contraction and relaxation with modulation of wall mechanics. The latter seems to be of
minor importance in the abdominal aorta. Thus, the collagen-to-elastin ratio is the Fig.1.8 Schematic structure of artery (Source:
The McGROW-Hill Companies, Inc) Fig.1.7 AAA growth and rupture (Source: http://www.xueguan.net)
principal determinant of wall
mechanics in the aorta. Changes in
composition and structure of the
arterial wall will alter wall
mechanics. The increasing
collagen-to-elastin ratio may alter
the wall structure, resulting in
increased wall stiffness and
decreased tensile strength. Clinical
observations show that most AAA
walls become progressively stiffer
as the diameter increases. This is because of biomechanical restructuring of the wall. In
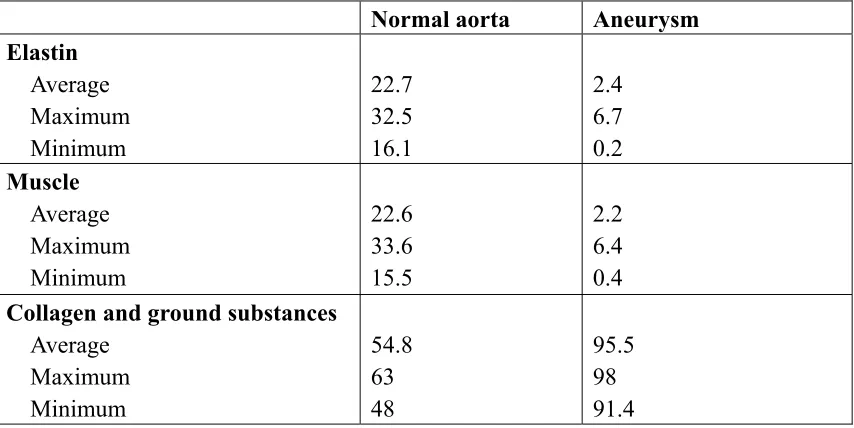
the normal abdominal aorta, the collagen-to-elastin ratio is about 1.58 (Nichols&
O’Rourke 1990). However, the collagen-to-elastin-ratio is much higher in AAAs (Table
1.1).
Table 1.1 Composition of normal aorta and aneurysm (after He and Roach., 1994)
Normal aorta Aneurysm Elastin
Average Maximum Minimum
22.7 32.5 16.1
2.4 6.7 0.2
Muscle
Average Maximum Minimum
22.6 33.6 15.5
2.2 6.4 0.4
Collagen and ground substances
Average Maximum Minimum
54.8 63 48
95.5 98 91.4
As shown in Fig.1.10, the σ −ε of AAA moves to the left considerably. The
elastic modulus is much higher than that in the normal aorta, while its breaking stress
decreases significantly. Fig.1.11 indicates the three stages of the AAA generation. In
Stage I, elastin begins degradation and more collagen is produced. The increase of
collagen-to-elastin ratio is the indicator of AAA beginning formation. In Stage II, even
though the collagen begins degradation but largely offset by more collagen production.
However, the remodeling ability of the AAA wall becomes weak due to the accelerating
collagen degradation. Under the load of blood pressure, the AAA wall begins rapidly
expanding and finally ruptures (Stage III). That is, the elastin degradation is the key step
in the development of AAA, whereas collagen degradation is ultimately required for
AAA rupture.
Fig.1.10 Comparison between AAA and normal aorta (after: Raghavan 2002) Breaking stress of normal abdominal aorta
Breaking stress of AAA
Elastic modulus
σ
Even though elastin and collagen degradation are the key reason to cause AAA
generation, deterioration and rupture, the exact pathophysiology to cause the
elastin/collagen degradation is still unknown. Generally, pathophysiologic processes
include:
z Atherosclerosis
z Hemodynamics
z Inherited susceptibility
z Chronic inflammation and neovascularization
z Immunologic responses and inflection
z Structural remodeling of the extracelluar matrix
z Matrix-degrading proteinases and inhibitors
z Gelatinases, stromelysins, macrophage elastase
z Regulation of MMP activeities
1.2.2 AAA Mechanical Properties
So far, many investigators try to find the AAA rupture mechanism focusing on
changes of mechanical properties in arterial wall. Sonesson et al. (1999) and Lanne et al.
(1992) declared that the aortic stiffness of aneurysm wall is exponentially increasing
with age in men and women (see Fig.1.12). However, enhanced wall stiffness is not
necessarily advantageous for preventing AAA rupture, because along with the increase
of wall stiffness, the wall yield stress will accordingly decrease. As a case in point,
Raghavan et al. (2000) stated that Young’s modulus in an AAA wall may reach 4.66
MPa, which is about three times that in normal arterial wall; whereas its yield stress is
only 50% of the normal artery. Thus, although large Young’s modulus may reduce
AAA-wall stress, the yield stress is possibly lower than the mechanical stress in the
AAA wall, i.e., AAA rupture still may occur when the wall becomes stiffer (see
Fig.1.13). Groenink et al. (1999) investigated the influence of aging and hence stiffness
on the breaking stress in the descending aorta. They found that the average breaking
(Sonesson et al., 1999)
stress was 2.7 MPa and decreasing correlated with age. Wilson et al. (2003) found that a
when compared to AAAs without wall stiffness changes. They also indicated that from
the time of AAA observation to elective repair, the wall stiffness appears to increase,
while the wall stiffness in ruptured AAAs is less than that in elective repaired AAAs. It
implies that there is a maximum stiffness before rupture. They declared that the reason
of fast expansion before rupture is due to the failure of restructuring and accelerating
degradation of collagen.Thus, the change of wall stiffness may be a strong player in
AAA rupture. Vorp et al. (2003) studied the effect of aneurysm on the tensile strength
and found that the stiffness in an aneurysm is 72% higher than in a normal artery, while
the tensile strength is 29-34% lower (see Fig.1.15) Based on experiments, Flora et al.
(2002) indicated that AAA wall mechanics contributor more significantly to peak wall
stress than pressure variations and techniques to measure the rate of deterioration may
predict AAA rupture. Thubrikar et al. (2001) tested the breaking strength in AAA and
found that different location has very different yield stress in AAA, which changes from
0.47-0.74 MPa. However, Raghavan et al. 1996 reported that the yield stress is
significantly lower for the aneurysm group than for the normal group (0.65 MPa vs. 1.2
MPa). Inzoli et al. (1993) studied the biomechanical factors in abdominal aortic
aneurysm rupture and found that atherosclerosis plaques can cause stress concentration
and a significant increase in AAA wall stress. Maybe it is one reason that the small AAA
still can rupture. Even though ILT is taken as the help to reduce the wall stress, Vorp et
al. (2001) stated that an ILT can decrease the ultimate AAA strength dramatically. They
found that the strength of an AAA with 4 mm ILT decreases 20% compared to an AAA
with ILT less than 1 mm. Hypoxia, i.e., oxygen deficiency caused by an ILT, is the main
reason for wall strength reduction (Fig.1.16).Therefore, if the degeneration of the wall
1.3 AAA Rupture Prediction
Practically, once the induced mechanical stress exceeds the ultimate strength of the AAA wall, rupture is going to happen. However, because direct mechanical stress
Fig.1.16
(Vorp et al., 2003)
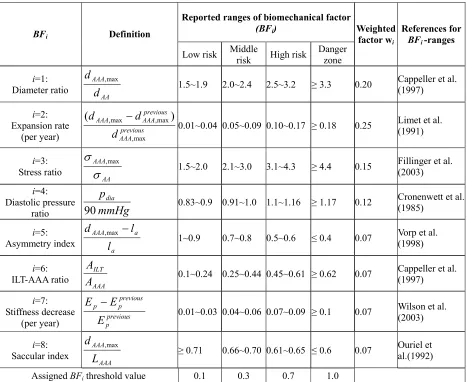
measurements are not available in vivo, key biomechanical factors (BFs) influencing
AAA rupture are employed to estimate the risk of rupture and to determine when
elective repair, i.e., open surgery or endovascular repair, is necessary. Several possible
AAA-rupture indicators have been proposed in publications, including maximum AAA
diameter, expansion rate, mechanical stress, diastolic pressure, asymmetry index,
stiffness, intraluminal thrombus ratio, saccular index, wall curvature, gender, serum
elastin peptide, the ratio of AAA diameter to the third lumbar vertebral and others.
Maximum Diameter. As established, the larger the maximum AAA diameter, the higher is the rupture risk. Clinical data showed that the rupture risk is exponentially
related to the maximum AAA diameter. For example, Myers et al. (2001) stated that for
abdominal aortas 1.9cm≤dAA≤ 2.6cm, the rupture chance in AAAs with maximum
diameters less than 4.0cm, 4.0-4.9cm, 5.0-5.9cm, 6.0-6.9 and greater than 7.0 is 2%,
3.2%, 25%, 35% and 75%, respectively. In 3-month to 10-year follow-up studies,
Darling et al. (1970&1976) found that the rupture risk in AAAs less than 4cm, 4-5cm,
5-7cm and 7-10cm in the maximum transverse diameter is 8%, 25%,50% and 64%,
respectively. Presently, the maximum transverse diameter, dAAA,max, is taken as the main
criterion for judging the necessity of surgical intervention in asymptomatic AAAs due to
its simple measurement. However, there is no consensus for a threshold value regarding
the appropriate diameter for intervention. Some investigators regarded 5.5cm as the
threshold for elective repair. To prove this point, the UK Small Aneurysm Trial showed
that there is no benefit from early surgical repair of asymptomatic AAAs of 4.0 to 5.5
cm (Myers et al., 2001). Although it is obvious that a large AAA is more prone to
rupture than small ones, there is still clinical evidence that small aneurysms can rupture
cm ruptured in their clinical investigations. Furthermore, Fillinger et al. (2003) reported
that 10-24% of the ruptured AAAs were 5 cm or less in maximum diameter. Clinically,
the maximum AAA transversal diameters of 5 cm for women and 6 cm for man are
most commonly used to recommend surgical intervention (Heikinen et al., 2002).
Because of the well-known difference in aorta diameter (1.5 cm-2.5cm) for different
patients, the simple criterion of AAA maximum diameter is not accurate to evaluate all
patients. As a case in point, the individual-independent parameter, i.e., the ratio
AA AAA
d d ,max
=
χ seems better than the maximum AAA diameter alone. The numerical
simulation results of Li & Kleinstreuer (2005) and clinical study of Cappeller et al.
(1997) confirm that threshold values of χ =2.2and 2.2 and 3.3 for elective repair and
possible rupture prediction may provide more reasonable recommendations than AAA
size alone.
More significantly, other anatomic variables may be very influential; for
example, shape eccentricity, wall thickness, blood pressure, intraluminal thrombus and
other biomechanical properties. Thus, the maximum AAA diameter is an important
parameter but insufficient to predict AAA rupture.
Expansion Rate. Besides the maximum transverse diameter, the expansion rate is another important indicator for AAA rupture. Clinically, a high expansion rate, say from
0.5 cm per year and up, is often associated with a high risk of rupture (Thubrikar et al.,
2000; Hirose et al.,1998). According to Wolf et al. (1994), if the expansion rate reaches
more than 0.5 cm/year, elective repair should be considered even if dAAA,max < 5cm.
However, Scott et al. (1999) regarded a growth rate of more than 1cm per year as one of
the principal indicators for AAA operation. There is evidence that the growth rate is not
Vardulaki et al. (1998) found that the growth rate may differ with the initial AAA
diameter, where more rapid growth occurs in larger AAAs (i.e., 5 cm or more),
independent of gender and age. Hallin et al. (2001) reported that AAA expansion
averaged 0.2-0.4 cm per year for AAAs smaller than 4 cm, 0.2-0.5cm/year for AAAs of
4-5 cm and 0.3-0.7 cm/year for those larger than 5 cm, and the associated rupture risk at
four years was 2%, 10% and 22 % respectively. In addition, Brown et al. (2003)
described that the mean expansion rate in patients with ruptured AAAs was 0.84cm/year
compared to 0.39cm/year in non-ruptured AAAs. Hirose et al. (1998) indicated that
AAA began to grow faster at about three months before rupture. They also established a
bi-exponential correlation between AAA expansion rate and time, i.e., the closer the
time to rupture, the faster was the expansion rate. Similarly, Limet et al. (1991) fitted an
exponential model describing growth rate, and provided thresholds of 10.6% /year and
18%/year for elective AAA repair and rupture prediction, respectively. To the contrary,
Choyke et al. (1993) declared that the use of a fast expansion rate as an indication for
surgery makes sense but has never been validated for small AAAs. Based on clinical
observations, Sharp et al. (2003) found that a rapid increase in AAA diameter is not an
indicator for elective AAA repair. Combining the research results of Thompson et al.
(2000) and Bernstein et al. (1984), the rupture rate is proportionally related to the
growth rate when GR >0.5 cm/year; and that there is no significant correlation if the
GR< 0.5 cm/year.
Mechanical Stress. The general consensus is that the peak wall stress is the best indicator of AAA rupture, although the maximum AAA diameter and growth rate as
well as aortic neck asymmetry are very important and easier to measure. Generally,
in AAA rupture analyses. However, because of the complex mechanism of rupture and
often complex AAA geometries, which stress actually causes AAA rupture remains
unresolved. Furthermore, how to define the critical threshold-value and yield stress in
different patients is not clear. Because stress measurements are not available in vivo,
software packages for structural analysis, such as ANSYS, ABAQUS, ADINA, and
FIDAP are efficient tools. For example, Di Martino et al. (2001) employed the
finite-element software FIDAP to simulate fluid-structure interaction in realistic AAA models,
and indicated that the complicated AAA geometry would affect the stress distribution
considerably. Raghavan et al. (2000) used ANSYS to simulate three-dimensionally
reconstructed AAA models and found that the 5-cm AAA-diameter criterion as a
rupture predictor was not sufficient. To test the validation of wall stress as the rupture
criterion, Fillinger et al. (2002 & 2003) did in vivo analyses of mechanical wall stress
and AAA-rupture risk, and suggested that the peak wall stress seems to be superior to
maximum AAA diameter in predicting rupture risk. Thubrikar et al. (2001) found that
different regions of an AAA had different yield stresses, yield strains and other
mechanical properties. They also indicated that the rupture of an AAA was most likely
to occur on the inner surface of the wall at the anterior region in circumferential
orientation. Vorp et al. (1998) stated that, in addition to diameter, the influence of
asymmetry on mechanical wall stress in AAAs is very important. Li et al. (2005)
employed the coupled CFX and ANSYS solver to analyze the stress distribution in an
axisymmetric AAA model and found that stress analysis may yield necessary insight in
AAA-rupture prediction. At present, such stress analyses include CT scanning and
image processing, model development and computer fluid-structure-interaction (FSI).
accumulation of fibrin, blood cells, platelets, blood proteins and cellular debris adhering
to the AAA inner wall. Clinically, 75% of AAAs include thrombi (Wang et al.,2002). At
present, the effect of ILT on AAA rupture is still controversial. Some investigators think
ILT may reduce the stress in the AAA wall. For example, Wang et al.(2002) reported
that the peak wall stress may be reduced from 6~38% if the ILT-AAA volume ratio
ranges from 0.29-0.72. Thubrikar et al. (2003) regarded ILT as a fibrous network
adhering to the aneurysm wall. They reported that even though the ILT allows the
transmission of luminal pressure to the AAA wall, it may prevent the AAA from rupture
by diminishing the AAA dilation by 4-15%. Vorp et al. (1996) reported that an ILT
could improve the compliance of the wall like a cushion, reduce mechanical stress, and
hence was benefital for preventing AAA rupture. Mower et al. (1997) simulated the ILT
in an AAA and found that an ILT significantly reduced AAA wall-stress if the ILT
became solid. Di Martino et al. (1998) declared that a well organized thrombus may
reduce the effect of the pressure load on the AAA wall. Li et al. (2005) found that the
maximum Von Mises stress relates inversely proportional to the ILT-AAA volume ratio
and exponentially with respect to its Young’s modulus. These correlations agree with
findings by Mantero et al. (1998&2001). In contrast, some researchers declared that
ILTs could accelerate AAA rupture. For example, Wolf et al. (1994) found that an
increased AAA-ILT volume is associated with a higher likelihood of rapid expansion.
They stated that the larger the ILT volume in the AAA cavity, the higher is the
possibility of rupture. Cappeller et al. (1997) indicated that if the ILT/AAA volume ratio
is more than 0.45, the rupture rate becomes very significant. They took the ILT/AAA
volume ratio of 0.62 as one possible indicator for AAA rupture. Stenbaek et al. (2000)
greater than 1.5cm2/year were prone to rupture. They suggested that the growth of ILT may be a better predictor of rupture than AAA diameter. Interestingly, some researchers
stated that there are no close relationship between ILT presence and AAA rupture. To
prove the point, Schurink et al. (2000) tested the blood pressure close to the inner wall
of an AAA and found that the pressure is almost the same as that in the lumen. Another
debate is that the an ILT volume in AAA sac is associated with AAA size. According to
Pillari et al. (2000), for AAAs with dAAA,,max >7cm no change in ILT volume was found
with the increasing sac diameter; however for an 5<dAAA,,max<7cm, the increase in sac
diameter was associated with an increase in ILT volume. The impact of the maximum
ILT volume before AAA rupture remains controversial. Our simulation results support
that ILT may reduce the stress in the wall, if the decrease of wall yield stress caused
by ILT is not considered (Li et al., 2005). However, Vorp et al. (2001) stated that an ILT
can decrease the ultimate AAA strength dramatically. They found that the strength of an
AAA with 4 mm ILT decreases 20% compared to an AAA with ILT less than 1 mm.
Hypoxia , i.e., oxygen deficiency caused by an ILT, is the main reason for wall strength
reduction.Therefore, if the degeneration of the wall strength is taken into account, the
net effect of ILT on AAA wall rupture may vary.
Diastolic Pressure. Hypertension is considered to be a key factor contributing to AAA rupture. It is well-known that the maximum blood pressure, i.e., systolic pressure, is the
main force to cause AAA-wall deformation. It is no doubt that AAAs in patients with
systolic hypertension are prone to rupture. The relationship between the maximum wall
stress and systolic pressure is approximately exponential. Once the systolic blood
pressure is greater than 160 mmHg, the rupture risk becomes high (Li et al., 2005).
pressure between non-ruptured and ruptured AAAs. Thus, although the systolic pressure
is the main force to cause AAA-wall stress, it alone can not be regarded as a predictor
for AAA rupture. In contrast, the diastolic pressure is found to be closely associated
with AAA rupture. For example, Hatakeyama et al. (2001) reported 72% of ruptured
AAAs in patients with diastolic hypertension. Cronenwett et al. (1985) also asserted that
diastolic hypertension must be evaluated to assess the accuracy in predicting small AAA
rupture. They defined the diastolic pressure value of 75 mmHg, 90 mmHg and 105
mmHg as the low, middle and high risk levels for AAA rupture. Powell et al. (2001)
proposed that the ankle/branchial pressure index (ABPI) is an important prognostic
indicator for AAA rupture, and patients with an ABPI below 0.87 have the highest
mortality risk. Schewe et al. (1994) declared that the AAA expansion rate is
significantly correlated with the diastolic pressure and a high diastolic pressure is an
important risk factor for AAA both expansion and rupture. Wilson et al. (1998-2003)
studied the effect of diastolic pressure on AAA rupture and found that a high diastolic
pressure may reduce the time to rupture considerably. Up to now, the correlation
between diastolic hypertension and AAA rupture is accepted by most researchers.
Change of Wall Stiffness. Clinical observations show that that most AAA walls become progressively stiffer as the diameter increases. This is because of biomechanical
restructuring of the wall. For example, He et al. (1994) investigated the composition and
mechanical properties of AAAs, and they found that AAA walls were stiffer and volume
fractions of collagen and ground substance levels were highest, whereas the volume
fraction of elastin and muscle tissue were relatively low. MacSweeney et al. (1992) also
indicated that the increasing aneurysmal aorta stiffness was associated with the loss of
et al. (1992). Enhanced wall stiffness is not necessarily advantageous for preventing
AAA rupture, because along with the increase of wall stiffness, the wall yield stress will
accordingly decrease. As a case in point, Raghavan et al.(2000) stated that Young’s
modulus in an AAA wall may reach 4.66 MPa, which is about three times that in normal
arterial walls; whereas its yield stress is only 50% of the normal artery. Also, Groenink
et al. (1999) reported that even though stiffness may become large with age, the yield
stress of the wall will decrease significantly with respect to age. Thus, although Young’s
modulus may reduce AAA-wall stress, the yield stress is possibly lower than the
mechanical stress in the AAA wall, i.e., AAA rupture still may occur when the wall
becomes stiffer (see Fig.1.13).
In case of wall stiffness decreases with time because of a failure in wall
restructuring, the risk of rupture increases significantly. For example, Wilson et al.
(2003) found that a 10% decrease in stiffness over time was associated with a 28%
increase in rupture risk when compared to AAAs without wall stiffness changes. They
also indicated that from the time of AAA observation to elective repair, the wall
stiffness appears to increase, while the wall stiffness in ruptured AAAs is less than that
in elective repaired AAAs. It implies that there is a maximum stiffness before rupture.
They declared that the reason of fast expansion before rupture is due to the failure of
restructuring; but the actual factors that determine at what point AAA restructuring fails
are unknown.Thus, the change of wall stiffness may be a strong player in AAA rupture.
Interestingly, Sonesson et al. (1999) reported that no difference was found in
aneurysmal aortic wall mechanics in ruptured AAAs compared with electively operated
AAAs. They declared that it is not possible to use aneurysmal aortic wall stiffness as a
Asymmetry Index. As a result of the local support provided by lumbar vertebrates, most AAAs are asymmetric. Generally, the anterior size is greater than the posterior size
with a larger wall thickness at the posterior side than at the anterior side. According to
Vorp et al. (1998), the shape factor has a substantial influence on the distribution of wall
stress within the aneurysm, where the magnitude of the peak stress in the wall increased
non-linearly with increasing asymmetry. Specifically, when the asymmetry index
1 max
. −
=
a AAA
l d
β (see Fig. 4.1) changed from 1 to 0.3, the circumferential stress
increased to 85% in their numerical AAA model. Hua et al. (2001) stated that a simple
symmetric model is unreliable in predicting the location and magnitude of peak stresses
in most AAAs. Thus, assessing the risk of rupture for typical AAAs may require
detailed three-dimensional modeling. Finol et al. (2003) studied the effect of asymmetry
in AAAs under physiologically realistic flow conditions. They graphed the peak wall
shear stress and peak wall pressure as a function of aneurismal asymmetry. The effect of
asymmetry increases the maximum wall shear stress at peak flow and induces the
appearance of secondary flows during the late diastole. Furthermore, mechanical stress
concentrations may be triggered by asymmetric and complicated AAA geometries.
(Fillinger et al., 2002&2003) Thus, since most AAAs are asymmetric, a shape index
should be taken into account in evaluating AAA rupture.
Saccular Index. The saccular index,
AAA AAA
L d ,max
=
γ (see Fig. 4.1), i.e., the ratio of
maximum AAA diameter to the length of AAA region, is another novel system
parameter to express AAA characteristics. Clinical observations indicate that the smaller
the saccular index the higher is the possibility of AAA rupture. For example, Ouriel et al.
where the clinical thresholds of saccular indices for elective repair and rupture are 0.6
and 0.7, respectively. Based on clinical data, Hatakeyama et al. (2001) studied the
influence of saccular index on AAA rupture. Their results demonstrated that the saccular
index correlated significantly to AAA rupture. They also fitted an equation to express
rupture in terms of saccular index, diameter ratio and diastolic pressure. Li et al. (2005)
graphed AAA-wall stress vs. saccular index and illustrated that there are two “turning
points” at γ =0.65 and γ =0.72. The Von Mises stress increases slowly when the
saccular index changes from 0.72 to 0.65. However, once the saccular index is less than
0.65, the Von Mises stress increases quickly. It suggests that the saccular index may be
one possible predictor for AAA rupture.
Wall Curvature. Theoretically, wall stress concentration occurs at the location of highest wall curvature. The AAA-wall stress distribution is not only related to the
maximum diameter, wall thickness and mechanical properties, but also to AAA-wall
curvature. For example, Elger et al. (1996) studied the effect of wall curvature on the
wall stress in terms of exponential, parabola-exponential and consine-exponential
curvature models. They found that the maximum stress typically occurred near the
inflection point of a curve drawn coincidental with the AAA wall. They declared that
the Laplace Equation in terms of maximum diameter provided neither a qualitative nor a
quantitative understanding of the AAA-wall stress and concluded tat the wall curvature
is more important than the maximum diameter in evaluating AAA rupture. Filliger et al.
(2003) simulated the mechanical stress distributions in clinical AAA models obtained
from CT scans. They found that that the local stress may be high even when the
diameter is relatively small because of the irregular AAA shape. They also indicated that
wall curvature is high. Our research also demonstrated that the maximum Von Mises
stress is usually located near the inflection point of the AAA-wall (see Li et al. 2005).
In summary, AAA walls with very strong curvatures feature serious stress
concentrations implying a high likelihood of rupture.
Gender. Clinically, the rupture risk is four times in female than in male with the same AAA size, even though the AAA morbidity ratio of male to female is 4:1, especially in
people over the age of 60. It well-known that women have smaller aortas than men
(1.9-2.3cm vs. 2.3-2.6cm; Ouriel et al., 1992); but the same threshold diameter of 5.5cm is
currently used for elective AAA repair, which leads to underestimating the risk of AAA
rupture in women. For example, Brown et al. (2003) stated that the risk of rupture in
male patients with dAAA,max =5.0-5.9 cm is low, but the four-time higher risk of AAA
rupture in female patients with dAAA,max =5.0-5.9 cm suggests that a lower threshold
value should be considered for women. To the contrary, Vardulaki et al. (1998) reported
that the rate of AAA growth did not differ with age and sex. Similarly, Cheng et al.
(2003) compared the abdominal aortic hemodynamics between men and women and
found that no significant differences of wall shear stress, temporal flow and other
hemodynamic parameters were found between the genders. It suggests that
hemodynamics may not play a significant role in AAA disease and rupture between
genders. Sonesson et al. (1999) also reported that the stiffness of AAA wall is only
related to age, no relationship with gender. In summary, the reason for gender difference
in AAA rupture is still under investigation, and the problem to define the best diameter
threshold for women remains unresolved.
in terms of serum elastin peptides, procollagen-IIIN-terminal propeptide, and initial
AAA size. If useful, only a simple blood test may predict the AAA growth status and the
risk of rupture. But they also stated that a larger sample size was still needed for clinical
recommendations. Another method to predict AAA rupture presented by Ouriel et al.
(1992) is the standardization of the aneurysm diameter to the transverse diameter of the
third lumbar vertebral body. They declared that it may produce an accurate predictor of
rupture when a threshold ratio of 1.0 was used.
1.4 AAA Repair
1.4.1 Open Surgery
Up to now, there are no drug treatments
for abdominal aneurysms. The available
treatment requires surgical repair. The first
abdominal aneurysm was successfully
repaired in 1951 (Charles Dubost, Paris).
Conventional repair of abdominal aortic
aneurysms involves replacement of the
diseased aorta segment with a synthetic
prosthetic graft made of polyester or PTFE
(see Fig.1.17). An abdominal incision is
required to completely expose the abdominal
aorta. The procedure usually requires general anesthesia and takes 4-6 hours to
complete. The overall in-hospital mortality is less than 2-3%. Open AAA surgery has Fig.1.17 Open surgery
(Source: http://www.mayoclinic.org)
Kidney
Iliacs
been performed for the past 40 years without significant modifications. The procedure is
extremely durable and secondary surgical procedures are rarely necessary. Aside from
routine post-operative checkups, there is no long-term follow up required. Open surgery
is suitable for all kinds of AAAs. However, open repair requires a long abdominal
incision to gain access to the aorta. A large amount of blood transfusion is required. The
patient may endure great pain. Hospitalization and recovery time are substantially long.
The complications of open operation mainly include myocardial infarction, arrhythmia,
congestive heart failure, lung failure, renal failure and reduction in blood flow to legs
and other vital organs in and downward from the abdomen.
1.4.2 Endovascular Aneurysm Repair (EVAR)
Minimally Invasive Endovascular Repair. As we know, AAA is only the dilation of an artery, not a tumor. The task is to prevent it from rupturing, not get rid of it. EVAR
technology has been developed for this purpose. In EVAR, a stent-graft is installed to
exclude the AAA from blood flow, eliminate blood circulation in the AAA sac, reduce
blood pressure, and prevent AAA rupture. Dotter (1969) was the first to suggest a
stent-graft for endovascular repair. Because of the limited technology, this idea could not
come into practice at that time. Balko (1980) began to test stent-graft in animals and
obtained promising results. In 1990, Parodi successfully used an endovascular
stent-graft to repair an AAA in a patient for the first time. In 1991, he published his clinical
experience about this new technology. In 1993, Chuter designed the first bifurcated
stent-graft for AAAs. With the development of new technologies, such as new materials,
non-invasive screens and improved designs, EVAR has become one of the hottest
research fields in the world. At present, over 25,000 patients world wide with AAAs