ABSTRACT
MANDAL, SONALI. Colorant Database for Cationized Cotton. (Under the direction of Dr. Peter J. Hauser.)
The use of cationized cotton is currently one of the sustainable methods of
dyeing cotton with anionic dyes like fiber-reactive and direct dyes. It enables the dyeing
of cotton without the use of salt and with higher dye exhaustion. During the dyeing
phase of wet processing, the effluent load is reduced considerably with good fastness
properties. However, even with all these benefits the use of cationized cotton lacks
acceptance in the industry. The most commonly used cationization agent is
3-chloro-2-hydroxypropyltrimethylammonium chloride (CHPTAC). Several studies reported
appearance of change in hue in samples dyed with cationized cotton. This problem
potentially restricts the use of current primary databases in predicting dye recipes
when using cationized cotton. Hence it is necessary to develop new primaries for
cationized cotton.
In this study, a colorant database was developed for 23 reactive dyes of various
classes and manufacturing companies. These dyes were selected on the basis of their
current use in industry as primary colorants for developing shades. Two treatment
levels of CHPTAC were applied on cotton and samples were dyed at various % shades. It
was observed that cationized cotton primaries gave better match to the standard than
© Copyright 2013 by Sonali Mandal
Colorant Database for Cationized Cotton
by Sonali Mandal
A thesis submitted to the Graduate Faculty of North Carolina State University
in partial fulfillment of the requirement for the degree of
Master of Science
Textile Chemistry
Raleigh, North Carolina
2013
APPROVED BY:
Dr. David Hinks Dr. George Hodge
DEDICATION
BIOGRAPHY
Sonali Mandal, daughter of Uttam Kumar Mandal and Sulekha Mandal, was born on
September 28, 1989 in Mumbai, India. She has a younger brother Abhishek Mandal. She
graduated from Fr. Agnels Multipurpose School & Junior College in 2007. She obtained
her Bachelor of Technology degree in Fiber and Textile Processing Technology from the
Institute of Chemical Technology (previously known as University Department of
Chemical Technology), Mumbai in 2011. She will receive her Master of Science degree
in Textile Chemistry in 2013 and will remain at North Carolina State University to
ACKNOWLEDGMENTS
I want to thank Dr. Peter J. Hauser for his patience, time and guidance during the
research and writing this thesis. Also, I want to thank Dr. David Hinks and Dr. George
Hodge for their general advice and guidance. A special thanks to Mr. Jeffery Krauss, the
dyeing and finishing pilot lab manager for always being available and for helping me
perform the experiments in the lab. This research would not have been possible
without the financial support of Cotton Incorporated. I want to thank all the staff at
Cotton Incorporated, especially Mary Ankeny. I want to also thank my family especially
my parents for encouraging me to pursue my graduate studies in the USA and providing
TABLE OF CONTENTS
LIST OF TABLES ... vii
LIST OF FIGURES ... x
1. Introduction ... 1
2. Literature Review ... 3
2.1 Cotton Fibers ... 3
2.2 Coloration of Cotton ... 4
2.2.1 Vat Dyes ... 4
2.2.2 Sulfur Dyes ... 5
2.2.3 Pigments ... 5
2.2.4 Natural Dyes ... 6
2.2.6 Direct Dyes ... 6
2.2.7 Reactive Dyes ... 7
2.3 Chemistry of Reactive Dyes ... 7
2.4 Environment issues related to Reactive dyes ... 13
2.5 Cationization of Cotton with CHPTAC ... 15
2.6 Colorant primaries and color matching ... 20
2.7 Need for new primaries ... 27
3.1 Materials ... 28
3.2 Equipment ... 31
3.3 Pretreatment Procedure ... 31
3.4 Cationization Procedure ... 32
3.5 Dyeing Procedures ... 32
3.6 Evaluation Procedures ... 41
3.7 Colorant Database Evaluation ... 42
4. Results and Discussion ... 43
4.1 Dyed Cationized cotton samples ... 43
4.2 Comparison of K/S values ... 44
4.3 Comparison of L*, a* and b* values ... 68
4.4 Repeatability in dyeing cationized cotton ... 80
4.5 Comparison of dye bath exhaustion ... 83
4.6 Comparison of fastness test ratings ... 85
4.7 Color matching using conventional and cationized primaries ... 94
5. Conclusions ... 106
6. Recommendations for Future Work ... 108
LIST OF TABLES
Table 1: List of Chemical and Auxiliaries ... 29
Table 2: List of Dyes ... 30
Table 3: Concentration of Glauber’s salt and Soda Ash used in Dyeing Samples ... 33
Table 4: Conventional Dyeing Procedure for Novacron Dyes. ... 35
Table 5: Conventional Dyeing Procedure for Remazol Dyes. ... 36
Table 6: Conventional Dyeing Procedure for Drimaren K Dyes. ... 37
Table 7: Conventional Dyeing Procedure for Drimaren CL Dyes. ... 38
Table 8: Conventional Dyeing Procedure for Drimaren X Dyes. ... 39
Table 9: Dyeing Procedure for Cationized Cotton samples. ... 40
Table 10: K/Ssum values for Reactive Yellow 143 ... 45
Table 11: K/Ssum values for Reactive Yellow 206 ... 46
Table 12: K/Ssum values for Reactive Yellow 168 ... 47
Table 13: K/Ssum values for Reactive Red 238 ... 48
Table 14: K/Ssum values for Reactive Red 266 ... 49
Table 15: K/Ssum values for Reactive Blue 235 ... 50
Table 16: K/Ssum values for Reactive Blue 268 ... 51
Table 17: K/Ssum values for Novacron Super Black R ... 52
Table 18: K/Ssum values for Novacron Super Black G ... 53
Table 19: K/Ssum values for Remazol Golden Yellow RGB ... 54
Table 21: K/Ssum values for Reactive Blue 250 ... 56
Table 22: K/Ssum values for Reactive Blue 21 ... 57
Table 23: K/Ssum values for Reactive Yellow 125 ... 58
Table 24: K/Ssum values for Reactive Red 147 ... 59
Table 25: K/Ssum values for Reactive Blue 209 ... 60
Table 26: K/Ssum values for Reactive Yellow 176 ... 61
Table 27: K/Ssum values for Reactive Red 197 ... 62
Table 28: K/Ssum values for Reactive Black 5 ... 63
Table 29: K/Ssum values for Reactive Orange 70 ... 64
Table 30: K/Ssum values for Reactive Red 243 ... 65
Table 31: K/Ssum values for Reactive Blue 52 ... 66
Table 32: K/Ssum values for Reactive Blue 214 ... 67
Table 33: L*, a*, b* values of CD, C25 and C50 samples ... 69
Table 34: Repeatability in Dyeing Cationized Cotton on 50 g/L CHPTAC fabric ... 81
Table 35: Wash Fastness Test Results ... 85
Table 36: Crock Fastness Test Results ... 89
Table 37: Recipes for dyeing the standards (targets)... 95
Table 38: Auxiliaries for Dyeing the Standards ... 96
Table 39: Dyeing Procedure for the Standards. ... 96
Table 40: Recipes for Dyeing Green Thumb Shades ... 98
Table 42: Recipes for Dyeing Solar Wind Shades ... 100
Table 43: Recipes of Dyeing Heavy-Hearted Shades ... 101
Table 44: Recipes for Dyeing Green Thumb Shades with Remazol Dyes ... 103
Table 45: Recipes for Dyeing Stained Wood Shades with Remazol Dyes ... 104
LIST OF FIGURES
Figure 1: Chemical Structure of Cotton ... 3
Figure 2: Reactive Dye features ... 8
Figure 3: Fiber-reactive groups in commercial reactive dyes. [7] ... 10
Figure 4: Reactions of DCT reactive dyes ... 12
Figure 5: Reactions of VS reactive dyes ... 13
Figure 6: Dyeing of Cationized Cotton ... 16
Figure 7: Synthesis of CHPTAC ... 17
Figure 8: Reactions of CHPTAC ... 18
Figure 9: CIELAB Color Space ... 22
Figure 10: Plot of K/S vs dye concentration for a sample [35] ... 26
Figure 11: Plot of K/Ssum vs. % Shade for Reactive Yellow 143 ... 45
Figure 12: Plot of K/Ssum vs. % Shade for Reactive Yellow 206 ... 46
Figure 13: Plot of K/Ssum vs. % Shade for Reactive Yellow 168 ... 47
Figure 14: Plot of K/Ssum vs. % Shade for Reactive Red 238 ... 48
Figure 15: Plot of K/Ssum vs. % Shade for Reactive Red 266 ... 49
Figure 16: Plot of K/Ssum vs. % Shade for Reactive Blue 235 ... 50
Figure 17: Plot of K/Ssum vs. % Shade for Reactive Blue 268 ... 51
Figure 18: Plot of K/Ssum vs. % Shade for Novacron Super Black R ... 52
Figure 19: Plot of K/Ssum vs. % Shade for Novacron Super Black G ... 53
Figure 21: Plot of K/Ssum vs. % Shade for Remazol Red RGB ... 55
Figure 22: Plot of K/Ssum vs. % Shade for Reactive Blue 250 ... 56
Figure 23: Plot of K/Ssum vs. % Shade for Reactive Blue 21 ... 57
Figure 24: Plot of K/Ssum vs. % Shade for Reactive Yellow 125 ... 58
Figure 25: Plot of K/Ssum vs. % Shade for Reactive Red 147 ... 59
Figure 26: Plot of K/Ssum vs. % Shade for Reactive Blue 209 ... 60
Figure 27: Plot of K/Ssum vs. % Shade for Reactive Yellow 176 ... 61
Figure 28: Plot of K/Ssum vs. % Shade for Reactive Red 197 ... 62
Figure 29: Plot of K/Ssum vs. % Shade for Reactive Black 5 ... 63
Figure 30: Plot of K/Ssum vs. % Shade for Reactive Orange 70 ... 64
Figure 31: Plot of K/Ssum vs. % Shade for Reactive Red 243 ... 65
Figure 32: Plot of K/Ssum vs. % Shade for Reactive Blue 52 ... 66
Figure 33: Plot of K/Ssum vs. % Shade for Reactive Blue 214 ... 67
Figure 34: Dye exhaustion for Reactive Yellow 176 ... 83
Figure 35: Dye Exhaustion for Reactive Red 197 ... 84
1. Introduction
Clothing is regarded as one of the basic necessities for human beings and the
textile industry holds a significant share in global trade in manufactured goods. A
research by the Secretariat of the Seoul International Color Expo reveals that 84.7%
respondents think color as an important factor while choosing products [1]. The
coloration of textile goods thus acts as an important process in the textile industry.
Cotton is the most important natural fiber in the world due to its incomparable
properties. The textile dyeing and finishing sector is known to consume large
amounts of water and chemicals. Many efforts are being made to develop
ecofriendly dyeing processes with lesser consumption of dyes and auxiliaries. The
process of treating the effluent from the textile industry is an important step so as
the make the effluent safe for discharging into water streams. However, these
treatments are expensive and are not always viable since a typical textile effluent
contains various types of dyes, metals, surfactants and other auxiliaries. Also,
treating the effluent does not reduce the usage of the dyes and chemicals.
Cotton is mainly dyed with reactive dyes which require large amounts of salt to
increase the dye affinity. However, the salt does not get exhausted and remains in
the bath along with unexhausted and hydrolyzed dye. Also, in order to get rid of the
hydrolyzed dye from the fiber, post dyeing scouring and multiple rinsing stages are
solution to these problems is the use of cationized cotton. Cotton is treated with a
cationic agent to attract the anionic dye molecules. The use of cationized cotton
eliminates the need of salt, scouring and multiple rinsing processes. Also, with an
appropriate level of treatment lesser amount of dye is needed to obtain shades
comparable to conventionally dyed cotton samples.
In this present work, cotton fabric was cationized using
3-chloro-2-hydroxyproplytrimethylammonium chloride and was then dyed with fiber reactive
dyes. The dye exhaustion and the final shade obtained on cationized cotton are
different compared to conventional cotton dyeing which the existing primaries
cannot be used for color matching on cationized cotton [2, 3]. Specifically, the work
2. Literature Review
2.1 Cotton Fibers
Cotton is the most abundant fiber available in nature consisting of 88-96%
cellulose [4]. Cotton possesses unique properties such as softness, comfort and
breathability which make it the most popular among natural fibers [5]. The factors
that affect the properties of cotton are color, impurities, molecular weight, fiber
length, uniformity of length etc. The leading producers of cotton in the world are
China, USA, India, Pakistan and Brazil [6].
Figure 1: Chemical Structure of Cotton
Cellulose, a polymer of glucose formed by condensation polymerization of
β-D-glucopyranose joined by 1, 4-glucosidic bonds, is the basic building block for cotton
reactive and participates in the cellulosic reactions. Currently, cotton constitutes
about 50% of the annual textile fiber production [8].
2.2 Coloration of Cotton
2.2.1 Vat Dyes
Vat dyes are one of the oldest types of dyes used for dyeing of cotton. Indigo is
the most popular vat dye used for dyeing blue denim [9]. Vat dyes are water
insoluble and hence needs to be reduced chemically to their leuco water-soluble
forms for application on cotton. The process of reduction of vat dyes is known as
vatting in which the dye reacts with a reducing agent and a base. The most
commonly used reducing agent is sodium hydrosulphite which is stable in the
presence of an alkali. After the leuco form of the vat dye has been applied on the
fiber it needs to reoxidized to its original form using atmospheric oxygen or mild
oxidizing agents like sodium per borate or hydrogen peroxide. This class of dye
possesses excellent fastness properties however they are costly and have less range
2.2.2 Sulfur Dyes
Sulfur dyes are similar to vat dyes which are used for dyeing cotton [6]. They
contain sulfur linkages in their structure however the exact molecular chemistry is
still unknown [7, 11]. Currently, one of the most important sulfur dyes is C.I.
Sulphur Black 1[9]. Similar to vat dyes, sulfur dyes are also water insoluble and
need to be converted into their leuco forms in presence of a reducing agent and an
alkali. The combination of sodium sulphide as reducing agent along with sodium
hydroxide is traditionally used for solubilizing these dyes [7]. After the dye is
applied on the cotton substrate it needs to be reoxidized either by atmospheric
oxygen or with mild oxidizing agents like hydrogen peroxide [12]. Sodium sulphide
remains in the effluent which can undergo acidification to produce hydrogen
sulphide, a harmful chemical [7]. Hence this effluent needs to be treated before
releasing into water streams.
2.2.3 Pigments
Pigments possess color rending properties and are insoluble in the medium of
application. Since they cannot penetrate inside the fiber, they need to be fixed on the
surface of the fiber by using a polymeric adhesive binding agent [12]. The fastness of
the substrates colored with pigments depends on the mechanical properties of the
binder [13]. The application of pigment on cotton is laborious and also stains the
system influences the properties of the cotton substrate by imparting stiffness and
possesses moderate to poor fastness ratings [13].
2.2.4 Natural Dyes
Natural dyes are those colorants that have natural source of origin like plants,
invertebrates, minerals etc. [14]. Indigo is possibly the oldest and the most
important among all the naturally occurring dyes [15]. The process of extraction of
the natural dyes from their raw materials is a tedious work. Natural dyes are
expensive due to low color yields and limited source of raw materials. Most natural
dyes do not have affinity for cotton and hence are bonded using a mordant which
acts are a chemical bridge between the dye and fiber thus improving their fastness
properties [14]. They possess poor light fastness on cotton due to its hygroscopic
nature [16]. The dye undergoes photochemical oxidation in presence of moisture
leading to poor light fastness [17]. Hence, the fastness of the dye depends on the
binding strength of the mordant.
2.2.6 Direct Dyes
Direct or substantive dyes have very high affinity for cellulosic fibers due to their
narrow and flat molecular structure [12]. The straight structure of these dyes often
contains one or more azo groups that are held to cellulose by secondary bonds like
exhaustion rates can be achieved by adding salt or increasing the dyeing
temperature [11]. However, they do not possess good wash and light fastness
properties. The wash fastness can be improved by treating with a dye fixing agent
that increases the molecular weight of the dye already absorbed in the fiber.
2.2.7 Reactive Dyes
Reactive dyes are the class of dyes which are capable of forming strong and
stable covalent bonds with cellulose [12]. Reactive dyes are widely chosen for
dyeing cotton because of their wide range of brilliant shades, multiple methods of
application and good fastness properties. However, some reactive dyes have poor
light and chlorine fastness. The method of dyeing regular cotton with reactive dyes
follows three steps: exhaustion, fixation and washing-off. Glauber’s salt, sodium
sulfate, is used for the exhaustion of reactive dyes and the washing-off step
consumes large quantities of water. Due to these reasons the application of reactive
dyes exhibits significant environmentally impact.
2.3 Chemistry of Reactive Dyes
Rattee and Stephen in ICI England first developed the fiber reactive dyes in 1955
and the dyes were commercialized in 1956 [7]. The reactive dyes have structure
similar to acid or direct dyes and additionally have a reactive group which reacts
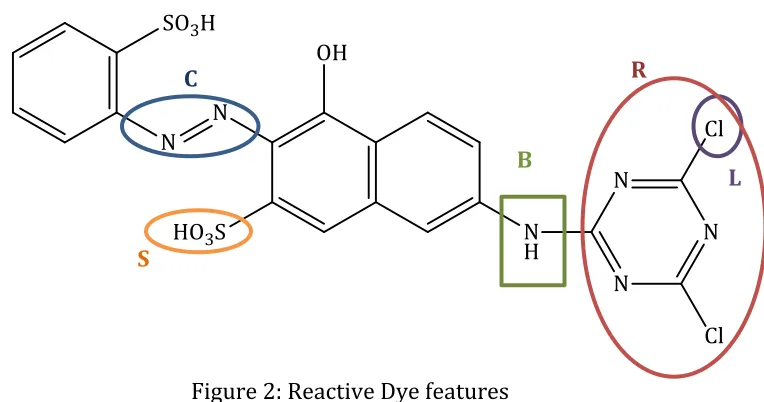
Figure 2: Reactive Dye features
(C = Chromophore, S = Solubilizing group, B = Bridging group, R = Reactive group,
L = Leaving group) [18]
A typical reactive dye will contain a chromophore, solubilizing groups, a bridging
group, a reactive group and leaving groups as shown in Figure 2. Each of these
features influences the dyeing and the fastness properties of the dye. The
chromophore is the color imparting group of the dye. The solubilizing groups make
the dye molecule water soluble. The bridging group connects the chromophore to
the reactive group of the dye. The reactive group contains leaving groups which are
replaced during the dyeing process. The most common reactive groups can be
classified into halogenic cyclic azine derivatives and sulfatoethylsufone type
C
S
B
reactive dyes. The different types of reactive dyes commercially available are shown
Dichlorotriazine (DCT) Monochlorotriazine (MCT)
Monofluorotriazine (MFT) Trichloropryimidine (TCP)
Difluorochloropyrimidine (DFCP) Dichloroquinoxaline (DCQ)
Nicotinyltriazine (NT) Vinylsulphone (VS)
The dye fixation occurs in presence of alkali in which the reactive group of the
dye reacts with hydroxyl groups of the cellulose. However, the dye may undergo
hydrolysis with hydroxide in water. This hydrolyzed dye is incapable of forming
bonds with the cellulose and reduces the wet fastness properties if these hydrolyzed
dyes are not removed fully during the washing. Multiple soaping and rinsing steps
are required after the dyeing process in order to remove these hydrolyzed dyes. The
reactions of dichlorotriazine and vinylsulphone types of reactive dyes are shown in
Figure 4: Reactions of DCT reactive dyes
Figure 5: Reactions of VS reactive dyes
2.4 Environment issues related to Reactive dyes
The process of dyeing cotton with most reactive dyes requires large amounts of
salt (electrolyte) for exhaustion as well as alkali for fixation. In order to remove the
hydrolyzed dye formed during the fixation, scouring and multiple rinsing steps are
required. Hence, the large volume of effluent produced typically contains high
concentrations of salt and alkali which pollute the environment if not treated.
The hydroxyl groups present in the cotton ionize in contact with water thus
producing negative charges [19]. Reactive dyes are anionic in nature and thus get
repelled by the negative charges on the cotton fiber. Thus salt is added in the bath in -OH
order to reduce these negative charges and increasing the affinity of the dye for the
fiber. For high exhaustion of the dye, large quantities of salt are required (40-100
g/L) [20]. However, these salts remain unexhausted and are added to the effluent.
The process of removal of salt from the effluent adds to the cost of production.
Even after using high concentrations of salt, complete exhaustion of the dyestuff
cannot be achieved, only 60-65% gets utilized in normal dyeing systems [21]. These
unexhausted dyes remain in the bath along with the hydrolyzed dye. Processes like
chemical oxidation destroy the chromophore of the dye but may ultimately produce
even more toxic compounds than the original dye [22]. A process that can consume
less amount of dye and has high dye exhaustion can be a solution to this problem.
In order to achieve good fastness properties, it is important to remove the
hydrolyzed dye from the dyed cotton substrate. Studies show that, rinsing steps
consume approximately 80% of water, 90% of energy and 70% of time required in
the complete dyeing process [23]. Water is consumed for rinsing after the dyeing
cycle, scouring process and final rinsing step to remove the hydrolyzed dye. Also,
these stages make the entire dyeing process time consuming, thereby reducing the
Irrespective of these drawbacks, reactive dyes are preferred over other dyes for
dyeing cotton due to overall fastness and wide range of hues. Many technologies
have been suggested to overcome the environmental problems associated with
reactive dyes. However, many of these lack practicality.
2.5 Cationization of Cotton with CHPTAC
The use of cationized cotton is a sustainable method of dyeing cotton. It is
possible to achieve 100% dye exhaustion with less dye, energy and time than
conventional dyeing application methods through the use of cationized cotton [24].
It is possible to dye cotton with the use of salt and obtain high dye exhaustion and
comparable or better color fastness [19]. Cationized cotton can be obtained by
reacting cotton with a cationizing agent. This treatment imparts positive charges on
the cotton fiber which eliminate the anionic dye repulsive forces as illustrated in
Figure 6: Dyeing of Cationized Cotton
3-chloro-2-hydroxyproplytrimethylammonium chloride (CHPTAC) is a
cationizing agent that can be used to produce cationized cotton.
CHPTAC is formed by the reaction of epichlorohydrin and trimethylamine
hydrochloride as shown in Figure 7.
Cotton Fiber
Cationizing Agent
Dye-SO3
Figure 7: Synthesis of CHPTAC
CHPTAC in alkaline conditions forms EPTAC which further reacts with cellulose
to form ether linkages as shown in Figure 8. However, EPTAC can also undergo
CHPTAC EPTAC
EPTAC Cationized Cotton
EPTAC Diol
Figure 8: Reactions of CHPTAC
CHPTAC can be applied to cotton by various methods like cold pad-batch, pad
steam, pad bake and exhaust; however, the cold pad-batch is the most efficient
method for the cationization treatment [3, 18]. The fixation efficiency is observed to
decrease with increasing liquor ratio and temperature because EPTAC hydrolysis
temperature. A higher fixation of the cationizing agent on cotton can be obtained by
using additives like sodium lauryl sulfate, triethanol amine, ethylene diamine
tetraacetic acid etc in the exhaust method as they tend to complex with CHPTAC
thus reducing the hydrolysis reaction [25].
It has been also observed that the fixation of the cationizing reagent on
mercerized cotton is nearly double that of unmercerized cotton [3]. By use of
cationized cotton it is possible to obtain higher color yields with direct, acid and
reactive dyes [26]. The dye molecular structure has an important role when applied
on cationized cotton as it is seen that the color yield differs for different dye
chemistry [27]. The use of cationized cotton is not limited to cotton dyeing.
Cationized cotton can also be printed using acid, direct and reactive dyes. The
printed cationized cotton samples have higher color yield, similar or better fastness
properties and shorter processing cycles compared to untreated cotton [28-32].
Since direct, acid and reactive fiber dyes have high affinity for cationized cotton it
can be used for removal of the dyes from the textile effluents just by cationizing
waste cotton fibers. It is almost possible to remove the dyes completely from the
effluent and meet the EPA standard with lower cost compared to other waste water
treatment techniques [33].
One of the drawbacks of cationic cotton treatment with CHPTAC is the reduction
of whiteness index of the treated fabric compared to the untreated bleached fabric
irritant with is a product of the reaction of CHPTAC with sodium hydroxide [7].
Hence, it is recommended to mix the two chemicals directly in the pad trough just
before the padding process in order to minimize the risk of occupational exposure.
2.6 Colorant primaries and color matching
The relationship between supplier and customer is very important in the current
textile market. However, many times there are differences in the judgment of color
matching if it is solely based on a human observer [34]. Hence, it is important to
measure color differences on color measuring instruments. A spectrophotometer
measures the reflectance of a sample across the visible spectrum. Reflectance is the
ratio of reflected light and incident light. A spectral analyzer measures the reflected
light and splits into its spectral components [35]. In dyeing textile goods, dyes are
mixed in different proportions to obtain a color and this is called subtractive mixing.
In subtractive mixing, red, yellow and blue are the primaries when used in different
proportions to obtain a color. The tristimulus values (X, Y, and Z) are the three
primaries required to produce a color [36]. The chromaticity coordinates (x, y, and
z) are given by:
Equation 2.1
Equation 2.3
Since x + y + z=1, it possible to plot these chromaticity coordinates on a two
dimensional plot with x and y as axes called the chromaticity diagram which consists
of [35]. It is possible to calculate the value of X and Z from x, y, and Y.
If a sample is viewed under a specific light source, the amount of light reflected at
each wavelength can be given by Eλ * Rλ, where Eλ is the amount of light emitted and
Rλ is the amount of light reflected at each wavelength. The reflected light can be
matched using the mixture of the three primaries X, Y and Z using the formula [35]:
Eλ Rλ [λ] ≡ Eλ Rλ xˉ [X] + Eλ λ Rλ yˉ [Y] + Eλ λ Rλ zˉ [Z] λ Equation 2.4
The total amount of energy reflected is the sum of Eλ * Rλ over the visible spectrum
of λ 380 to 760 nm. Similarly, the light reflected from a sample can be given by
Σ Eλ Rλ xˉ + Σ Eλ λ Rλ yˉ + Σ Eλ λ Rλ zˉ λ Equation 2.5
From equations 2.4 and 2.5
Since, Eλ, R, xˉ ,yλ ˉ , zλ ˉ are known, it is possible to calculate the tristimulus values for λ
a particular sample.
The CIELAB color space is a three dimensional system is based on three color values
[35]:
Figure 9: CIELAB Color Space
L*: lightness or black to white contribution
a*: red to green contribution
The color difference is calculated from the ΔE*ab numeric value which is calculated
by the equation:
ΔE*ab = √ Equation 2.6
Where,
ΔL*, Δa* and Δb* are the difference in the L*, a* and b* values between the sample
and the reference color.
Color difference can also be expressed in terms of lightness difference ΔL*, chroma
difference ΔC* and hue difference ΔH*.
The CMC color difference formula is given as
ΔE CMC =
√
Equation 2.7
l and c are tolerance parameters for weighting of the lightness and hue differences
and for textile coloration, normally l = 2 and c = 1.
SL =
for L*S ≥ 16 else SL = 0.511
SC =
+ 0.638
f =
√
and
T = 0.38 + |0.4 Cos (35°+ hab,S)|
In the hue angle domain 164°≤ hab,S ≤ 345°, the equation
T = 0.56 + |0.2 Cos (168° + hab,S)| is valid.
The subscript S refers to the sample color.
The ΔE CMC value helps to decide how close the sample matches the reference
standard. The recipe prediction and color matching process has the following
stages: calibration of colorants, measurement of the standard, recipe computation
and recipe correction.
From the Kubelka-Munk theory the function K/S is given by the equation:
K/S =(c1K1+ c2K2+ c3K3+…..+Ks)/Ss Equation 2.8
Where,
c: concentrations of colorants
K: absorption coefficients
S: scattering coefficients
Subscript s identifies substrate and subscripts 1, 2, 3…. identify the individual
Kubelka-Munk theory assumes that the colorant on a substrate reflects and
scatters light and the light loss through the edges is neglected [35, 36]. It also
assumes uniform distribution of dyes and pigments throughout the sample and
absence of interaction between them. Hence, the K/S function leads to non-linearity
at high dye concentration with low reflectance values.
To calibrate the colorants, the textile substrate is dyed at different
concentrations of each individual dye and read in the spectrophotometer to obtain a
reflectance at each interval of the wavelength as a function of dye concentration.
The relationship between K/S and reflectance is given by:
f (R) or K/S = (1-R∞)2/2 R∞, Equation 2.9
Where,
R∞: reflectance of light of a given wavelength by a sample of infinite thickness.
Although the relationship between reflectance and dye concentration is
nonlinear, the relationship between K/S and dye concentration is near linear for
most dye-fiber systems within a defined range as shown in Figure 10. The
reflectance spectrum of the reference standard and the substrate can be measured
the standard at each wavelength it is possible to calculate the amounts of primaries
needed to obtain the particular shade. In the color matching software, a series of
algorithms are executed to predict the dye recipe with the lowest ΔE CMC value. The
error in color matching process can be reduced by reading the standard and the
sample in the same mode with larger aperture for the spectrophotometer. However,
if the sample does not match the standard close enough, a correction can be applied
to the existing recipe. The correction is calculated on the basis of the color value
difference between the standard and the predicted recipe [36]. The algorithm
iteration then corrects the recipe depending on the deviation of the current recipe
from the reference standard.
2.7 Need for new primaries
Dyed cationized cotton samples have higher amounts of dye compared to
traditionally dyed samples [37]. However, changes in the (redness-greenness) a*,
(yellowness-blueness) b* and (Chroma) C* and (hue) h values between the treated
and untreated samples have also been reported [38]. A study on color assessment of
cationized cotton reveals that apart from lower L* values, dyed cationized cotton
samples showed a different trend in C* values [39]. The C* tends to level off with
increasing concentration of dye on the cotton samples. However, it was also seen
that the behavior of red dye on cationized cotton was unusual and different than the
rest of the dyes on cationized cotton. This will limit the application of cationized
cotton in the industry due to the change in appearance of shade. Also, the recipes
used for dyeing untreated cotton would not be applicable for cationized cotton.
Hence, it is necessary to develop new primaries for cationized cotton to overcome
3. Experimental
3.1 Materials
Cotton Inc. supplied greige plain woven fabric rolls of 16kgs each which were used
throughout the experiment. In all, 23 reactive dyes were used along with other
Table 1: List of Chemical and Auxiliaries
Sr. No Name Use Supplier
1. CR-2000 (65%) CHPTAC
(Cationizing agent)
Dow Chemicals
2. Sodium Hydroxide (50%) NaOH
(Alkali)
Brenntag
3. Sodium sulfate Glauber’s Salt
(Electrolyte)
Brenntag
4. Sodium Carbonate Soda Ash
(Alkali)
Brenntag
5. Carboxymethyl cellulose (size 8) CMC
(Leveling agent)
Rohm & Haas
6. Primasol NB NL Wetting Agent BASF
7. Hydrogen peroxide (35%) H2O2 (Bleaching) Brenntag
8. ApolloScour SRDS Surfactant Apollo
Chemicals
9. Acetic Acid (99.85%) Acid Brenntag
Table 2: List of Dyes
Sr. No
Product Name C.I. Name Supplier
1. Novacron Yellow F-4G Reactive Yellow 143 Huntsman
2. Novacron Yellow FN-2R Reactive Yellow 206 Huntsman
3. Novacron Yellow C-R Reactive Yellow 168 Huntsman
4. Novacron Red FN-R Reactive Red 238 Huntsman
5. Novacron Red FN-3G Reactive Red 266 Huntsman
6. Novacron Blue FN-R Reactive Blue 235 Huntsman
7. Novacron Brilliant Blue FN-G Reactive Blue 268 Huntsman
8. Novacron Super Black R - Huntsman
9. Novacron Super Black G - Huntsman
10. Remazol Golden Yellow RGB - Dystar
11. Remazol Red RGB - Dystar
12. Remazol Navy RGB (150%) Reactive Blue 250 Dystar
13. Remazol Turquoise G-A Reactive Blue 21 Dystar
14. Drimaren Yellow K-2R Reactive Yellow 125 Clariant
15. Drimaren Red K-4BL Reactive Red 147 Clariant
16. Drimaren Blue K-2RL Reactive Blue 209 Clariant
17. Drimaren Yellow CL-2R Reactive Yellow 176 Clariant
Table 2 Continued
19. Drimaren Navy CL-R Reactive Black 5 Clariant
20. Drimaren Yellow X-4RN Reactive Orange 70 Clariant
21. Drimaren Red X-6BN Reactive Red 243 Clariant
22. Drimaren Blue X-3LR Reactive Blue 52 Clariant
23. Drimaren Navy X-GN Reactive Blue 214 Clariant
3.2 Equipment
The greige fabric was desized in the laboratory scale Thies jet machine. The
uncationized cotton samples were dyed by the conventional method in Ahiba
Texomat Machine. The cationized cotton samples were dyed in Ahiba Nuance
machine. The samples were measured on an X-rite Colorimeter spectrophotometer
using the Color iContol Software.
3.3 Pretreatment Procedure
Warp size identification on the greige fabric was carried out using the spot test
[40]. The warp size was identified to be polyvinyl alcohol. The fabric was desized
and scoured using 2 g/L of wetting agent and 2 g/L soda ash at 100°C for 2 hrs. The
fabric was then bleached using 6 g/L of H2O2 and 3 g/L of NaOH for 2hrs at 95°C.
acetic acid to obtain a pH of 5-6. A material to liquor ratio of 1:20 was maintained
during the entire process. The fabric was finally dried.
3.4 Cationization Procedure
Cationization of cotton was carried out using a cold pad batch procedure. Two
rolls of the bleached fabric were cationized with 25 g/L and 50 g/L CHPTAC
treatment. CHPTAC and NaOH were mixed in the ratio of 1: 0.6 and the fabric was
padded with this liquor and batched on rollers for 24hrs. After this treatment, the
fabric was rinsed and neutralized with 0.5 g/L citric acid and dried.
3.5 Dyeing Procedures
Each sample approximately weighed 20g and liquor to material ratio of 20:1 was
maintained for all the dyeing procedures. The uncationized cotton samples (CD
samples) were dyed by the conventional method at 0.25, 1.0 and 4.0 % depth on the
weight of fiber along with the dye manufacturer recommended amount of Glauber’s
Table 3: Concentration of Glauber’s salt and Soda Ash used in Dyeing Samples
Novacron ( Yellow, Red, Blue) dyes
% Shade 0.25 0.5 1 2 4
Glauber’s salt (g/L) 30 40 50 60 80
Soda Ash (g/L) 8 10 12 14 18
Novacron (Black) dyes
% Shade 0.5 1 2 4 8
Glauber’s salt (g/L) 40 50 60 80 100
Soda Ash (g/L) 10 12 14 18 18
Remazol dyes
% Shade 0.25 0.5 1 2 4
Glauber’s salt (g/L) 25 30 40 50 65
Soda Ash (g/L) 5 6 8 10.4 14
Drimaren K dyes
% Shade 0.25 0.5 1 2 4
Glauber’s salt (g/L) 20 30 40 60 80
Table 3 Continued
Drimaren CL dyes
% Shade 0.25 0.5 1 2 4
Glauber’s salt (g/L) 40 60 65 70 80
Soda Ash (g/L) 5 10 15 18 20
Drimaren X dyes
% Shade 0.25 0.5 1 2 4
Glauber’s salt (g/L) 20 30 40 60 80
Soda Ash (g/L) 5 8 10 15 20
The cationized cotton samples of 25 g/L (C25 samples) and 50 g/L (C50
samples) were dyed at 0.25, 0.5, 1.0, 2.0 and 4.0 % shades with the recommended
amount of soda ash (Table 3) and without the use of salt.
For Novacron super Black R and Novacron Super Black G 0.5, 2, 8 % shades were
dyed conventionally while the cationized cotton samples were dyed at 0.5, 1, 2, 4
and 8 % shades. 1 g/L of CMC was used as a leveling agent while dyeing cationized
Table 4: Conventional Dyeing Procedure for Novacron Dyes.
Step Procedure
1 Heat the dyeing bath to 60°C and add the calculated amount of salt and
water.
2 Add the fabric and run the machine for 5 minutes at 60°C.
3 Add the dye and run the machine for 5 minutes at 60°C.
4 Add soda ash and continue to run the machine for 40 minutes (45minutes
for blacks) at 60°C.
5 Cool to 50°C and discard the bath.
6 Rinse the samples with hot water at 70°C and then with cold water at
room temperature.
7 Neutralize the samples using 0.5 g/L acetic acid for 5 minutes and discard
the bath.
8 Add 1 g/L of surfactant and scour the samples for 10 minutes at 95°C.
9 Rinse the samples with cold water.
Table 5: Conventional Dyeing Procedure for Remazol Dyes.
Step Procedure
1 Add the calculated amount of salt and water at room temperature.
2 Add the wet fabric and continue to run for 5 minutes.
3 Add the dye and run for 5 minutes.
4 Add 1/3rd the calculated amount of soda ash and run for 10 minutes.
5 Heat the bath to 60°C at 1°C/min (1.8°F/min) and continue to dye at 60°C
for 10 minutes.
6 Add the 2/3rd amount of soda ash and continue to dye at 60°C for 20
minutes.
7 Cool to 50°C and discard the bath.
8 Rinse the samples with hot water at 70°C and then with cold water at
room temperature.
9 Neutralize the samples using 0.5 g/L acetic acid for 5 minutes and discard
the bath.
10 Add 1 g/L of surfactant and scour the samples for 10 minutes at 95°C.
11 Rinse the samples with cold water.
Table 6: Conventional Dyeing Procedure for Drimaren K Dyes.
Step Procedure
1 Add the calculated amount of salt and water at room temperature.
2 Add the wet fabric and run for 5 minutes.
3 Add the dye and run for 10 minutes.
4 Add soda ash and run for 10 minutes.
5 Heat the bath to 60°C at 1°C/min (1.8°F/min) and continue dyeing for 40
minutes at 60°C.
6 Cool to 50°C and discard the bath.
7 Rinse the samples with hot water at 70°C and then with cold water at
room temperature.
8 Neutralize the samples using 0.5 g/L acetic acid for 5 minutes and discard
the bath.
9 Add 1 g/L of surfactant and scour the samples for 10 minutes at 95°C.
10 Rinse the samples with cold water.
Table 7: Conventional Dyeing Procedure for Drimaren CL Dyes.
Step Procedure
1 Add the calculated amount salt and water at room temperature.
2 Add wet fabric in the bath and run for 5 minutes.
3 Heat to 60°C @ 1°C/min (1.8°F/min)
4 Add the dye and run for 10 minutes at 60°C.
5 Add soda ash and continue to dye for 40 minutes at 60°C.
6 Cool to 50°C and discard the bath.
7 Rinse the samples with hot water at 70°C and then with cold water at
room temperature.
8 Neutralize the samples using 0.5 g/L acetic acid for 5 minutes and discard
the bath.
9 Add 1 g/L of surfactant and scour the samples for 10 minutes at 95°C.
10 Rinse the samples with cold water.
Table 8: Conventional Dyeing Procedure for Drimaren X Dyes.
Step Procedure
1 Add the calculated amount salt and water at room temperature.
2 Add wet fabric in the bath and run for 5 minutes.
3 Heat to 95°C @ 1°C/min (1.8°F/min)
4 Add the dye and run for 10 minutes at 95°C.
5 Add soda ash and continue to dye for 40 minutes at 95°C.
6 Cool to 50°C and discard the bath.
7 Rinse the samples with hot water at 70°C and then with cold water at
room temperature.
8 Neutralize the samples using 0.5 g/L acetic acid for 5 minutes and discard
the bath.
9 Add 1 g/L of surfactant and scour the samples for 10 minutes at 95°C.
10 Rinse the samples with cold water.
Table 9: Dyeing Procedure for Cationized Cotton samples.
Step Procedure
1 Add the calculated amount of water, dye, soda ash and CMC in the beaker.
2 Add the wet fabric and seal the beaker.
3 Heat the chamber to 60°C (95°C for Drimaren X dyes) at 2°C/min.
4 Continue dyeing for 40 minutes (45 minutes for Novacron black dyes) at
60°C.
5 Cool to 40°C and discard the bath.
6 Rinse the samples with hot water at 70°C and then with cold water at
room temperature.
7 Neutralize the samples using 0.5 g/L acetic acid for 5 minutes and discard
the bath.
8 Rinse the samples with cold water.
3.6 Evaluation Procedures
K/Ssum of all the samples was measured where,
K/Ssum = sum of the K/S values over the wavelength from 360 to 750nm.
Spectrophotometer reading conditions:
- Reflectance mode
- Specular condition Included
- Port Diameter = 25 mm
- UV energy Excluded
- Average of 4 readings
- Across the visible spectrum of 360 to 750 nm at 10nm intervals
The formula used for calculating the dye bath exhaustion is:
% E = 1 – (AAD / ABD) X 100, where
AAD = sum of absorbance of the dye bath after the dyeing cycle over the wavelengths
360 to 750 nm.
ABD = sum of absorbance of the dye bath before the dyeing cycle over the wavelength
360 to 750 nm.
AATCC Test method 61-2A was followed to carry out Wash fastness tests [41].
3.7 Colorant Database Evaluation
Reflectance spectra of CD, C25 and C50 samples dyed using different
concentrations of each colorant were measured on the spectrophotometer and a
new colorant database was created. To formulate a recipe, the standard and the
substrate were read on the spectrophotometer and the three colorants to be used as
primaries were selected. The software predicted the starting recipes using the
conventional and cationized primaries which were then dyed on the cationized
cotton and were compared to the standard on the basis of the ΔE CMC value. The
recipe correction was applied to the samples dyed with Remazol dyes in which the
samples dyed with the predicted recipe was read on the spectrophotometer and the
4. Results and Discussion
4.1 Dyed Cationized cotton samples
Cationized cotton contains positive charges which attracts the anionic reactive
dyes thus eliminating the use of salt. However, it is seen that dyed cationized cotton
samples tend to have leveling problems. The reason for unlevel dyeing is due to the
strong attraction between the cationic sites on the fiber and the anionic dye which
increases the strike of the dye as soon as it comes in contact with fabric. Hence,
carboxymethyl cellulose (CMC) is commonly used as a leveling agent while dyeing
cationized cotton with anionic dyes. CMC is a negatively charged polymer with acts
as a competitor to the anionic dye for the cationic sites thus reducing the strike of
the dye [7].
The samples obtained by dyeing 25 g/L CHPTAC fabric were level for all %
shades and dyes by visual inspection. However, the 0.25 and 0.5% shades for 50 g/L
CHPTAC samples were unlevel for all the dyes. 50 g/L CHPTAC samples had more
cationic sites available than dye available from the 0.25 and 0.5% shades. Due to
this, even 1 g/L of CMC was not effective to control the high strike of dye and thus
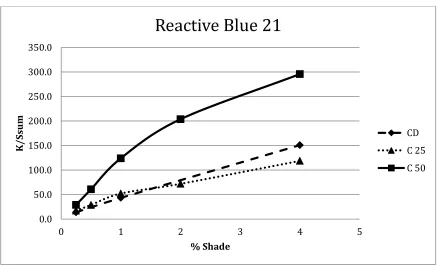
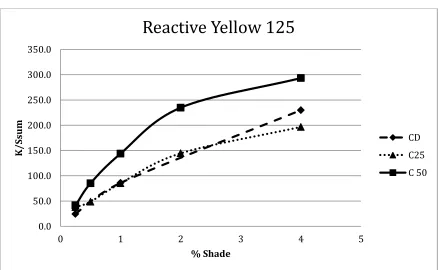
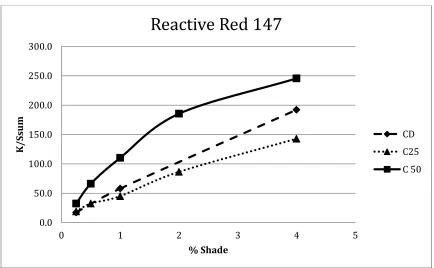
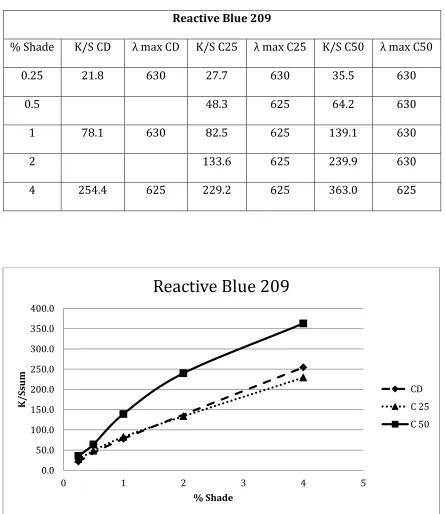
4.2 Comparison of K/S values
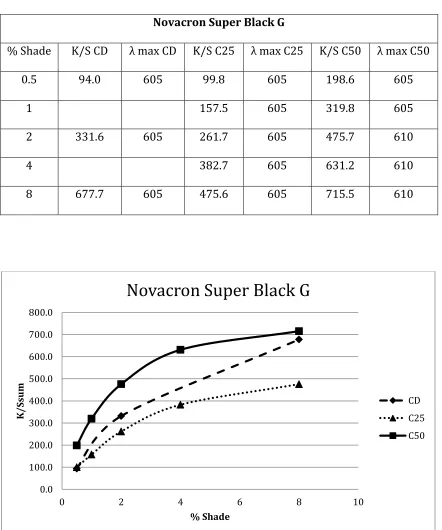
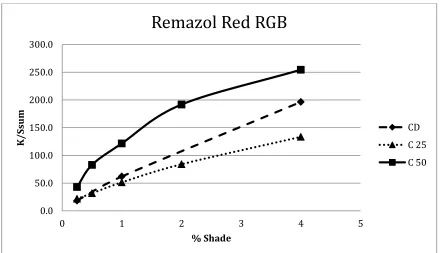
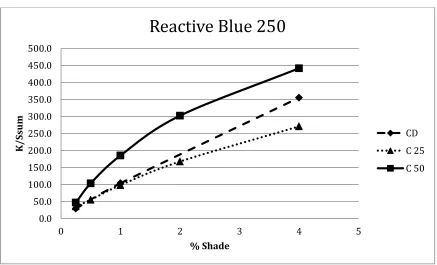
K/Ssum values for all the samples are reported in Tables 10-32 and the plots of
K/Ssum vs. % shade are reported in Figures 11-33. The K/Ssum has been reported for
all the samples in order to incorporate the change in λmax due to change in hue for
the dyed cationized cotton samples. It can be clearly seen from these plots and
tables that the C50 samples have higher K/Ssum compared to the conventionally
dyed samples. More amounts of dye are present on C50 samples than on the CD
samples.
The K/Ssum values for C25 samples are slightly higher or comparable to CD
samples up to 1% shades after which C25 samples have lesser K/Ssum values. C25
samples have lesser number of cationic sites hence, when more amount of dye is
added in the bath there are not enough cationic sites available for the dye to get
exhausted and thus C25 samples have lesser amount of dye on the fabric for %
shades greater than 1%.
The C25 samples achieve an early plateau region due to lesser color yield at
higher % shades compared to CD and C50 samples. The pattern of plot of K/Ssum vs.
% shade is different of each dye. For some dyes the difference in the color yield
between C50 and CD samples is very high and for some dyes this difference is less.
However, the color yield for C50 samples remains higher for all the dyes compared
to the CD and C25 samples. Hence, lesser amount of dye is required to achieve a
Table 10: K/Ssum values for Reactive Yellow 143
Reactive Yellow 143
%Shade K/S CD λ max CD K/S C25 λ max C25 K/S C50 λ max C50
0.25 6.8 430 13.1 430 31.5 430
0.5 24.1 430 47.7 430
1 23.3 430 37.1 430 86.6 430
2 62.1 430 127.9 430
4 88.4 430 93.4 430 161.8 430
Figure 11: Plot of K/Ssum vs. % Shade for Reactive Yellow 143 0.0
20.0 40.0 60.0 80.0 100.0 120.0 140.0 160.0 180.0
0 1 2 3 4 5
K
/S
su
m
% Shade
Reactive Yellow 143
Table 11: K/Ssum values for Reactive Yellow 206
Reactive Yellow 206
% Shade K/S CD λ max CD K/S C25 λ max C25 K/S C50 λ max C50
0.25 28.0 435 31.2 430 42.1 430
0.5 48.7 430 77.9 430
1 86.8 435 75.9 430 137.5 430
2 109.7 430 206.7 435
4 228.6 435 151.0 430 268.0 435
Figure 12: Plot of K/Ssum vs. % Shade for Reactive Yellow 206
0.0 50.0 100.0 150.0 200.0 250.0 300.0
0 1 2 3 4 5
K
/S
su
m
% Shade
Reactive Yellow 206
CD
C25
Table 12: K/Ssum values for Reactive Yellow 168
Reactive Yellow 168
% Shade K/S CD λ max CD K/S C25 λ max C25 K/S C50 λ max C50
0.25 20.0 415 27.0 415 38.8 415
0.5 42.9 415 70.1 415
1 67.5 415 70.6 415 117.9 415
2 133.3 415 180.4 415
4 200.4 415 162.2 415 241.7 420
Figure 13: Plot of K/Ssum vs. % Shade for Reactive Yellow 168 0.0
50.0 100.0 150.0 200.0 250.0 300.0
0 1 2 3 4 5
K
/S
su
m
% Shade
Reactive Yellow 168
Table 13: K/Ssum values for Reactive Red 238
Reactive Red 238
% Shade K/S CD λ max CD K/S C25 λ max C25 K/S C50 λ max C50
0.25 19.3 550 21.8 550 39.4 550
0.5 35.5 550 75.7 550
1 61.8 550 56.8 550 132.8 550
2 87.7 550 183.9 550
4 183.9 550 120.4 550 251.7 525
Figure 14: Plot of K/Ssum vs. % Shade for Reactive Red 238 0.0
50.0 100.0 150.0 200.0 250.0 300.0
0 1 2 3 4 5
K
/S
su
m
% Shade
Reactive Red 238
Table 14: K/Ssum values for Reactive Red 266
Reactive Red 266
%Shade K/S CD λ max CD K/S C25 λ max C25 K/S C50 λ max C50
0.25 45.9 525 48.8 525 71.5 525
0.5 76.8 525 144.3 520
1 154.6 520 126.6 525 212.4 520
2 190 520 298.1 515
4 311.2 515 243.9 520 364.5 515
Figure 15: Plot of K/Ssum vs. % Shade for Reactive Red 266 0.0
50.0 100.0 150.0 200.0 250.0 300.0 350.0 400.0
0 1 2 3 4 5
K
/S
su
m
% Shade
Reactive Red 266
Table 15: K/Ssum values for Reactive Blue 235
Reactive Blue 235
% Shade K/S CD λ max CD K/S C25 λ max C25 K/S C50 λ max C50
0.25 28.0 625 28.3 625 43.2 625
0.5 52.2 620 75.2 625
1 90.9 625 81.4 620 141.6 625
2 129.9 620 215.3 625
4 279.3 620 192.4 620 315.8 620
Figure 16: Plot of K/Ssum vs. % Shade for Reactive Blue 235 0.0
50.0 100.0 150.0 200.0 250.0 300.0 350.0
0 1 2 3 4 5
K
/S
su
m
% Shade
Reactive Blue 235
Table 16: K/Ssum values for Reactive Blue 268
Reactive Blue 268
% Shade K/S CD λ max CD K/S C25 λ max C25 K/S C50 λ max C50
0.25 38.8 635 36.1 635 73.3 640
0.5 61.8 635 148.1 640
1 131.2 635 103.1 645 233.4 640
2 162.1 640 325.8 640
4 318.7 635 219.3 635 416.5 640
Figure 17: Plot of K/Ssum vs. % Shade for Reactive Blue 268 0.0
50.0 100.0 150.0 200.0 250.0 300.0 350.0 400.0 450.0
0 1 2 3 4 5
K
/S
su
m
% Shade
Reactive Blue 268
Table 17: K/Ssum values for Novacron Super Black R
Novacron Super Black R
% Shade K/S CD λ max CD K/S C25 λ max C25 K/S C50 λ max C50
0.5 90.5 590 100.3 575 184.4 605
1 176.1 570 334.7 585
2 325.1 600 266.5 575 469.8 580
4 402.0 580 626.3 565
8 654.9 565 527.8 580 735.0 560
Figure 18: Plot of K/Ssum vs. % Shade for Novacron Super Black R 0.0
100.0 200.0 300.0 400.0 500.0 600.0 700.0 800.0
0 2 4 6 8 10
K
/S
su
m
% Shade
Novacron Super Black R
Table 18: K/Ssum values for Novacron Super Black G
Novacron Super Black G
% Shade K/S CD λ max CD K/S C25 λ max C25 K/S C50 λ max C50
0.5 94.0 605 99.8 605 198.6 605
1 157.5 605 319.8 605
2 331.6 605 261.7 605 475.7 610
4 382.7 605 631.2 610
8 677.7 605 475.6 605 715.5 610
Figure 19: Plot of K/Ssum vs. % Shade for Novacron Super Black G 0.0
100.0 200.0 300.0 400.0 500.0 600.0 700.0 800.0
0 2 4 6 8 10
K
/S
su
m
% Shade
Novacron Super Black G
Table 19: K/Ssum values for Remazol Golden Yellow RGB
Remazol Golden Yellow RGB
% Shade K/S CD λ max CD K/S C25 λ max C25 K/S C50 λ max C50
0.25 15.9 430 17 430 33.6 430
0.5 32.8 430 61.3 430
1 51.6 430 44.7 430 100.1 430
2 70.1 430 166.6 430
4 171.2 425 105.3 430 230.6 425
Figure 20: Plot of K/Ssum vs. % Shade for Remazol Golden Yellow RGB 0.0
50.0 100.0 150.0 200.0 250.0
0 1 2 3 4 5
K
/S
su
m
% Shade
Remazol Golden Yellow RGB
Table 20: K/Ssum values for Remazol Red RGB
Remazol Red RGB
% Shade K/S CD λ max CD K/S C25 λ max C25 K/S C50 λ max C50
0.25 18.3 535 21.8 535 43.0 535
0.5 31.6 535 82.9 530
1 61.9 535 51.4 535 121.6 530
2 84 535 191.7 530
4 196.3 530 133.4 535 254.4 525
Figure 21: Plot of K/Ssum vs. % Shade for Remazol Red RGB 0.0
50.0 100.0 150.0 200.0 250.0 300.0
0 1 2 3 4 5
K
/S
su
m
% Shade
Remazol Red RGB
Table 21: K/Ssum values for Reactive Blue 250
Reactive Blue 250
% Shade K/S CD λ max CD K/S C25 λ max C25 K/S C50 λ max C50
0.25 29.1 615 35.9 615 47.1 615
0.5 55.3 615 103.7 615
1 103.9 615 98.3 615 185.4 615
2 167.8 610 302.5 610
4 355.4 610 271 610 441.8 610
Figure 22: Plot of K/Ssum vs. % Shade for Reactive Blue 250 0.0 50.0 100.0 150.0 200.0 250.0 300.0 350.0 400.0 450.0 500.0
0 1 2 3 4 5
K
/S
su
m
% Shade
Reactive Blue 250
Table 22: K/Ssum values for Reactive Blue 21
Reactive Blue 21
% Shade K/S CD λ max CD K/S C25 λ max C25 K/S C50 λ max C50
0.25 13.8 675 17.1 675 29.0 675
0.5 28.8 675 60.8 675
1 43.3 675 52.1 675 124.0 675
2 71.9 675 203.7 675
4 150.8 675 118.7 675 295.6 675
Figure 23: Plot of K/Ssum vs. % Shade for Reactive Blue 21 0.0
50.0 100.0 150.0 200.0 250.0 300.0 350.0
0 1 2 3 4 5
K
/S
su
m
% Shade
Reactive Blue 21
Table 23: K/Ssum values for Reactive Yellow 125
Reactive Yellow 125
% Shade K/S CD λ max CD K/S C25 λ max C25 K/S C50 λ max C50
0.25 24.5 420 37.9 420 41.4 425
0.5 48.7 420 85.2 425
1 85.9 420 85.2 415 143.9 425
2 144.5 420 234.8 420
4 229.9 420 196.7 415 293.4 420
Figure 24: Plot of K/Ssum vs. % Shade for Reactive Yellow 125 0.0
50.0 100.0 150.0 200.0 250.0 300.0 350.0
0 1 2 3 4 5
K
/S
su
m
% Shade
Reactive Yellow 125
Table 24: K/Ssum values for Reactive Red 147
Reactive Red 147
% Shade K/S CD λ max CD K/S C25 λ max C25 K/S C50 λ max C50
0.25 17.1 550 18.9 545 32.3 550
0.5 32.5 550 66.2 550
1 58.0 550 45 545 110.3 550
2 86.4 545 185.4 550
4 192.1 550 142.8 545 245.5 550
Figure 25: Plot of K/Ssum vs. % Shade for Reactive Red 147 0.0
50.0 100.0 150.0 200.0 250.0 300.0
0 1 2 3 4 5
K
/S
su
m
% Shade
Reactive Red 147
Table 25: K/Ssum values for Reactive Blue 209
Reactive Blue 209
% Shade K/S CD λ max CD K/S C25 λ max C25 K/S C50 λ max C50
0.25 21.8 630 27.7 630 35.5 630
0.5 48.3 625 64.2 630
1 78.1 630 82.5 625 139.1 630
2 133.6 625 239.9 630
4 254.4 625 229.2 625 363.0 625
Figure 26: Plot of K/Ssum vs. % Shade for Reactive Blue 209 0.0
50.0 100.0 150.0 200.0 250.0 300.0 350.0 400.0
0 1 2 3 4 5
K
/S
su
m
% Shade
Reactive Blue 209
Table 26: K/Ssum values for Reactive Yellow 176
Reactive Yellow 176
% Shade K/S CD λ max CD K/S C25 λ max C25 K/S C50 λ max C50
0.25 19.8 435 24.1 425 50.7 435
0.5 40.7 425 85.8 435
1 64.7 435 64.2 425 134.2 435
2 96.4 430 194.5 430
4 156.3 435 131.0 430 250.5 430
Figure 27: Plot of K/Ssum vs. % Shade for Reactive Yellow 176 0.0
50.0 100.0 150.0 200.0 250.0 300.0
0 1 2 3 4 5
K
/S
su
m
% Shade
Reactive Yellow 176
Table 27: K/Ssum values for Reactive Red 197
Reactive Red 197
% Shade K/S CD λ max CD K/S C25 λ max C25 K/S C50 λ max C50
0.25 18.6 550 20.6 550 34.0 550
0.5 35.9 550 67.0 550
1 69.2 550 55.2 550 123.2 550
2 94.5 550 184.5 550
4 192.0 550 138.4 550 251.2 550
Figure 28: Plot of K/Ssum vs. % Shade for Reactive Red 197 0.0
50.0 100.0 150.0 200.0 250.0 300.0
0 1 2 3 4 5
K
/S
su
m
% Shade
Reactive Red 197
Table 28: K/Ssum values for Reactive Black 5
Reactive Black 5
% Shade K/S CD λ max CD K/S C25 λ max C25 K/S C50 λ max C50
0.25 46.1 605 45.9 605 102.1 605
0.5 87.2 605 172.6 605
1 172.1 605 144.3 605 277.0 610
2 247.1 605 405.2 605
4 482.7 610 371.1 605 542.2 580
Figure 29: Plot of K/Ssum vs. % Shade for Reactive Black 5 0.0
100.0 200.0 300.0 400.0 500.0 600.0
0 1 2 3 4 5
K
/S
su
m
% Shade
Reactive Black 5
Table 29: K/Ssum values for Reactive Orange 70
Reactive Orange 70
% Shade K/S CD λ max CD K/S C25 λ max C25 K/S C50 λ max C50
0.25 19.4 440 22.5 425 34.1 435
0.5 37.4 430 68.9 435
1 72.0 435 62.8 430 113.3 435
2 103.1 425 188.9 435
4 217.6 435 161.7 425 265.9 435
Figure 30: Plot of K/Ssum vs. % Shade for Reactive Orange 70 0.0
50.0 100.0 150.0 200.0 250.0 300.0
0 1 2 3 4 5
K
/S
su
m
% Shade
Reactive Orange 70
Table 30: K/Ssum values for Reactive Red 243
Reactive Red 243
% Shade K/S CD λ max CD K/S C25 λ max C25 K/S C50 λ max C50
0.25 18.4 555 28.9 555 42.5 555
0.5 47.8 555 80.7 555
1 64.4 555 77.2 555 133.0 555
2 121.4 555 209.0 555
4 226.9 555 179.1 555 282.2 555
Figure 31: Plot of K/Ssum vs. % Shade for Reactive Red 243 0.0
50.0 100.0 150.0 200.0 250.0 300.0
0 1 2 3 4 5
K
/S
su
m
% Shade
Reactive Red 243
Table 31: K/Ssum values for Reactive Blue 52
Reactive Blue 52
% Shade K/S CD λ max CD K/S C25 λ max C25 K/S C50 λ max C50
0.25 16.6 630 34.3 630 43.2 630
0.5 50.2 630 80.0 630
1 65.2 630 63 630 135.4 630
2 101.7 630 229.3 630
4 236.3 630 150.3 625 342.7 630
Figure 32: Plot of K/Ssum vs. % Shade for Reactive Blue 52 0.0
50.0 100.0 150.0 200.0 250.0 300.0 350.0 400.0
0 1 2 3 4 5
K
/S
su
m
% Shade
Reactive Blue 52
CD
C 25
Table 32: K/Ssum values for Reactive Blue 214
Reactive Blue 214
% Shade K/S CD λ max CD K/S C25 λ max C25 K/S C50 λ max C50
0.25 22.2 620 28.3 615 53.6 615
0.5 49 615 100.5 615
1 79.0 615 86.4 615 159.2 615
2 164.5 615 254.3 610
4 294.7 615 253 615 366.9 610
Figure 33: Plot of K/Ssum vs. % Shade for Reactive Blue 214 0.0
50.0 100.0 150.0 200.0 250.0 300.0 350.0 400.0
0 1 2 3 4 5
K
/S
su
m
% Shade
Reactive Blue 214
4.3 Comparison of L*, a* and b* values
Table 33 compares the L*, a* and b* values for all the samples. For a particular
dye and shade, the L*, a* and b* values are different for C50 and C25 samples when
compared to the corresponding CD samples. For instance, considering the Reactive
Red 266 dye at 4% shade, for the CD sample L*= 38.4, a*= 54.12, b*= 26.28, for the
C25 sample L*= 42.43, a*= 57.41, b*= 27.02 and for C50 sample L*= 39.07, a*=
56.04, b*= 31.72. The C25 sample above is lighter, redder and bluer while the C50
sample is darker, greener and yellower compared to the CD sample. These
differences are observed for all the shades and dyes. This restricts the use of the
recipes from existing conventional primaries on cationized cotton since the shades
obtained on cationized cotton will be different than that on untreated cotton. Also, it
Table 33: L*, a*, b* values of CD, C25 and C50 samples
Dye % Shade Sample L* a* b*
Reactive Yellow 143
0.25
CD 93.42 -7.26 44.48
C25 91.25 -7.25 54.61
C50 89.01 -7.09 69.49
1
CD 91.01 -6.05 67.38
C25 88.63 -5.25 73.67
C50 85.2 -2.39 85.4
4
CD 87.31 -0.93 90.36
C25 85.46 -0.49 88.48
C50 82.9 4.36 95.58
Reactive Yellow 206
0.25
CD 82.63 17.3 58.12
C25 81.56 15.9 58.48
C50 80.27 17.45 63.25
1
CD 75.19 29.57 73.7
C25 75.03 24.3 69.31
C50 71.7 31.5 77.33
4
CD 66.87 41.5 79.93
C25 68.42 30.34 73.49
Table 33 Continued
Reactive Yellow 168
0.25
CD 86.64 8.56 53.54
C25 84.6 9.04 56.61
C50 83.6 11.55 64.45
1
CD 80.22 19.12 72.59
C25 78.46 18.14 69.69
C50 76.04 22.95 78.61
4
CD 72 30.89 83.87
C25 71 26.38 76.79
C50 67.3 32.76 79.96
Reactive Red 238
0.25
CD 65.06 42.07 -7.96
C25 63.53 45.83 -8.37
C50 57.54 53.57 -7.56
1
CD 51.48 53.46 -5.96
C25 53.08 55.28 -6.1
C50 45.14 60.6 0.58
4
CD 39.83 57.1 0.92
C25 44.99 58.53 -1.74
Table 33 Continued
Reactive Red 266
0.25
CD 59.12 50.32 12.76
C25 59.19 52.08 14.21
C50 56.84 56.55 19.15
1
CD 46.3 56.15 21.6
C25 49.75 57.86 22.45
C50 45.62 58.66 28.93
4
CD 38.4 54.12 26.28
C25 42.43 57.41 27.02
C50 39.07 56.04 31.72
Reactive Blue 235
0.25
CD 60.09 -3.76 -23.12
C25 59.86 -4.54 -23.45
C50 54.45 -3.55 -29.18
1
CD 43.65 -2.27 -28.82
C25 45.13 -3.2 -27.57
C50 37.59 0.58 -32.35
4
CD 27.93 2.78 -28.8
C25 33.14 -0.63 -28.35
Table 33 Continued
Reactive Blue 268
0.25
CD 59.85 -10.69 -33.24
C25 60.78 -11.68 -31.88
C50 54.69 -14.35 -36.98
1
CD 44.45 -6.7 -39.77
C25 48.98 -10.59 -36.67
C50 38.15 -4.89 -40.95
4
CD 31.13 2.18 -40.29
C25 37.21 -3.4 -38.52
C50 27.64 2.55 -37.46
Novacron super
Black R
0.5
CD 41.22 1.05 -4.5
C25 39.45 3.17 -3.68
C50 30.86 0.2 -6.71
2
CD 23.73 1.78 -2.88
C25 25.98 3.25 -3
C50 19.58 2.01 -2.16
8
CD 16.5 1.25 -1.11
C25 18.22 1.95 -2.36
Table 33 Continued
Novacron super
Black G
0.5
CD 41.61 -3.97 -2.96
C25 40.78 -3.84 -1.82
C50 30.7 -4.16 -4.46
2
CD 24.2 -2.42 -2.14
C25 27.22 -2.77 -1.74
C50 20.03 -1.36 -1.39
8
CD 16.44 -0.05 -0.82
C25 19.85 -1.73 -2.57
C50 15.94 0.29 -0.42
Remazol Golden
Yellow RGB
0.25
CD 85.1 12 48.4
C25 84.34 10.95 48.7
C50 81.66 16.24 61.59
1
CD 77.54 22.72 65.31
C25 77.84 20.04 61.82
C50 73.97 27.4 75.07
4
CD 68.17 34.22 76.89
C25 70.68 28.2 70.63
Table 33 Continued
Remazol Red RGB
0.25
CD 65.97 42.81 -5.67
C25 63.93 44.89 -5.96
C50 57.2 54.52 -5.55
1
CD 52.48 54.96 -2.81
C25 54.31 53.05 -3.82
C50 46.16 59.42 1.26
4
CD 40.65 58.67 5.12
C25 44.61 58.79 1.71
C50 38.17 57.47 9.1
Reactive Blue 250
0.25
CD 59.45 -10.14 -14.56
C25 56.33 -10.71 -16.1
C50 52.94 -12.03 -18.4
1
CD 41.4 -10.83 -17.64
C25 42.03 -10.76 -17.95
C50 33.23 -9.36 -18.53
4
CD 24.02 -5.95 -14.32
C25 27.75 -7.64 -16.21