TSUNAMI RISK AND VULNERABILITY:
REMOTE SENSING AND GIS APPROACHES FOR SURFACE
ROUGHNESS DETERMINATION, SETTLEMENT MAPPING
AND POPULATION DISTRIBUTION MODELING
Dissertation
der Fakultät für Geowissenschaften
der Ludwig-Maximilians-Universität München
eingereicht von
1. Gutachter: Prof. Dr. Ralf Ludwig
2. Gutachter: Prof. Dr. Günter Strunz
First, I would like to sincerely thank my supervisors, Prof. Dr. Ralf Ludwig and Prof. Dr. Günter Strunz, for their support, guidance and care in finalizing this PHD thesis. Special thanks go to Dr. Kai Zoßeder, Dr. Joachim Post, Dr. Torsten Riedlinger, Matthias Mück and Stephanie Wegscheider for three and a half years of intensive discussions — I learned a great deal from all of you. My appreciation also goes to other United Nations University, Institute for Environmental and Human Security (UNU-EHS) PhD students, Sumaryono, Widjo Kongko, and Widodo S. Pranowo for fruitful collaboration in carrying out the research. Thanks also to Evalyne Katabaro from UNU-EHS for the invaluable help on administrative matters.
I am very fortunate to have my wife, Retno Kustiyah, who always gives me support, encouragement and delicious Indonesian food during my stay in Germany. Thanks for your patience and love. My lovely son, Fathan Muhammad Alif, you are my inspiration to keep my spirits up. To my mother, my mother-in-law and all my family in Pekalongan and Batu, Indonesia, thank you for providing me every day ‘doa’ for our success.
I would also like to thank Prof. Stefan Dech and Dr. Harald Mehl for having facilitated my work at DLR and also to Ibu Ratih Dewanti, Ibu Komala and Pak Agus Hidayat from LAPAN for providing their permission for me to study in Germany. It has been a great opportunity for me to study and learn about the science and culture. Thanks also go to all my colleagues, too many to mention — to whom I would just like to say, vielen dank.
SUMMARY
The research focuses on providing reliable spatial information in support of tsunami risk and vulnerability assessment within the framework of the German-Indonesian Tsunami Early Warning System (GITEWS) project. It contributes to three major components of the project: (1) the provision of spatial information on surface roughness as an important parameter for tsunami inundation modeling and hazard assessment; (2) the modeling of population distribution, which is an essential factor in tsunami vulnerability assessment and local disaster management activities; and (3) the settlement detection and classification from remote sensing radar imagery to support the population distribution research.
Regarding the surface roughness determination, research analyses on surface roughness classes and their coefficients have been conducted. This included the development of remote sensing classification techniques to derive surface roughness classes, and integration of the thus derived spatial information on surface roughness conditions to tsunami inundation modeling. This research determined 12 classes of surface roughness and their respective coefficients based on analyses of published values.
was demonstrated that the inundation modeling results applying uniform and spatially distributed surface roughness resulted in high differences of inundation lengths, especially in areas far from the coastline. This result showed the important role of surface roughness conditions in resisting tsunami flow, which must be considered in tsunami inundation modeling.
With respect to the second research focus, the population distribution, a concept of population distribution modeling was developed. Within the modeling process, weighting factor determination, multi-scale disaggregation and a comparative study to other methods were conducted. The basis of the developed method was a combination of census and land use data, which led to an improved spatial resolution and accuracy of the population distribution. Socio-economic data were used to derive weighting factors to distributing people to land use classes. Moreover, in case of missing input data, an approach was developed that allows for the determination of generalized weighting factors. The approach to use specific weightings, where possible and generalized ones, where necessary, led to a flexible methodology with respect to the achievable accuracy and availability of data. A comparative study was performed by comparing this new model with previously developed population distribution models. The newly developed model showed a higher accuracy. The detailed population distribution information was a valuable input for the vulnerability assessment being the main data source for human exposure assessment and an important contribution to evacuation time modeling.
In support of the population distribution research, settlement classification using TerraSAR-X imagery was conducted. A current classification method of speckle divergence analysis on SAR imagery was further developed and improved by including the neighborhood concept. The settlement classification provided highly accurate results in dense urban areas, whereas the method needs to be further developed and improved for rural settlement areas.
CONTENTS
Summary ... I Contents ... III List of Figures ... VII List of Tables ... XII
CHAPTER 1: INTRODUCTION
1.1. Motivation ... 1
1.2. Research Questions ... 4
1.3. Research Objectives ... 5
1.4. Research Benefits... 6
1.5. Thesis Structure... 6
CHAPTER 2: RESEARCH FRAMEWORK
2.1. GITEWS Framework... 82.2. Risk and Vulnerability Framework ... 10
2.3. Research Contribution to Tsunami Risk assessment ... 12
2.4. Study Area ... 13
CHAPTER 3: STATE OF THE ART OF RESEARCH
3.1. Remote Sensing and Tsunami Risk and Vulnerability ... 193.1.1. Overview ... 19
3.1.2. Damage assessment ... 20
3.1.3. Derivation of relevant information for risk and vulnerability .. 20
3.1.4. Monitoring of reconstruction and rebuilding in the post disaster phase ... 21
3.1.5. Remote sensing classification techniques ... 21
3.2.6. Summary of surface roughness determination ... 36
3.3. Population Distribution Modeling ... 37
3.3.1. Overview... 37
3.3.2. Top-down approaches ... 38
3.3.3. Bottom-up approaches ... 52
3.3.4. Summary of population distribution modeling ... 56
3.4. Settlement Classification Using Remote Sensing Data ... 57
3.4.1. Overview... 57
3.4.2. Settlement classification using optical imagery... 57
3.4.3. Settlement classification using SAR imagery ... 59
3.4.4. Using data fusion of optical and SAR Imagery ... 62
3.4.5. Summary of settlement classification using remote sensing data... 63
3.5. Conclusion of State of the Art of Research... 63
CHAPTER 4: METHODOLOGY
4.1. Data Requirement... 674.2. Surface Roughness Determination ... 68
4.2.1. Surface roughness classes and their coefficient estimation... 68
4.2.2. Surface roughness classification... 69
4.2.3. Accuracy Assessment ... 75
4.2.4. Integration into tsunami inundation modeling ... 77
4.3. Population Distribution Modeling ... 82
4.3.1. General concept ... 82
4.3.2. Weighting factor determination... 84
4.3.3. Accuracy Assessment ... 87
4.3.4. Multi-scale disaggregation... 88
4.3.5. Comparative study... 90
4.4. Settlement Classification by Using Radar Imagery Based on Speckle Divergence and Neighborhood Analysis... 91
4.4.1. Classification procedure... 91
4.4.2. Accuracy Assessment ... 94
4.3.4. Transfer of the approach to other areas ... 94
CHAPTER 5: RESULTS
5.1. Data Collection... 955.1.1. Satellite imagery and spatial information ... 95
5.1.2. Demographic and socio-economic statistics ... 98
5.1.3. Reference data... 99
5.2.2. Surface roughness classification by remote sensing... 104
5.2.3. Integration of surface roughness for tsunami inundation modelling ... 114
5.3. Population Distribution Modeling ... 117
5.3.1. Result of the population distribution modeling concept... 117
5.3.2. Weighting factor determination ... 119
5.3.3. Result from questionnaire analysis... 126
5.3.4. Error of population distribution (EPD) ... 127
5.3.5. Comparative study ... 128
5.3.6. Multi-scale disaggregation for population distribution in Sumatra, Java and Bali... 129
5.3. Settlement Classification ... 131
5.4.1. Pre-processing... 131
5.4.2. Classification result ... 132
CHAPTER 6: DISCUSSIONS
6.1. Data Collection ... 1366.1.1. Satellite imagery and spatial information ... 136
6.1.2. Demographic and socio-economic statistics... 137
6.1.3. Reference data ... 137
6.2. Surface Roughness Determination ... 138
6.2.1. Surface roughness classes and their coefficient estimation .... 138
6.2.2. Surface roughness classification by remote sensing... 140
6.2.3. Integration of surface roughness for tsunami inundation modeling... 143
6.3. Population Distribution Modeling ... 144
6.3.1. Weighting factor determination ... 144
6.3.2. Accuracy of population distribution ... 145
6.3.3. Multi-scale disaggregation of population distribution... 146
6.3.5. Commuters ... 146
6.4. Settlement classification ... 148
8.1. Surface Roughness Determination ... 159
8.2. Population Distribution Modeling ... 160
8.3. Settlement Classification... 161
8.4. Application of the Research ... 162
References ... 163
List of Figures
1.1 The occurrence of tsunami with their earthquake moment magnitudes and intensities along the Sunda trench (Source:
ITDB/WLD, 2007) 1
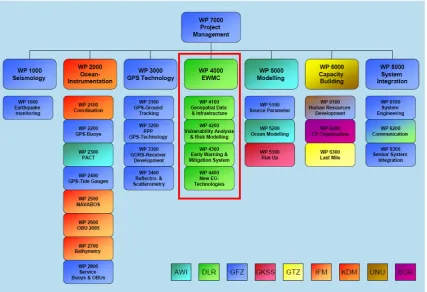
2.1 GITEWS Early Warning System framework 9
2.2 The GITEWS Work Packages 9
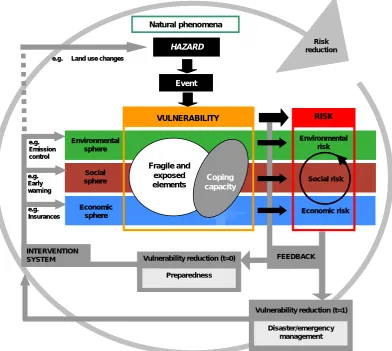
2.3 The risk and vulnerability concept from Bogardi, Birkmann and
Cardona (the BBC Framework) 11
2.4 The GITEWS risk and vulnerability framework, the blue boxes
are high lightening the research contribution 11
2.5 The elements of research 14
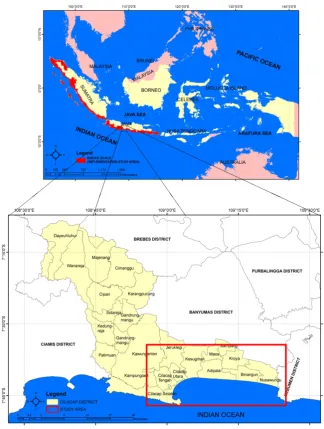
2.6 The research study area, Cilacap as pilot region (below) and the broad scale area (above) for the implementation of population distribution 15
2.7 The bathymetry, the subduction zone, and the historical tsunami and earthquake occurrences in the Indian Ocean
around the Cilacap region (Source: ITDB/WLD, 2007) 17
3.1 The disaster management cycle and remote sensing contributions 19
3.2 The potential of vegetation on reducing tsunami impact in
Pangandaran (Source: Latief and Hadi, 2007)) 26
3.3 Observation pictures from the effect of tsunami 2004 in Nias
Island and Simeulue (Source: Kongko, 2005) 27
3.4 Effects of forest width and density to tsunami reduction
(source: Harada and Kawata, 2004) 28
3.5 Examples of photograph matching (Source: Brisbane city
council, 2003) 30
2006)
40
3.9 The smoothing process of pycnophylactic interpolation until 25 iterations (Source: National Center for Geographic Information and Analysis University of California Santa Barbara based on
Tobler, 1979) 42
3.10 Fundamental approaches to population distribution mapping,
modified from Sleeter and Gould (2007) 44
3.11 Population distribution maps: the LandScan (left), and CIESIN
population grids (right) 50
4.1 The steps of surface roughness classification using optical
satellite imagery 70
4.2 Confusion matrix accuracy assessment calculation (modified
from Congalton and Green, 1999) 76
4.3 The 16 reliable source models of hypothetical tsunamis. Sc.11
is the worst case source 79
4.4 Locations of point samples to analyze the influence of difference
roughness classes on tsunami flow-depth and velocity 80
4.5 Synthetic example of the disaggregation method used to
improve the spatial population data 82
4.6 The boundary effect problem in the population distribution 84
4.7 Potential number of people engaged in different land use
activities during the day- and night-times in the village 86
4.8 Multi-scale disaggregation concept to provide the population distribution in west coast of Sumatera, south coast of Java and
Bali 89
4.9 The steps of settlement classification by using TerraSAR-X 92
4.10 The threshold decision for potential settlement and real
settlement 93
4.11 Illustration the neighbourhood analysis for settlement classification (a) real settlement detection (b) potential settlement and (c) the settlement mask by neighbourhoods a
kernel size of 3 x 3 pixels 94
TerraSAR-X Cilacap 1 (24 January 2009); (e) TerraSAR-X Cilacap 2 (04 February 2009); and (f) TerraSAR-X Cilacap 3 (15
February 2009) 96
5.2 Land use data collection in difference scales (1:100,000 scale in the red box, 1: 50,000 scale in the pink box, and 1: 25,000
scale in the yellow box.) 97
5.3 Statistical data on population distribution at the village level for
the entire coast of Sumatra, Java and Bali 98
5.4 Example of land cover reference polygons for the accuracy
assessment of the surface roughness classification 99
5.5 The reference data for settlement classification, Cilacap (left)
and Padang (right) 100
5.6 The surface roughness classes and their relation to the tsunami
protection probability (from very low to high) 104
5.7 Result of the spatial enhancement of a SPOT-5 scene (right), based on a multi-spectral (left) and panchromatic imagery
(middle) 105
5.8 Results of image variable calculation of a SPOT-5 scene based
on NDVI (left), SNDVI (middle) and ENDVI (right) 105
5.9 Result of textural analysis of a SPOT-5 scene: panchromatic
imagery (left) and the texture imagery (right) 106
5.10 The decision tree model for main land use classification 109
5.11 The result of decision tree classification of SPOT-5 data for main
land use classes 110
5.12 Surface roughness classification in Cilacap District 112
5.13 Difference of tsunami velocity based on different roughness conditions: uniform roughness coefficient (top), spatially
distributed roughness values (low) 114
5.17 The result of population distribution modeling for day- and night-time (lower left and right), based on dasymetric mapping census data (top left) and land use as ancillary data (top right)
for Cilacap District 118
5.18 Population distribution based on the administrative boundary only (left) and the improved population distribution, with boundary effects (middle) and without boundary effects (final
result, right) 119
5.19 Distribution of potential number of people engaged in different land use activities in villages in the west coast of Sumatra, the
south coast of Java, and Bali 120
5.20 Average of coefficient of variation (%) of potential number of people engaged in different land use activities by the category of village (above) and those distributions for settlement
(bottom) 122
5.21 Generalized weighting factor for day-time population
distribution 124
5.22 Generalized weighting factor for night-time population
distribution 125
5.23 The percentages of people carrying out activities inside and outside their villages in Cilacap in the day-time; and (b) the percentages of the different commuter categories carrying out
activities outside their villages 127
5.24 RMSE error of population distribution in Cilacap for various land
use classes, based on an accuracy assessment 128
5.25 Error comparison of three models for population distribution 129
5.26 Result of population distribution in the broad scale area — the west coast of Sumatra, the south coast of Java, and Bali —
after applying the multi-scale disaggregation method 130
5.27 TerraSAR-X image intensity (left) and after speckle divergence
analysis (right) 131
5.28 Settlement classification results and real settlement by using
TerraSAR-X (see chapter 4.4.1) 132
5.29 Result of speckle divergence and neighborhood analysis for
settlement detection by using TerraSAR-X on Cilacap District 133
6.1 Image before (a) and after (b) tsunami from LANDSAT TM 140
6.2 Transformation of NDVI by (a) sigmoid and (b) exponential function 141
6.3 The histogram samples of NDVI for three vegetation classes
(tree, shrubs, and crop field) 141
6.4 The heterogeneous patterns of land use in the study area: (a)
tree and shrub; (b) crop field and shrubs 142
6.5 Potential additional of people in the Cilacap District (red
represents the high potential additional of people due to
infrastructural facilities) 147
6.6 Example showing the additional number of people in villages based on The sum of the commuters (here, 80 people) within
the municipality 148
6.7 Examples of settlements in the rural area of Cilacap District
(settlements surrounded by vegetation) 149
7.1 Tsunami inundation maps for Padang District based on (a)
uniform roughness and (b) spatially distributed roughness 151
7.2 Tsunami hazard maps for Kuta, Bali 152
7.3 Human exposure maps of Kuta, Bali for day-time population 153
7.4 Number of exposed people in the hazard zone and changes
during the day- and night-time 154
7.5 Evacuation time map for major warning tsunami in Bali (Source:
Strunz et al., 2010) 155
7.6 A Planning map recommendations for the need of tsunami
evacuation buildings (Source: Strunz et al., 2010) 156
7.7 Integration of key parameters of risk assessment into the
3.1 The relation between tsunami intensity and tsunami damage 25
3.2 Methods of roughness coefficient estimation (modified from
Sellin et al., 2003) 29
3.3 Roughness coefficients for different land use/cover classes in
several research publications 31
3.4 The roughness coefficient estimation by Koshimura et al.
(2009) 32
4.1 Data requirements for the research 67
4.2 Analysis of image variables 73
4.3 Steps of the semi-automatic classification 75
4.4 Population error matrix based on information of classified and
reference land use (LU) data 75
4.5 The numerical parameters of tsunami model 77
4.6 The reliable source models of hypothetical tsunamis 78
5.1 Compilation of all data used in this research 101
5.2 The roughness coefficients assigned to surface roughness
classes based on literature review 103
5.3 The accuracy of SPOT-5 data image variables to classify the main classes of surface roughness by using a decision tree
model 107
5.4 The accuracy of decision tree model by using relevant SPOT-5 variable (four spatially enhanced spectral bands of SPOT-5,
NDVI, and Texture) 108
5.5 Accuracy assessment of remote sensing classification for main
land use roughness (number of pixels) 111
5.6 Accuracy assessment of the remote sensing classification of
surface roughness classes 113
5.7 The classification accuracy resulting from a standard maximum
likelihood approach 113
5.8 Details of coefficient of variation (%) of potential number of people engaged in different land use activities by the category of village
between the generalized weighting factors from the model and
the reference values from the questionnaire results 126
5.10 Accuracy assessment of speckle divergence and neighborhood
analysis for Cilacap District 132
5.11 Accuracy assessment of speckle divergence and neighborhood
CHAPTER 1: INTRODUCTION
1.1.Motivation
The devastating Sumatra earthquake of 26 December 2004 was the second largest ever detected rupture in the Earth’s crust. Only a few minutes after its detection, the first tsunami waves hit the coastlines of northern Sumatra and some time later, Malaysia, Thailand, Sri Lanka, India and Somalia were also affected. Due to the location of the earthquake epicenter, Aceh Province, Indonesia, complained of the largest number of casualties and damages.
This tremendous disaster caused about 230,000 deaths and initiated – in addition to major relief efforts – intensive tsunami research and the emerging need for tsunami early warning systems that would mitigate tsunami impact.
Based on these geological conditions and historical data, Indonesia is a highly susceptible region to tsunami hazards. At the same time, its population is increasingly growing in the coastal areas. In particular, the islands of Sumatra and Java have experienced a tremendous population growth since the 1970s. Java is well known for being the most populated areas in the world. Due to these conditions, a strategy on mitigating the consequences of a tsunami impact is strongly required.
Risk assessment plays an important role in designing strategies for disaster risk reduction and disaster response. Knowledge about exposed elements, and their susceptibility, coping and adaptation mechanisms is a precondition for the development of people-centered warning structures (Post et al., 2008).
Overall, risk assessment has two dimensions:
the hazard assessment;
the assessment of vulnerability.
Both components have a significant influence on the level of tsunami risk and provide the basis for the tsunami risk assessment.
Since the consideration of surface roughness in tsunami research is very limited, the first part of this thesis is devoted to research on how to describe the relevant surface roughness class to tsunami inundation modeling and to elaborate a concept for a roughness classification based on medium- and high-resolution satellite imagery.
Vulnerability assessment as the second dimension of risk assessment plays a crucial role in tsunami disaster reduction strategies. Vulnerability can be defined as “The conditions determined by physical, social, economic, and
environmental factors or processes which increase the susceptibility of a
community to the impact of hazards” (ISDR, 2004). With respect to this
definition, vulnerability is trans-disciplinary and multi-dimensional, covering social, economic, physical, political, engineering and ecological aspects and dimensions (Post et al., 2009). Detailed and up-to-date information on population distribution in the potential hazard zone is the most important factor in mitigating the impact of natural disasters, e.g. by evacuation planning.
The available information about population distribution is mostly based on statistical data and is related to administrative boundaries, such as village, municipal, district, province and national borders. In most countries and also in Indonesia, population distribution data are available for villages as the smallest administrative level. However, for an efficient disaster management, it is essential to have a good insight into the spatial distribution of the population at risk. The available census data on the village level are too coarse for a planning process at the local level. The question then is: How can population data in census districts be disaggregated to smaller geographical or mapping sectors that better satisfy the demands for information for emergency actions and disaster mitigation management? (Hofstee and Islam, 2004).
and local-scale assessment related to different levels of tsunami disaster management. Results and conclusions from this part seek to provide key information for effective warning and evacuation planning, and will be implemented in the tsunami risk and vulnerability assessment framework.
A key parameter in disaggregating population data based on a dasymetric mapping approach (see chapter 3) is the availability of comprehensive, detailed and up-to-date land use data, which is always a problem, especially in large and fast developing countries like Indonesia. Previous research has demonstrated the potential of remote sensing in mapping settlement areas. With the availability of high-resolution synthetic aperture radar (SAR) sensor systems, e.g. of the German TerraSAR-X Earth observation satellite, new opportunities of settlement mapping are available. SAR systems are capable of acquiring data at day and night, independently of weather or environmental conditions. Hence, sophisticated and efficient methodologies for settlement classification using TerraSAR-X are needed for the mapping and updating of land use and settlement areas.
In the third part of the thesis, current research findings of settlement detection using TerraSAR-X will be reviewed. Methods will be further developed or improved and applied to coastal areas in Indonesia. The research findings shall contribute to assessing risk and vulnerability before an expected disastrous tsunami event, in coordinating emergency actions during an event, or in managing disasters after the event.
Risk assessment aims at revealing the two dimensions of hazard and vulnerability assessment, and at deducing options for action related to adaptation and mitigation measures. This research focuses on the development of new methodologies based on remote sensing and GIS techniques, which shall help to provide improved geo-spatial data contributing to reduce tsunami risk at coastal areas of Indonesia and to cope with inevitable tsunami impact.
1.2. Research Questions
a) Surface roughness determination
1. How can surface roughness be appropriately described and quantified in order to be used in tsunami inundation modeling and hazard assessment?
2. How can surface roughness parameters be derived by remote sensing? 3. How can the derived surface roughness parameters be integrated into
tsunami modeling and hazard assessment?
b) Population distribution modeling
1. How can adequate population distribution data be derived or be spatially improved based on available statistical data?
2. Is it possible to derive further information about the spatial and temporal changes, especially the different population distribution during the day- and night-time?
c) Settlement classification using remote sensing
1. How can settlement areas be efficiently mapped using remote sensing technologies?
1.3. Research Objectives
Based on the above research questions, the research objectives are as follows:
a) Surface roughness determination
1. Determine an appropriate surface roughness parameterization for tsunami inundation modeling and hazard assessment.
2. Determine day and night population distribution by modeling and integrating socio-economic factors into the developed approach.
3. Analyze the transferability and accuracy of the developed population distribution model.
c) Settlement classification using remote sensing
1. Further develop and improve methods for the determination of settlement areas with a focus on SAR remote sensing data.
1.4. Research Benefits
This research results shall contribute to tsunami risk mitigation and reduction at coastal areas in Indonesia. By integrating this research into the risk and vulnerability assessment of the German Indonesia Tsunami Early Warning System (GITEWS) project, a concerted focus on decisive research needs in the tsunami context is ensured. Major benefits of this research are:
the development of new remote sensing methods and GIS models;
contribution to the risk and vulnerability assessment of the German Indonesia Tsunami Early Warning System (GITEWS) project and the tsunami disaster management in Indonesia;
remote sensing-based mapping of surface roughness and derivation of settlement areas as a crucial contribution to tsunami modeling and hazard assessment;
an improved and automated approach for population distribution modeling based on GIS approaches as input for vulnerability analyses;
contribution to evacuation planning and disaster risk reduction.
1.5. Thesis Structure
This thesis consists of eight chapters.
Chapter 2 provides the research framework. It shows the contribution of the research in the context of the GITEWS project and within the risk and vulnerability assessment part. All research components are clearly represented and described in this chapter in order to point out the coherent structure of the thesis. Finally, all research topics are linked to the respective study area, and relevant spatial conditions are explained in detail.
Chapter 3 explains the current status on roughness coefficient determination and classification research, the research development on population distribution modeling by using remote sensing and GIS, and the current status of remote sensing settlement classification research. It explains the current gaps in this specific field of research.
Chapter 4 explains the data required the various steps in the research process, and the approach to answer the research questions. It concretizes the objectives of this research.
Chapter 5 shows result of data collection, the research findings on the surface roughness and its coefficient estimation, the improvement on surface roughness classification by remote sensing, the improvement on population distribution modeling, and the results of settlement classification.
Chapter 6 discusses and interprets these research findings with respect to the state of the art of the research. It also discusses the implication of the results in the practical/theoretical aspect of this thesis.
Chapter 7 explains the application of the research, the integration of its results on the tsunami modeling, and the risk and vulnerability assessment.
CHAPTER 2: RESEARCH FRAMEWORK
This research is part of the risk and vulnerability assessment within the German Indonesian Tsunami Early Warning System (GITEWS) project. It contributes to three major components of the project: (1) the provision of spatial information on surface roughness as an important parameter for tsunami inundation modeling and hazard assessment; (2) the modeling of population distribution, which is an essential factor in tsunami vulnerability assessment and local disaster management activities; and (3) the settlement detection and classification from remote sensing radar imagery to support the population distribution research.
Detailed explanations of the GITEWS framework, the risk and vulnerability framework, research elements and the study area are stated below.
2.1. GITEWS Framework
The GITEWS project is a research collaboration between the Federal Ministry of Education and Research (BMBF) of Germany and the Indonesian Ministry of Research and Technology (RISTEK), aimed to develop an effective tsunami early warning system for Indonesia. The Joint Declaration of BMBF and RISTEK was signed on 14 March 2005. Its concept integrates terrestrial observation networks of seismology and geodesy with marine measuring processes and satellite observation. Several German and Indonesian institutions are involved and work together to set up end-to-end early warning system, which also contains the capacity-building provision for Indonesian institutions. The system itself was successfully launched on 11 November 2008 by the Indonesian President. The overall concept of the project is shown in Figure 2.1.
2.2. Risk and Vulnerability Framework
Risk management serves as a general guideline for developing disaster preparedness and adaptation strategies based on a continuous strategy of risk and vulnerability assessment (ISDR, 2004). This implies that risk and vulnerability assessment is an integral part in the development of an effective end-to-end early warning system, which significantly contributes to disaster risk reduction to low-frequency but extreme events like tsunamis.
Risk and vulnerability assessment in the GITEWS context contributes to two main tasks:
enhancing crisis management capacities (e.g. emergency assistance) during an early warning scenario;
developing disaster risk reduction strategies such as adaptation and mitigation measures (e.g. evacuation and land use planning).
The BBC framework has been adopted in order to implement effective early warning disaster response and recovery (see Figure 2.3). It shows the importance of addressing the potential intervention tools that could help to reduce vulnerability in the social, economic and environmental spheres. The framework integrates social, economic and environmental aspects into the vulnerability assessment, thus reflecting the “three pillars” of sustainable development (Birkmann, 2006).
The risk and vulnerability assessment within GITEWS mainly focuses on vulnerability and risk factors of people exposed to tsunami hazard, in terms of loss of life, injury and loss of livelihood. Accordingly, the GITEWS vulnerability assessment aims at developing socio-economic indicators and assessment tools for the continuous improvement of intervention tools, such as early warning communication, evacuation planning, disaster response and rehabilitation. Regarding the BBC-framework, the risk and vulnerability assessment in the GITEWS project is translated into a coherent conceptual model, integrating the above-mentioned aspects.
e.g. Emission control
e.g. Insurances
e.g. Land use changes
Social sphere Economic risk Environmental risk Social risk
Vulnerability reduction (t=0)
Preparedness
Disaster/emergency management Vulnerability reduction (t=1) e.g. Early warning Event HAZARD Economic sphere Environmental sphere Risk reduction INTERVENTION SYSTEM Natural phenomena Fragile and exposed
elements capacityCoping
VULNERABILITY RISK FEEDBACK e.g. Emission control e.g. Insurances
e.g. Land use changes
Social sphere Economic risk Environmental risk Social risk
Vulnerability reduction (t=0)
Preparedness
Disaster/emergency management Vulnerability reduction (t=1) e.g. Early warning Event HAZARD Economic sphere Environmental sphere Risk reduction INTERVENTION SYSTEM Natural phenomena Fragile and exposed
elements capacityCoping
VULNERABILITY RISK
FEEDBACK
The aim of the hazard assessment is to achieve a better understanding of tsunami and the potential impacts on society in order to enable local and national decision-makers and other stakeholders to become better prepared for future tsunami events. In case of a tsunami, the decision whether a region should be warned requires sound information on the hazard zone and expected impact, on the spatial distribution of exposed population and on critical infrastructures. The immediate response component is represented by analyzing people’s ability to receive and understand a warning, their decision to evacuate and their capability to do so. Here, mainly socio-economic indicators are relevant that describe the intrinsic social properties of the population exposed to tsunamis.
The component recovery is not directly linked to the early warning chain, but rather to the post-disaster management phase, since it deals with developing vulnerability indicators for disaster relief and rehabilitation aspects in the aftermath of a tsunami disaster. Hence, vulnerability assessment comprises information on the number of people exposed, critical facilities and immediate response capability. The vulnerability information is then combined with the hazard information based on the decision tree logic to calculate the overall tsunami risk (Post et al., 2008).
2.3. Research Contributions to Tsunami Risk Assessment
As highlighted in Figure 2.4, this research contributes to the hazard and exposure component in order to provide decisive input parameters for tsunami risk assessment.
Detailed information about surface roughness is indispensable for tsunami inundation modeling and hazard assessment as a precondition for calculating the exposed population of the coastal areas. The surface roughness parameters derived in this thesis will be implemented accordingly in the risk and vulnerability framework above.
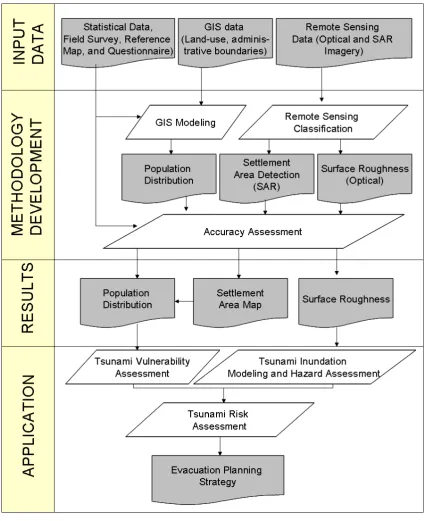
Key elements in this research are Remote Sensing (RS) and Geographical Information Systems (GIS) (see Figure 2.5).
Remote sensing data are the precondition for determining surface roughness and settlement detection. In this research, both optical and radar sensors are used. Optical, multi-spectral SPOT 5 data were used for roughness coefficient classification, while TerraSAR-X radar data were used for settlement classification.
GIS modeling was applied for processing and analyzing population data. A dasymetric mapping concept was developed by combining available census data and ancillary data such as land use in order to improve the spatial population distribution. Statistical data, field survey results, reference maps and questionnaires were used to validate the gained modeling results. GIS technology provides efficient tools for the combination and analysis of different input data and is an essential working basis in this research. An accuracy assessment was conducted to check the quality of the GIS modeling and remote sensing classification techniques. As shown in Figure 2.5 and mentioned above, quality controlled results are implemented in the respective parts of the GITEWS risk and vulnerability assessment.
2.4. Study Area
The GITEWS risk and vulnerability assessment is conducted at two scales: at the broad scale and at the local level, each fulfilling a different purpose.
While the broad-scale assessment provides products in the context of early warning for an entire exposed coastal zone, the local assessment aims at contributing to the development of local, specific disaster preparedness, adaptation and mitigation strategies (e.g. urban planning and evacuation planning for priority areas).
Figure 2.6 The research study area, Cilacap as pilot region (below) and the broad scale area (above) for the implementation of population distribution
Cilacap was selected as a pilot region in this research for the following reasons:
A great number of people are living or working near the beach, mostly in the agriculture, fisheries and tourism sector.
In addition to Padang and Bali, Cilacap is a GITEWS pilot area, and therefore, the results of this research strongly support project needs.
2.4.1. Geographic and socio-demographic characteristics
Cilacap is the largest district in the Province of Central Java, Indonesia. The area of Cilacap region covers about 225,000 ha, and consists of 24 municipals (BPS, 2005). Cilacap city lies between 108º4'30"-109º30'30" East and 7º30'00”-7º45'20" South; it bordered by Banyumas District in the north, Kebumen District in the east, Ciamis District in the west, and the south part of this region directly faces the Indian Ocean.
Based on BPS data, the number of registered people in 2005 is approximately 1.7 million, with an average growth rate of 0.52% per year. The average population density in Cilacap is about 803 people per km2.
Most employees in Cilacap District work in the agriculture sector followed by the services, trade, industry and transportation sectors (BPS, 2005). The main source of income in Cilacap is from the agriculture sector.
2.4.2. Land use structure
The variation of land use conditions in Cilacap District is high. In the west part of this district, there is Nusakambangan Island, with a hilly surface and very dense vegetation. The center part of Cilacap District is characterized by a varied settlement structure with high, medium and low density, surrounded by rural landscapes such as cropland and plantation. The flat area is crossed by various rivers and interrupted by small hilly zones.
2.4.3.Tsunami exposure
The coastal area of Cilacap is directly exposed to the Indian Ocean. Due to tectonic and bathymetric conditions, elevation on land and the recorded historical earthquake and tsunami events, the region of Cilacap is prone to tsunami hazard (see Figure 2.7).
(ITDB), between 1859 and 2007, four tsunamis and 289 earthquakes with moment magnitudes of more than 5 were detected around the Cilacap region. Based on Indonesian National Coordinating Agency for Disaster Management (BAKORNAS PBP) 2006, the 2006 Tsunami with a moment magnitude (Mw) of 7.7 killed around 650 people, injured around 520 people, and around 30 people are missing in this area and caused a lot of damage and economic loss. The event affected Ciamis, West Java (Pangandaran), Cilacap and Kebumen Districts, up to the famous beach in Yogyakarta, Parangtritis. In the district of Cilacap alone, 157 people were killed, 10 were missing, and 10 were injured in Adipala, Binangun, and Nusawungu (BAKORNAS PBP, 2006). The strongest recorded earthquake was in 1943, with a moment magnitude (Mw) of 8.1; however, no tsunami was reported.
CHAPTER 3: STATE OF THE ART OF RESEARCH
This chapter is designed to analyze the current status on research and development on surface roughness determination, population distribution mapping, and settlement classification. The current status is critically described and needs for further research works are identified.
In the first sub-chapter, a review of the current status of research on the application of remote sensing and GIS in the field of vulnerability and risk assessment as well as remote sensing classification techniques is given.
In the second sub-chapter, the current status of research on surface roughness in relation to tsunami flow resistance is reviewed. It provides an overview of the factors affecting flow resistance and illustrates how vegetation is one important factor. The role of vegetation and its characteristics to reduce tsunami impact, the analysis of surface roughness, including the use of remote sensing techniques, and the estimation of surface roughness coefficients are explained.
The third sub-chapter summarizes the current status of research on the application of remote sensing and geographical information systems (GIS) in the field of population distribution modeling. Top-down and bottom-up approaches are explained.
The fourth sub-chapter describes the current status of research on settlement classification using remote sensing data. The chapter includes optical as well as SAR imagery applications, and the fusion of both kinds of data.
3.1. Remote Sensing and Tsunami Risk and Vulnerability
3.1.1.Overview
For almost 40 years, remote sensing has been used for monitoring the Earth’s surface, its conditions and changes. In the field of disaster management, in particular, remote sensing can help to analyze areas that are prone to natural and man-made hazards and potential damages. Risk and vulnerability assessments are an important part of disaster management and can be supported by remote sensing for pre-disaster analyses.
Regarding tsunami risk and vulnerability assessment and modeling, remote sensing techniques have been used for the following applications throughout the disaster cycle (see Figure 3.1):
Damage assessment and rapid mapping to support the emergency response phase immediately after a disaster has occurred
Contributions to vulnerability and risk assessment in the pre-disaster phase by deriving relevant information such as land use, settlement areas and buildings, elevation, etc.
Monitoring of reconstruction and rebuilding in the post-disaster phase.
3.1.2.Damage assessment
Shortly after the Indian Ocean Tsunami 2004, high-resolution images acquired before and after the tsunami and damage assessments based on such images had been released to the relief organizations and centers. This was very helpful to describe the impact and extent of tsunami occurrence, for example, in Banda Aceh. It showed that remote sensing data is useful for disaster analysis; its application is not limited to tsunami disasters, but also for other kinds of natural and man-made disasters such as floods, landslides, forest fires and oil spills.
In general, there are two main goals using remote sensing data for analyzing damage: rapid mapping assessment (e.g. Belward et al. 2007) and mapping the affected hazard impact zone (e.g. McAdoo et al. 2007; Iverson and Prasad, 2007; Chatenoux and Peduzzi, 2007). The latter is very important in risk and vulnerability assessment in order to know the important parameters for tsunami hazard mapping. For example, the tsunami run-up is influenced by the topography of a region (McAdoo et al. (2007), the geomorphologic conditions, mangroves, and coral reefs influenced the characteristics of the tsunami inundation in Aceh (Chatenoux and Peduzzi, 2007), and the landscape analysis is used to model the tsunami damage in Aceh Province (Iverson and Prasad, 2007).
The damage assessment research is vital for improving the tsunami hazard mapping, and for analyzing what kinds of parameters influence the tsunami run-up and inundation. The role of vegetation on tsunami impact was examined through the analysis of the damaged areas by remote sensing and GIS, (e.g. Danielsen et al. (2005), Parish and Yiew (2005), Chang et al. (2006) and Olwig
et al., 2007).
3.1.3.Derivation of relevant information for risk and vulnerability
Moreover, the development of remote sensing technology has the potential to identify and assess objects, even on a detailed scale, e.g. the condition of buildings. The direct assessment of the vulnerability of objects such as buildings is not possible (e.g. Mueller et al., 2006). However, relevant parameters can be derived from remote sensing data, which can be used as input for vulnerability assessment as well as to identify buildings for potential vertical evacuation as a basis for developing an appropriate evacuation planning strategy.
Another important component that can be derived from remote sensing data, especially for tsunami and flood hazard mapping, is surface roughness condition. Several studies have been undertaken; this issue is addressed in detail in chapter 3.2.
3.1.4.Monitoring of reconstruction and rebuilding in the
post-disaster phase
Remote sensing data is also used to monitor the progress of post-disaster environmental and infrastructure rebuilding activities in a cost-effective manner (Friesecke, 2006). An example of this application was shown by Shofiyati et al. (2005), who assessed the land use damaged by the Indian Ocean Tsunami 2004 for Aceh, Indonesia, especially in agriculture. The information was used for soil reclamation and spatial planning in the coastal area. Another application was shown by Adams et al. (2004), who developed a remote sensing technique to monitor the reconstruction of buildings collapsed during earthquakes in Boumerdes, Algeria, and Bam, Iran.
Both studies demonstrated the effectiveness of using remote sensing data for the monitoring of reconstruction and rebuilding activities in a disaster-damaged area. Remote sensing can thus significantly support disaster management activities in the recovery phase of the disaster cycle (Figure 3.1).
3.1.5.Remote sensing classification techniques
Remote sensing classification has made great progress over the past decades mainly in the following three areas (Lu and Weng (2007):
development of advanced remote sensing classification techniques;
integration of multiple remote-sensing features in the classification process;
integration of ancillary data and knowledge into the classification procedures.
Conventional methods such as the maximum likelihood classification to the more advanced object-based classification have been used and developed with great success. This advancement is in line with the progress of remote sensing sensor technology that led to high spatial resolution to below 1 m. Object-based image classification, for example, was developed for high resolution image classification (e.g. Blaschke, 2009). From this comprehensive literature review it can be concluded that this methodology represents a significant trend in remote sensing and GIS science. In contrast, in low- and medium- resolution remote sensing data such as NOAA AVHRR and MODIS, one pixel usually contains several objects of the earth surface and heterogeneous information (mixed pixels). Spectral mixture analysis (SMA) was recognized as an effective method for dealing with the mixed pixel problem (Lu and Weng, 2007).
The integration of multiple remote sensing features including spectral, spatial, multi-temporal, and multi-sensorial information are important for improving the classification accuracy. One example of this application is data fusion of multi-spectral and panchromatic bands (“pan-sharpening”). Using multi-temporal imagery is another useful method to classify objects such as water, bare land or paddy field. As well known, paddy fields have three important phases: the water phase, the vegetative phase and the bare phase. By using a single image, a paddy field in the water phase will be classified as water, or in the vegetative phase, as vegetation. The use of multi-temporal imagery can improve the classification results of such features (e.g. Xiao et al., 2006). Hyper-spectral data can help to classify objects in more detail due to narrow spectral bands. As a result of specific spectral properties, it is possible to distinguish between different types of vegetation, phytoplankton in the ocean, and soil (e.g. Belluco et al., 2006).
data to monitor mangrove forest changes with decision tree learning. They demonstrated that the use of the decision tree method on a combined dataset of multi-temporal Landsat TM Images and GIS data can be effective in delineating spatial and temporal distribution of mangrove forest. Moreover, classification accuracy can also be increased by including human knowledge, or “knowledge-based classification” (e.g. Hung and Rid, 2002; Judex et al., 2006).
3.1.6.Summary of remote sensing and tsunami risk and
vulnerability
Remote sensing methodologies are useful during all phases of the disaster cycle (Figure 3.1), especially for damage assessment, mapping of risk-relevant information and monitoring of post-disaster reconstruction and rebuilding. For these applications, the choice of an appropriate remote sensing classification technique is important to achieve adequate accuracy of the results.
There are still open issues and challenges in improving these techniques for several purposes, namely, for determining the surface roughness condition, the population distribution, and the settlement classification. Hence, sections 3.2 to 3.4 will review the state of the art of these components in order to assess in detail the pending issues of current methods and necessary improvements.
3.2. Surface Roughness Determination
3.2.1.Overview
Surface roughness can be defined as the smoothness and coarseness of the earth’s surface related to water flow resistance. Smooth earth surfaces, such as open land and water, have low resistance, and coarse earth surfaces, such as dense vegetation and dense residential area, have high resistance. In tsunami inundation and flood modeling, water resistance is described by a roughness coefficient; Manning’s roughness coefficient is the most widely used.
k is a factor to keep the equation dimensionally correct (m1/3 s-1)
n is the roughness coefficient (independent of units)
R is the hydraulic radius (m)
S is the slope of the water surface or the linear hydraulic head loss (dimensionless).
In applying Manning’s roughness formula, the greatest difficulty lies in determining coefficient n, since there is no exact method of selecting the n
value (Chow, 1959). The estimation of the surface roughness coefficient will be further discussed in sub-chapters 3.2.3. Before that, the factors affecting the roughness coefficient shall be first described.
Cowan (1956) formulated as follows:
m
n
n
n
n
n
n
(
0
1
2
3
4)
(3.2)Where:
n is the roughness coefficient
n0 is a basic n value for straight, uniform, smooth channel in the
natural material involved
n1 is a value added to n0 to rectify the surface irregularity
n2 is a value for variation in shape and size of the channel cross
section
n3 is a value for obstruction
n4 is a value for vegetation condition
m is a correction factor for meandering channel.
This formula was developed for flood modeling of channel and river flow. For tsunami events that struck lowland coastal areas, it could be modified as suggested by Morin et al. (2000):
2 4 2 0 2
n
n
n
(3.3)3 / 4 2 0
*
100
*
2
gd
D
C
n
n
d
(3.4) Where:n is the roughness coefficient
n0 is the roughness value due to land use except building
is the building/house occupancy ratio in the computational grid (23 m) Cd is the drag coefficientd is the horizontal scale of houses measured by using GIS D is the modeled flow depth
g is the gravitational acceleration constant.
Based on these formulas, the two main components affecting the roughness coefficient are vegetation and building conditions. Regarding building condition, it is obvious that building density is the most important characteristic. For vegetation, some further analysis is needed, and thus, the following section is dedicated to exploring the role of vegetation and its characteristics in reducing tsunami impact.
3.2.2.The role of vegetation on reducing tsunami impact
Several studies showed that vegetation could contribute to protecting coastal areas against tsunami waves (Kathiresan and Rajendran, 2005; Vermat et al.,
Table 3.1 The relation between tsunami intensity and tsunami damage Tsunami
intensity 0 1 2 3 4 5
Tsunami wave height (m)
1 2-3 4-7 8 16 32
Coastal control forest
Mitigates damage, stops drafts, and mitigates tsunami
There is only partial
damage and stop drafts
There is complete damage, no reduction effect
Source: Harada and Kawata (2004)
In the case of the 2006 Tsunami in west Java, which had lower wave heights (4-10 m), the vegetation proved its ability to protect buildings near the coast (see Figure 3.1). High-resolution satellite imagery acquired before and after the tsunami in west Java shows that houses with no vegetation protection were completely destroyed, while houses with vegetation protection were only slightly damaged. Figure 3.2 shows that the vegetation was able to resist the tsunami flow and decrease the tsunami energy, and hence the building behind the vegetation has been only slightly damaged.
The photographs in Figure 3.3 show additional examples of the protective role of vegetation in reducing the hazard impacts of the Indian Ocean Tsunami 2004 (Kongko, 2005). The left photo shows an example of the west coast of Simeuleu Island, where some houses built of wooden material (houses A) were saved from the tsunami’s destructive force due to protection by a dense coconut tree zone of approximately 10 m width. There used to be a similarly built house not far from this location (B), which had no protective vegetation and was completely destroyed. The right photo shows houses built of bamboo material in Muawe-Lahewa (northern Nias Island), which was protected from the tsunami impact by dense mangrove forest.
West Coast of Simeulue Island Muawe-Lahewa North Nias Island Figure 3.3 Observation pictures from the effect of tsunami 2004 in Nias Island and Simeulue (Source: Kongko, 2005)
These examples clearly show the potential of vegetation to reduce tsunami impact, but there is a need to investigate the specific characteristics of potentially protective vegetation. The characteristics of coastal vegetation that play a protective role include width, density and structure of vegetation.
Figure 3.4 Effects of forest width and density to tsunami reduction (Source: Harada and Kawata, 2004)
Moreover, Tanaka et al. (2007) analyzed coastal vegetation structures and their functions in tsunami protection in Sri Lanka and the Andaman coast of Thailand. By field measurement, they analyzed the effectiveness of vegetation structure in providing protection from tsunami damage. This research showed that the neighborhood of vegetation types is an important factor regarding tsunami impact reduction. For example, both Casuarina equisetifolia and
Pandanus odoratissimus have only little effect on reducing tsunami impact, but in a combined association of both plant species, the effect is strong.
3.2.3.Estimation of the surface roughness coefficient
Several studies on roughness coefficient estimation have been undertaken (e.g. Chow, 1959; Arcement and Schneider, 1989; Jarvela, 2005). The applied methodologies can be grouped into four categories:
Laboratory experiments
Site visit and photo matching
Use of roughness coefficients from published research
A combination of these methods.
Table 3.2 gives an overview of these methodologies and summarizes the data requirements as well as the advantages and disadvantages of each method.
Table 3.2 Methods of roughness coefficient estimation (modified from Sellin
et al., 2003)
Method Data required Advantages Disadvantages
Laboratory
experiments The drag coefficient, sufficient water velocity scenario, and appropriate surface roughness miniature. The most accurate method for flexible surface roughness.
Only applicable to static surface roughness conditions. Each variation of the conditions requires costly recalibration. Site visit and
photo matching Site visit and photographs. Quick and widely used, gives an approximate figure for any condition.
Requires experience, no variation of water level.
Use of roughness coefficients in published research
A roughness classes table with roughness
coefficient values.
Systematic,
familiar. Apparent accuracy is deceptive. A combination of
these methods A roughness classes table with roughness
coefficient values and formulas from laboratory
Systematic,
Laboratory experiments
In flood engineering, scientists assess the roughness coefficient usually by experimental research in laboratory and field survey studies. For example, Righetti and Armanini (2002) analyzed the flow resistance on sparsely distributed bushes; Jarvela (2005) investigated the flow resistance of natural vegetation; Wilson (2007) analyzed the flow resistance models for flexible submerged vegetation; and Wilson and Horritt (2002) analyzed the flow resistance models for flexible submerged grass.
This method is the most accurate approach in determining the roughness coefficient and also the conditions of vegetation or buildings can be modeled close to reality. Scenarios of water flow and velocity can be also undertaken to determine the appropriate roughness coefficient.
Site visit and photo matching
A very quick determination of the roughness coefficient is possible by site visit and photo matching. Arcement and Schneider (1989) outline an approach to match photographs and real conditions of a study area: several photographs are provided to guide people in estimating the roughness coefficient. The researcher’s experience is required in using this method. Brisbane City Council (2003) also provided several photos to estimate the roughness coefficient. Figure 3.5 shows examples of photographs and the corresponding roughness coefficient values.
Figure 3.5 Examples of photograph matching (Source: Brisbane city council, 2003)
Use of roughness coefficients from published research
Research based on laboratory experiments usually only measures a limited number of classes of surface roughness and in a costly manner. Sellin et al.
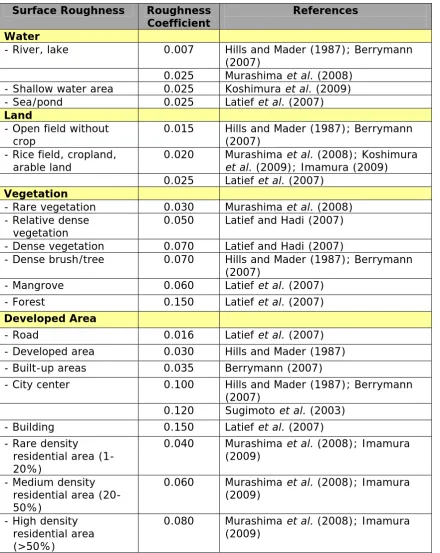
(2003) therefore suggest using published roughness coefficients such as by Chow (1959) and Arcement and Schneider (1989). However, the problem of this approach is the limited transferability and the inconsistency of published roughness coefficients. For example, Hill and Mader (1987) determined the roughness coefficient for lake, water, river and sea at 0.007 and for cropland or grazing land at 0.015, while Murashima et al. (2008) determined 0.025 for lake, water, river and sea, and 0.020 for cropland or grazing land. Table 3.3 shows examples of roughness coefficients from research publications.
Combination methods
Table 3.3 Roughness coefficients for different land use/cover classes in several research publications
Surface Roughness Roughness
Coefficient References
Water
- River, lake 0.007 Hills and Mader (1987); Berrymann (2007)
0.025 Murashima et al. (2008) - Shallow water area 0.025 Koshimura et al. (2009)
- Sea/pond 0.025 Latief et al. (2007)
Land
- Open field without crop
0.015 Hills and Mader (1987); Berrymann (2007)
- Rice field, cropland, arable land
0.020 Murashima et al. (2008); Koshimura
et al. (2009); Imamura (2009) 0.025 Latief et al. (2007)
Vegetation
- Rare vegetation 0.030 Murashima et al. (2008) - Relative dense
vegetation 0.050 Latief and Hadi (2007) - Dense vegetation 0.070 Latief and Hadi (2007)
- Dense brush/tree 0.070 Hills and Mader (1987); Berrymann (2007)
- Mangrove 0.060 Latief et al. (2007) - Forest 0.150 Latief et al. (2007)
Developed Area
- Road 0.016 Latief et al. (2007) - Developed area 0.030 Hills and Mader (1987) - Built-up areas 0.035 Berrymann (2007)
- City center 0.100 Hills and Mader (1987); Berrymann (2007)
0.120 Sugimoto et al. (2003) - Building 0.150 Latief et al. (2007)
- Rare density residential area (1-20%)
0.040 Murashima et al. (2008); Imamura (2009)
- Medium density residential area (20-50%)
0.060 Murashima et al. (2008); Imamura (2009)
- High density residential area (>50%)
Table 3.4 The roughness coefficient estimation by Koshimura et al. (2009)
Surface Roughness Class Roughness
coefficient
Methods
Smooth ground 0.020 Published research Shallow water area or
natural beach
0.025 Published research Vegetated area 0.030 Published research Populated area 0.045 Published research Dense populated area Equation 3.4. Equation developed in
laboratory experiments
3.2.4.Roughness coefficient in tsunami modeling
Researchers have studied the implementation of the roughness coefficients in the tsunami modeling, e.g. Dao and Tkalich (2007), who examined the sensitivity of tsunami propagation for the 2004 Indian Ocean Tsunami. Their results indicated that in shallow water, the roughness coefficient is an important parameter in the tsunami modeling. Lower roughness coefficients will significantly increase the tsunami wave.
Figure 3.6 The maximum run-up differences (m) by changing roughness coefficient (Source: Myers and Baptista, 2001)
Another study related to the effect of roughness coefficients on the tsunami modeling was published by Gayer et al. (2008), who analyzed the importance of the roughness coefficients in tsunami modeling. Gayer et al. (2008) revealed the importance of using spatially differentiated roughness maps. Similar to findings of Myers and Baptista (2001), the roughness coefficient was varied. A higher coefficient resulted in considerably reduced inundation area and water velocity.
conditions. Remote sensing data can provide information about the spatial distribution of surface roughness conditions and are thus a tool to fill this gap.
3.2.5.Remote sensing approaches for surface roughness
classification
For remote sensing applications on surface roughness classification, there are two main activities:
Mapping of the tsunami inundation area to empirically analyze the effects of surface roughness in order to reduce tsunami impact;
Classification of land use to derive surface roughness conditions related to tsunami or flood modeling.
For the first application, Chang et al. (2006) and Olwig et al. (2007) showed the potential of dense vegetation in Thailand and Indonesia to reduce the tsunami flow. Comparisons of pre- and post-tsunami satellite images provided information on inundated areas and the vegetation conditions at particular regions. The lesson learned from the remote sensing data show the reduction of tsunami flow by wood vegetation (Olwig et al., 2007), and mangroves (Chang
et al., 2006). Both studies showed the effect of surface roughness qualitatively on the tsunami reduction without a quantitative estimation of the roughness coefficient.
For the second application of surface roughness classification, a variety of studies have been undertaken using remote sensing data, such as ASTER (Chiang et al., 2004), IKONOS-2 (Van der Sande et al., 2003; Koshimura et al., 2009; SAR (Mason et al., 2009), Schumann et al., 2007), Landsat TM (Melese, 2003), airbone laser scanning (Straatsma and Baptist, 2008) and LIDAR (Murashima et al., 2008). Almost all of these studies classify the land use class by using conventional remote sensing classification techniques. The estimation of the roughness coefficients is based on published research results.
A new application of surface roughness classification by using remote sensing is introduced by Koshimura et al. (2009), which considers a density analysis. Their study indicates the importance of building density on roughness coefficient estimation, but it still does not consider neighborhood classes, which are a desirable improvement of the remote sensing classification technique for surface roughness classification. The study by Koshimura et al. (2009) is further limited by the methodology of classification used. The classification by visual interpretation and manual digitization is time-consuming and ineffective. It needs to be improved by automatic or semi-automatic classification.
3.2.6.Summary of surface roughness determination
3.3. Population Distribution Modeling
3.3.1.Overview
Research on population distribution with respect to remote sensing and GIS can be categorized into two categories: top-down and bottom-up approaches. Top-down approaches usually disaggregate global information to a detailed scale, whereas bottom-up approaches generate global information out of detailed scale information.
Top-down approaches use statistical data and disaggregate it spatially to derive the population’s distribution. To increase the spatial resolution, ancillary data such as land use are used. There are two main methods — spatial interpolation and dasymetric mapping.
Spatial interpolation disaggregates tabular data or statistic data to geospatially distributed information through various interpolation approaches.
Dasymetric mapping is used to redistribute the number of people in an administrative unit to smaller units by using ancillary data such as land use.
Figure 3.7 The top-down and bottom-up approaches on population distribution by using remote sensing and GIS
3.3.2.Top-down approach
Spatial interpolation
The main issue of spatial interpolation is the procedure of estimating the value of properties at unsampled sites within the area covered by existing observation. Spatial interpolation methods to be used for population distribution can be categorized in two groups: