Copyright1998 by the Genetics Society of America
Marker-Assisted Selection Efficiency in Populations of Finite Size
Laurence Moreau,* Alain Charcosset,* Fre´de´ric Hospital* and Andre´ Gallais*
,†* Station de Ge´ne´tique Ve´ge´tale (Institut National de la Recherche Agronomique, Universite´ Paris-Sud, Institut National Agronomique Paris-Grignon), Ferme du Moulon 91190 Gif Sur Yvette, France,
and†Institut National Agronomique Paris-Grignon, 75231 Paris Cedex 05, France Manuscript received January 21, 1997
Accepted for publication November 12, 1997
ABSTRACT
The efficiency of marker-assisted selection (MAS) based on an index incorporating both phenotypic and molecular information is evaluated with an analytical approach that takes into account the size of the experiment. We consider the case of a population derived from a cross between two homozygous lines, which is commonly used in plant breeding, and we study the relative efficiency of MAS compared with selection based only on phenotype in the first cycle of selection. It is shown that the selection of the markers included in the index leads to an overestimation of the effects associated with these markers. Taking this bias into account, we study the influence of several parameters, including experiment size and heritability, on MAS efficiency. Even if MAS appears to be most interesting for low heritabilities, we point out the existence of an optimal heritability (z0.2) below which the low power of quantitative trait loci detection and the bias caused by the selection of markers reduce the efficiency. In this situation, increasing the power of detection by using a higher probability of type I error can improve MAS efficiency. This approach, validated by simulations, gives results that are generally consistent with those previously obtained by simulations using a more sophisticated biological model than ours. Thus, though developed from a simple genetic model, our approach may be a useful tool to optimize the experimental means for more complex genetic situations.
T
HE development of highly polymorphic molecular paper; the number of markers is unlimited). Theycon-markers has opened a new era for genetics and cluded that marker-assisted selection (MAS) should be
selection. Most traits of economic importance are quan- more efficient when the heritability of the trait is low.
titative. The use of molecular markers enables one to They mentioned, however, that to have such an
advan-identify and map quantitative trait loci (QTLs) that are tage at low heritability, it is necessary to study a large
involved in the variation of such traits. For the last six number of individuals. Landeand Thompson(1990)
years, the opportunity to use markers in breeding pro- discussed briefly the influence of the sampling size, but
grams to improve the efficiency of the selection of quan- only through its effect on the fraction of the additive
titative traits has received extensive attention. Lande genetic variance that was estimated to be associated
and Thompson(1990) developed a method based on with markers.GallaisandCharcosset(1994) studied
a multiple linear regression of phenotype on marker analytically the effect of experiment size, but they
as-types. In this method, markers are used as cofactors to sumed a strict linkage between markers and QTLs, and
increase the accuracy in the prediction of genotypic they neglected the possibility of false QTL detection
values. Phenotype and estimated effects associated with and the overestimation of the effects associated with
markers are combined in an index of selection. Experi- markers.
mental results of selection using markers have been Other published results on the efficiency of this
published (Stuberet al. 1982;Freiet al. 1986;Stuber
method or related methods are based on simulations and Edwards 1986; Stuberand Sisco 1992;
Strom-(Whittakeret al. 1995;GimelfarbandLande1994a, berg et al. 1994), but to our knowledge, none of them
b, 1995; Edwards andPage1994;Zhang andSmith
used the method ofLandeandThompson (1990).
1992, 1993). In all these works, population size and
Lande andThompson (1990) evaluated analytically
heritability appear to be the key parameters of MAS
the expected efficiency of their method compared with efficiency. Compared with an analytical approach,
simu-conventional selection based solely on phenotype under lations are a powerful tool because they can be designed
some restrictive hypotheses (e.g., the size of the popula- to be closer to real conditions of selection, and they
tion is assumed to be infinite in the major part of the allow one to evaluate the efficiency of the method for
many successive generations of selection. Even if simula-tions are quicker than field studies, they are time
con-Corresponding author: Laurence Moreau, Station de Ge´ne´tique
Ve´ge´-suming, especially when the objective is to evaluate the
tale (INRA-UPS-INAPG), Ferme du Moulon, 91190 Gif-Sur-Yvette,
France. E-mail: [email protected] effect of a large range of parameters or possible
Assuming that P is distributed normally, the genetic advance
tions between parameters. Moreover, simulations give
in the next generation under conventional phenotypic
selec-mostly descriptive information on the effect of a
parame-tion is
ter and may not provide explanations about the way
DGPHE5is2A/sP.
this parameter influences the efficiency of MAS.
Extending the preliminary analysis of Gallais and The relative efficiency (RE) of MAS compared with
pheno-typic selection can be defined as the ratio of the genetic ad-Charcosset(1994), with fewer restrictive assumptions,
vance under MAS to the genetic advance under phenotypic
this paper presents an analytical approach to evaluate
selection with the same intensity of selection
the relative efficiency of MAS, and it addresses the effect of population size.
RE5DGMAS
DGPHE
. (4)
When the size of the population is infinite, there is no error THEORY
in the estimation of the weight coefficients nor of the effects associated with markers. In that case, the relative efficiency
Landeand Thompson’s analytical approach when
popula-tion size is infinite:Lande andThompson(1990) proposed of MAS depends only on the heritability of the trait and on the
proportion of phenotypic variation associated with markers. to select individuals in a population assumed to be of infinite
size on an index combining phenotype and effects associated When the size of the population is finite, the weight coeffi-cients and the effects associated with markers are estimated with markers. Because our aim is to predict the mean genetic
value of the population after one cycle of selection, the ap- with a possible error. This experimental error leads to a smaller efficiency than expected under the assumption that proach ofLandeandThompson(1990) can be extended to
the prediction of the genetic value of the offspring of the parameters are known. Moreover, as mentioned by Lande
and Thompson (1990), there is a bias in the estimation of
individuals of the population. The selection index is then
the parameters because only markers with significant effects Hˆi5bpPi1bmMi, (1) are included in the index. The authors considered that this
bias could be neglected because markers can be chosen a priori where Hˆiis the predicted genetic value of the offspring of the
individual i in a population assumed to be of nearly infinite from the results of a QTL detection experiment conducted in a previous generation.
size, Pi is the phenotype of the individual i or the average
performance of its progeny if the trait is evaluated by progeny Genetic model used to study the case of a population of finite size: Consider a reference population of infinite size test of selfed or crossed origin (e.g., cross with a tester for
hybrid breeding), Miis the sum of the effects on the character derived from a cross between two inbred lines. Such
popula-tions are currently used to search for QTLs in plant species, associated with the markers and is called “molecular score,”
and bpand bmare the weight coefficients of the index. Only and the most commonly used are F2, backcross progenies
(BC), recombinant inbred lines (RIL), or doubled haploids significant effects are included in Mi. Because the aim is to
predict the genetic value of the offspring, only additive effects (DH). Consider a normally distributed quantitative trait that is influenced by numerous (l) unlinked QTLs with no epistasis. associated with markers have to be considered.Lande and
Thompson(1990) proposed to test the significance of marker- Each QTL is supposed to be linked to a single marker. The
observed rate of recombination between a QTL and its linked QTL associations by a multiple regression (developed by
step-wise selection) of phenotypes on marker types. They assumed marker, r, is assumed to be the same for all the marker-QTL pairs. It is assumed that this situation provides a relevant ap-a high density of map-arkers so thap-at recombinap-ation between map-ark-
mark-ers and QTLs could be neglected. In this situation, the effects proximation for several markers in the vicinity of each QTL, r being the smallest recombination rate between the QTL and of the detected QTLs are perfectly estimated. It results from
the regression theory that in very large samples, the weight the markers. With these assumptions, the additive genetic variance associated with markers is (122r)2s2
A. The parameter
coefficients that maximize the genetic gain are
m25 (1 2 2r)2is the fraction of the total additive genetic variance truly associated with markers. It is the maximum bp5
1⁄2(s2
A2 s2M)
s2
P2 s2M
51⁄2h2(12R2A)
12R2
P percentage of genetic variance that can be detected with this
set of markers. In addition to the l markers that are linked bm5
1⁄2(s2
P2 s2A)
s2
P2 s2M
51⁄2(12h2)
12R2
P
, (2) with a QTL, Nm2l markers unlinked to any QTL are consid-ered (Nm is the total number of markers). We also assume that all the markers are unlinked.
where s2
A and s2Pare, respectively, the additive genetic and
phenotypic variances of the trait in the population to be se- To simplify this approach, we will consider, in a first step, that all QTL effects are equal. Experimental results concern-lected and evaluated by progeny tests or per se value,s2
Mis the
additive genetic variance associated with the markers, h2is the ing QTL detection, however, show that the distribution of QTL effects is generally not uniform. Many authors (e.g.,
Pat-narrow sense heritability of the trait in the testing system
considered (the proportion of the total phenotypic variance ersonet al. 1991;Edwardset al. 1992) found few QTLs with
relatively large effects and many others with smaller ones. caused by additive effects of all QTLs), R2
Pis the proportion
of phenotypic variation associated with additive effects ac- Thus, to be more realistic, different types of QTL effects will be considered in a second step.
counted for by markers, and R2
Ais the proportion of additive
genetic variance associated with markers (R2
P5h2RA2). Relative efficiency of MAS in a given experiment:In a given
Denoting Gi, the genetic value of the offspring of the individ- MAS experiment, we consider N individuals randomly sampled
ual i, we then have: Gi51⁄2Ai, where Aiis the additive genetic from the reference population. Marker-QTL associations are
value of i. detected in this sample by a simple linear regression of
pheno-Assuming that Hˆ is normally distributed and that the selec- types on marker types, with a given probability a of type I tion is conducted on both sexes, the genetic advance (DGMAS) error. InLandeandThompson(1990), the effects associated
obtained with MAS after one generation is given by with markers were estimated by multiple regression of pheno-types on marker pheno-types. Since markers are supposed to be
inde-DGMAS52i cov(G,Hˆ )/√var(Hˆ ) , (3) pendent in this study, simple regression leads to nearly the same
a slightly reduced power of QTL detection and a reduced where aˆqis the estimated effect accounted for by marker q, aq
is the true effect, andlis a parameter that depends only on precision in estimations). Yet, simple regression presents the
advantage of being simpler from an analytical point of view the type of population considered (l 51 for DH or RILs,
l 50.5 for F2and BC). Equation 7 depends on the estimated because it tests each marker effect independently. The
esti-mated effects associated with markers are then used to predict effects associated with markers that are variable from one sample to another. Two samples of the same size can possibly the additive genetic values of the individuals of the reference
population of infinite size. This allows us to consider that the lead to different estimated values and then different REs. The expected RE must then be evaluated over all the possible candidates for selection are independent from the individuals
used to estimate the parameters of the model. The weight results that can be obtained from a population of N individuals. coefficients of the selection index that maximize the genetic Expected RE over all possible experiments of same size:
advance are obtained using Equation 2 where parameters are For a given experiment, the association between a given replaced by their estimations (bˆpand bˆm). Because we only con- marker and a QTL is tested with Fisher’s test. As developed
sider additive effects and populations derived from a cross be- inappendix B, all the parameters estimated at a given marker
tween two inbred lines, the molecular score M is defined as are functions of the F statistics. Since only markers significantly associated with a QTL are taken into account in the selection Mi5
o
q
aˆquiq, (5) index, the expectations of the estimated parameters are
ob-tained by using a truncated F distribution: only F values that where aˆqis the additive effect associated with the q th marker are equal or superior to a critical F value need to be considered.
estimated in the experiment. Only markers significantly associ- It results that the expectations of the estimated parameters ated with a QTL are included in M. uq is a dummy variable are not equal to their true values, but are overestimated. Even
taking a value of21 if the individual i has one parental marker if a marker is not linked to a QTL, the expectation of the type, 1 if i has the other parental marker type, and 0 if i is estimated variance accounted for by this marker is not zero. heterozygous. In the reference population, we assume that As shown inappendix B, the use of truncated F distributions
there is no segregation distortion. The expected frequency allows us to obtain the expected RE over all the results that for each marker type is 0.5 for BC, RIL, and DH. For F2 can be obtained after sampling N individuals from a given populations, the frequencies are 0.25 for the parental marker reference population.
types and 0.5 for the heterozygotes. Numerical applications:The formulas described above show
LikeLande and Thompson (1990), we suppose that the
that only m2(related to r), h2, l, N, Nm,a, and the QTL effect heritability is known (for a discussion of a confidence interval distribution affect the RE of MAS for a given population type. around the estimated heritability, seeKnappet al. 1985). With
In the numerical applications, we suppose that the population the assumption that the estimated effects at markers signifi- is composed of doubled haploids. Three sizes of experiment cantly associated with a QTL are independent, we have (100, 300, or 500), five type I error risks a(1, 5, 10, 20, or
30%), different numbers of QTLs (five or 10), different QTL
sˆ2
M5
o
qsˆ2
q,
effects distributions (QTLs with equal effect or QTLs effects following an approximate geometric distribution), and 30 where sˆ2
qis the estimated additive variance accounted for by
markers are considered. For these parameters, the relative marker q. It should be noted that, in principle, the estimated
efficiency of MAS is determined when m2varies from 0 to 1 effects associated with markers are not independent because
and when h2varies from 0.05 to 1. they are estimated from the same sample. Nevertheless, the
Validation of this approach by simulations:In previous for-covariance between the estimated effects of unlinked markers
mulations, some assumptions were made concerning (1) the should be negligible for large samples (N. 100). This
as-independence between the parameters estimated at different sumption will be validated by simulations (see below). The
markers and (2) the expression of the expected efficiency. percentage of phenotypic variance associated with the additive
To validate these assumptions, simulations were performed effects of markers (R2
P) can be estimated by the sum of the
with conditions as close as possible to those of the theoretical adjusted Rsquares (rˆ2
q) at each marker significantly associated
approach. We simulated a population of N5300 DH (or any with a QTL with a probabilityaof type I error.Charcosset
population where there are only two classes of genotypes at
and Gallais(1996) recommended the use of the adjusted
each locus). The narrow sense heritability of the trait of inter-Rsquare instead of the inter-Rsquare because it gives an unbiased
est was h2, and the additive variance associated with markers estimation of the percentage of phenotypic variance associated
with a QTL. The adjusted Rsquare, rˆ2
q, is defined by was m2s2A. We considered a total of 30 unlinked markers. This
was chosen to roughly correspond to 10 chromosomes with three nearly independent markers on each. Marker selection SSq
SStot5 N22 N21rˆ
2
q 1
1
N 21, was made by a simple regression of phenotypes on marker types with a probabilityaof type I error. The marker effects where SSq is the sum of squares associated with the marker q,
and the weight coefficients of the selection index were esti-and SStot is the total sum of squares.
mated subsequently as described above. A second population Then,
with the same genetic parameters was simulated, and individu-als were selected using the estimations made from the first population. One-tenth of the individuals were selected based bˆp5
h22
o
qrˆ
2
q
12
o
q
rˆ2
q
and bˆm5
12h2 12
o
q
rˆ2
q
. (6)
on either (1) their index value (MAS) or (2) their phenotypic value (PHE). The relative efficiency is computed from Equa-The use of the adjusted Rsquare leads to a smaller estimation tion 4. For each set of parameters (N, m2, h2, anda), simula-of the percentage simula-of variance that is accounted for by markers. tions were replicated 100 times. Over 100 simulations, the Thus, it reduces the weight given to the markers in the index averages of the percentage of phenotypic variance accounted
of selection. for by the markers (in the first population) and of the RE
Followingappendix A, Equation 4 becomes
were compared with the values predicted by the analytical approach. Using the standard error, a confidence interval at the 5% level was determined for the average values obtained
RE5
(h22o qrˆ
2
q)1(12h2)o qaˆqaql/s
2 A √(h22o
q
rˆ2
q)21(12h2)2o q
aˆ2
ql/s2P12(h22o q
rˆq)(12 2h2)o q
aˆqaql/s2P
,
TABLE 1
Estimated percentage of phenotypic variance associated with markers
Analytical resultsa Simulated results
Percent Selection bias Selection bias Average value over Standard error of h2 m2(r)d a not included included 100 simulationsb the averagec
0.15 0.3 (0.226) 5 0.017 0.059 0.059 0.003
20 0.029 0.085 0.087 0.004
0.5 (0.146) 5 0.043 0.088 0.082 0.004
20 0.060 0.113 0.114 0.004
0.7 (0.082) 5 0.075 0.119 0.118 0.004
20 0.094 0.143 0.142 0.004
0.9 (0.053) 5 0.111 0.150 0.153 0.006
20 0.128 0.173 0.168 0.005
0.3 0.3 (0.226) 5 0.058 0.103 0.100 0.004
20 0.077 0.128 0.132 0.005
0.5 (0.146) 5 0.129 0.166 0.165 0.005
20 0.144 0.187 0.180 0.005
0.7 (0.082) 5 0.200 0.228 0.218 0.006
20 0.207 0.248 0.244 0.006
0.9 (0.053) 5 0.265 0.288 0.280 0.005
20 0.269 0.308 0.302 0.005
0.45 0.3 (0.226) 5 0.111 0.150 0.148 0.005
20 0.128 0.173 0.179 0.005
0.5 (0.146) 5 0.217 0.243 0.242 0.005
20 0.223 0.263 0.266 0.005
0.7 (0.082) 5 0.313 0.334 0.337 0.007
20 0.315 0.353 0.358 0.005
0.9 (0.053) 5 0.405 0.424 0.431 0.006
20 0.405 0.443 0.453 0.006
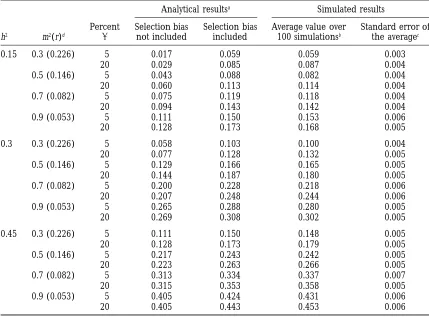
Comparison of the estimated percentage of phenotypic variance associated with markers obtainedafrom
expectations based on an analytical approach (bias caused by the selection of the markers in the index taken into account or not), andbfrom the average estimated value over 100 simulations.
cThe standard error of the average value obtained by simulation was used to determine a confidence interval
at the significant level of 5% and to test the adequacy between calculations and simulations. The size of the population is 300, and there are five QTLs of equal effects.
h2, heritability of the trait; m2, percentage of genetic variance associated with markers;a, type I level risk.
dr indicates the corresponding rate of recombination between marker and QTL.
significantly different. In the analytical approach, the bias Hence, our approach seems to be a good approximation of the realistic situation.
caused by the selection of the markers was taken into account. To investigate the importance of this bias, the analytical results obtained by considering that this bias could be neglected in
RESULTS the formulae (i.e., with no false detection and no
overestima-tion of the effects of QTLs) were also given and compared
Validation of the analytical approach by simulations: with simulation results.
The analytical results obtained with bias of selection
Comparisons between simulations and analytical results
were made for 24 conditions [two aprobabilities of type I taken into account or neglected are compared to the
error (5% and 20%), three heritabilities (0.15, 0.3, and 0.45), simulation results (Tables 1 and 2). The estimation of and four m2parameters (0.30, 0.5, 0.7, and 0.9)].
the percentage of variance associated with markers
ob-To simplify the formulation of the expected RE of MAS, it
tained by the analytical approach is included in the
was assumed in the analytic approach that selection is
per-confidence interval at the 5% level of significance of
formed in the reference population, and not in the sample
used to estimate marker-QTL associations, as would be the case the average value found on 100 simulations (Table 1).
in true experiments. To validate this assumption, simulations Taking into account selection bias through truncated conducted with only one population instead of two were per- F distribution is, therefore, a valid way to predict the formed, and the results were compared with those obtained
estimated percentage of variance associated with
mark-with two populations. Only minor differences were observed
ers. For low m2and heritabilities, the bias in the
estima-between results of simulations conducted with one or two
tion of the variance associated with markers is
impor-populations (results not presented). The maximum difference
TABLE 2 Relative efficiency of MAS
Analytical resultsa Simulated results
Percent Selection bias Selection bias Average value over Standard error of h2 m2(r)d a not included included 100 simulationsb the averagec
0.15 0.3 (0.226) 5 1.238 1.003 1.033 0.039
20 1.393 0.995 0.989 0.036
0.5 (0.146) 5 1.548 1.347 1.434 0.045
20 1.744 1.368 1.427 0.078
0.7 (0.082) 5 1.890 1.713 1.729 0.050
20 2.077 1.720 1.776 0.060
0.9 (0.053) 5 2.229 2.073 2.165 0.078
20 2.385 2.051 2.100 0.063
0.3 0.3 (0.226) 5 1.155 1.077 1.108 0.020
20 1.205 1.055 1.053 0.017
0.5 (0.146) 5 1.343 1.271 1.296 0.025
20 1.384 1.236 1.244 0.020
0.7 (0.082) 5 1.536 1.464 1.436 0.025
20 1.559 1.407 1.418 0.024
0.9 (0.053) 5 1.724 1.654 1.663 0.026
20 1.734 1.585 1.618 0.026
0.45 0.3 (0.226) 5 1.089 1.060 1.046 0.010
20 1.104 1.044 1.034 0.010
0.5 (0.146) 5 1.189 1.156 1.165 0.011
20 1.196 1.127 1.116 0.012
0.7 (0.082) 5 1.297 1.258 1.259 0.014
20 1.299 1.218 1.201 0.015
0.9 (0.053) 5 1.420 1.374 1.363 0.015
20 1.420 1.326 1.321 0.015
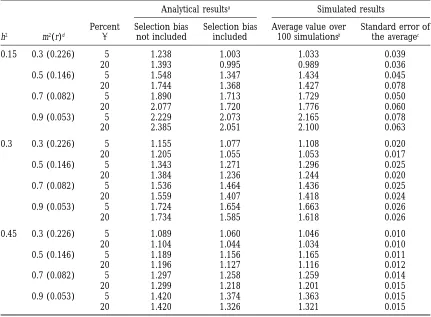
Comparison of the RE of MAS obtained fromaexpectations based on an analytical approach (bias caused
by the selection of the markers in the index taken into account or not), andbfrom the average relative efficiency
over 100 simulations.
cThe standard error of the average value was used to determine a confidence interval at the 5% significance
level and to test the adequacy between calculations and simulations. The size of the population is 300 and there are five QTLs of equal effects.
h2, heritability of the trait; m2, percentage of genetic variance associated with markers;a, type I level risk.
dr indicates the corresponding rate of recombination between marker and QTL.
value. Detections of false QTLs and overestimations of markers and QTLs, and the probabilitya of type I
er-ror). The heritability of the trait results from both the the effects accounted for by markers explain these
dif-ferences. For the RE of MAS (Table 2), results of simula- biology of the trait and experimental conditions because
it can be increased by using replications of genotypes tions are not significantly different from the analytical
ones when selection bias is taken into account. Not (in the case of plants) or performances of relatives to
reduce the experimental error. considering selection bias leads to overestimating the
actual relative efficiency of MAS. This overestimation is Figure 1 shows the domains of RE of MAS compared
with selection based on phenotype in function of r and
especially important for low heritabilities, low m2 and
for higha. Simulation results therefore show that the h2for N5100, 300, or 500, as well as for two numbers
of QTL effects: 5 or 10 of equal effects. The different bias caused by the selection of the markers can be
impor-tant. Since this bias cannot be easily corrected in true domains are separated by lines corresponding to REs
varying from 1 to 2.75 by 0.25. It is seen that for a experiments, it is important to consider it in the
evalua-tion of the RE of MAS. given N and witha 55%, domains with the highest RE
correspond to low heritabilities. When the heritability
Influence of biological parameters (h2
, l, and QTL
effects distribution) on the RE of MAS:We can distin- is high, genotypic values are well estimated by the
phe-notype, the weight given to the markers in the selection guish two groups of parameters: those that depend on
the biology of the trait (number and effects of the QTLs) index is low, and MAS tends to be equivalent to
pheno-typic selection. Nevertheless, with anarisk level of 5%,
and those that depend only on experimental conditions
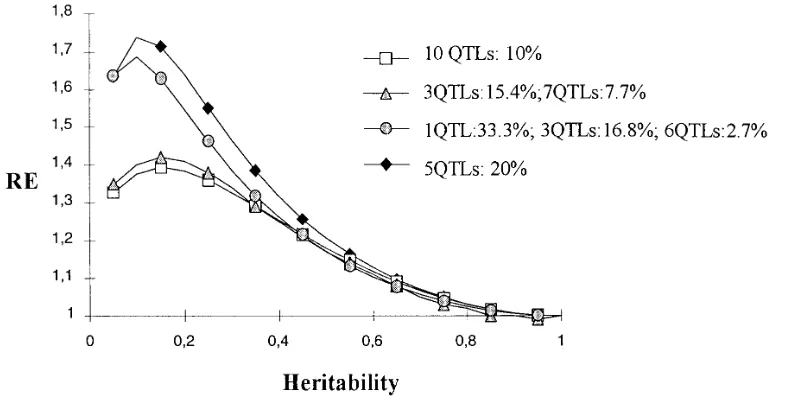
Figure2.—Effect of heritability and genetic model on RE of MAS. The RE of MAS (ordinate) compared with selection based
solely on phenotype is given for different heritabilities (abscissa) of the trait and four genetic models. For the four models, the number of QTLs in each class of effect and the percentage of variance accounted for by each QTL of the class are given. The size of the population was fixed at 300, the percentage of genetic variance accounted for by markers is 0.7, and the type I level risk is 5%. See text for models description.
such heritabilities, the power of detection is small and distribution 1 when the heritability is ,0.3. Then, for
a given number of QTLs, equal effects lead to a lower RE the effects are estimated poorly. Since MAS can only be
efficient if the number of detected QTLs is high enough, of MAS compared with an “L” distribution or geometric
distribution, as assumed by Lande and Thompson
there is an optimal heritability that varies slightly with
m2but is around 0.15–0.2 for N 5 300 and five QTLs (1990) orGimelfarbandLande(1994a,b). In
distribu-tion 3, one QTL explains a large part of the genetic of equal effects in the model.
The RE of MAS for given N and avalues decreases variance. The power of detection of such a QTL is high
enough for it to be detected even if the heritability is as the number of QTLs increases (see the comparison
between five QTLs vs. 10 QTLs of equal effects in Figure low. Then, compared with a distribution where all the
QTLs have the same effect, the RE of MAS is higher 1). When there are many QTLs, the individual effect
(r2
q) of a given QTL is small, so the power of detection for small heritabilities. Conversely, when the heritability
is high, the third model leads to a slightly smaller RE becomes low. The RE also depends on the distribution
of the QTL effects. of MAS than the other models. This is because of the
minor QTLs in model 3 which have an r2
q lower than
The RE obtained with the same number of QTLs, but
three different QTL effect distributions are compared the QTLs of the other models, as well as a lower power
of detection. It appears that the RE obtained with five
in Figure 2: (1) 10 QTLs, all with the same r2
q of 10%,
(2) 10 QTLs with three having an individual r2
q of 15.37% QTLs of equal effects is close to that obtained with
distribution 3. Also, the RE obtained with 10 QTLs of
and seven with an r2
q of 7.7%, and (3) 10 QTLs with
one QTL having an r2
q of 33.3%, three QTLs with an equal effects is comparable to the RE obtained with 15
QTLs and a distribution of effects close to a geometric
r2
q of 16.8%, and six QTLs with an rq2of 2.7%. Model 3
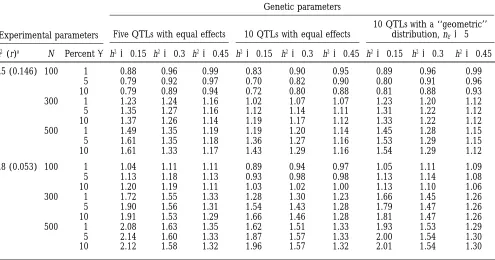
has been chosen to be close to a geometric distribution, series with nE510 (result not presented). This suggests
that the RE obtained with a geometric distribution can
as used by LandeandThompson (1990),
correspond-ing to an effective number nEof five QTLs. The RE with be approximated by using a number of QTLs equal to
the effective number and by considering that all these five QTLs of equal effects is also presented in Figure 2
to be compared with the RE obtained with model 3. It QTLs have an equal effect. Nevertheless, by doing so,
the RE of MAS is slightly underestimated when Nh2m2
appears (cf. Figure 2 with N5300,a 55%, and m25
0.7) that distribution 3 leads to a better efficiency of is low and slightly overestimated in the other cases (see
Table 3). MAS than distribution 2, which is slightly better than
Figure 1.—Domains of RE of MAS. Efficiency of MAS is compared with selection based solely on phenotype for different
heritabilities of the trait (ordinate) and marker-QTL recombination rates (abscissa).The number of markers is 30. Three sizes of population (N) are considered: N5100 (graphs a and b), N5300 (graphs c and d), and N5500 (graphs e and f). Two genetic models are compared: five QTLs of equal r2
TABLE 3
Effect of different parameters on the relative efficiency of MAS
Experimental parameters
Genetic parameters
10 QTLs with a ‘‘geometric’’ Five QTLs with equal effects 10 QTLs with equal effects distribution, nE55
m2(r)a N Percenta h250.15 h250.3 h250.45 h250.15 h250.3 h250.45 h250.15 h250.3 h250.45
0.5 (0.146) 100 1 0.88 0.96 0.99 0.83 0.90 0.95 0.89 0.96 0.99
5 0.79 0.92 0.97 0.70 0.82 0.90 0.80 0.91 0.96
10 0.79 0.89 0.94 0.72 0.80 0.88 0.81 0.88 0.93
300 1 1.23 1.24 1.16 1.02 1.07 1.07 1.23 1.20 1.12
5 1.35 1.27 1.16 1.12 1.14 1.11 1.31 1.22 1.12
10 1.37 1.26 1.14 1.19 1.17 1.12 1.33 1.22 1.12
500 1 1.49 1.35 1.19 1.19 1.20 1.14 1.45 1.28 1.15
5 1.61 1.35 1.18 1.36 1.27 1.16 1.53 1.29 1.15
10 1.61 1.33 1.17 1.43 1.29 1.16 1.54 1.29 1.12
0.8 (0.053) 100 1 1.04 1.11 1.11 0.89 0.94 0.97 1.05 1.11 1.09
5 1.13 1.18 1.13 0.93 0.98 0.98 1.13 1.14 1.08
10 1.20 1.19 1.11 1.03 1.02 1.00 1.13 1.10 1.06
300 1 1.72 1.55 1.33 1.28 1.30 1.23 1.66 1.45 1.26
5 1.90 1.56 1.31 1.54 1.43 1.28 1.79 1.47 1.26
10 1.91 1.53 1.29 1.66 1.46 1.28 1.81 1.47 1.26
500 1 2.08 1.63 1.35 1.62 1.51 1.33 1.93 1.53 1.29
5 2.14 1.60 1.33 1.87 1.57 1.33 2.00 1.54 1.30
10 2.12 1.58 1.32 1.96 1.57 1.32 2.01 1.54 1.30
Expected RE of MAS compared with phenotypic selection for different biological parameters (number of QTLs, QTL effects distribution, and heritability h2of the trait) and experimental parameters (m2and the corresponding the rate of recombination between marker and QTL, r, population size N, and type I level risk,a). The total number of markers is 30.
ar indicates the corresponding rate of recombination between marker and QTL.
Influence of experimental parameters (N, m2, number and N 5 600 because of a higher risk of false QTL
detections. Nevertheless, the efficiency domains
ob-of markers, anda) on RE:Figure 1 shows that N is an
important parameter. Obviously, the RE of MAS in- tained with a given population size, N, and a given
num-ber of QTLs, l, are approximately equal to the efficiency creases with N. When N is large, the power of detection
and the accuracy of the estimation of the marker-associ- domains that would be obtained with 2l QTLs of equal
effect and a population size of 2N. ated effect are increased. Therefore, MAS seems to be
interesting only for populations of .100 or 200 indi- Figure 1 shows that the RE increases as the distance
between markers and QTLs decreases. Obviously, if the viduals. Increasing N is more important when the trait
is controlled by a high number of QTLs; the efficiency markers are the QTLs themselves (m2 5 1 or r 5 0),
selecting on markers is equivalent to selecting on QTLs.
domains with N5300 and l55 are very close to those
obtained with N5600 and l 510 (results are not pre- The marker-QTL distance in our model cannot be
di-rectly interpreted as a density of markers in a real ge-sented) if we consider in both cases an equal percentage
of markers linked with a real QTL (i.e., Nm530 for l5 netic map because, in the latter case, markers that are
linked on the same chromosome are not independent.
5 and Nm5 60 for l 510). This can be related to the
fact that if each marker accounts for a small part of the If the marker density is not too high, then it can be
assumed that the correlations between linked markers
phenotypic variance (i.e., if m2h2/l ,, 1), the
non-centrality parameter of the F distribution is close to are not strong enough to greatly modify the results, and
r can be roughly related to the density of the markers.
Nh2m2/l. Thus, with a given percentage of
noninforma-tive markers and a given probability of type I error, the If we assume the absence of interference, for the DH
population, r can be connected with the distance d be-noncentrality parameter appears to be the key
parame-ter that explains the relative efficiency of MAS. This is tween markers and QTLs by the mapping function of
Haldane(1919). If we suppose a uniform distribution
no longer true for a same total number of markers
because there are more noninformative markers when of QTL positions on chromosomes, the expected
dis-tance between a QTL and the nearest marker is
one-l55 than when l 510. This leads to a lower relative
DISCUSSION
One of the aspects of this study is to take into account the bias caused by the selection of the markers included in the index. This bias affects the estimation of the weight coefficients of the selection index and also the estimation of the additive effect of each marker. In true
experiments, it is difficult to avoid this bias.Gimelfarb
andLande(1994a) proposed to evaluate it by
simulat-ing a population of individuals with phenotypes con-trolled exclusively by the environment, i.e., with no QTL. This method, however, only considers the bias on the estimated percentage of variance that is accounted for by false positives and the bias that could be corrected by using the adjusted Rsquare. The overestimation of the true QTL parameters is not taken into account.
Figure3.—Effect of heritability and type I risk level on RE
Hence, the authors found that the correction using
of MAS. The relative efficiency of MAS (ordinate) compared their method is negligible when the population size is with selection based solely on phenotype is given for different
.200, but their method does not correct all the bias.
heritabilities (abscissa) of the trait and different type I error
With our approach, we considered the bias caused by
risks used in the detection of marker-QTL associations. The
size of the population is 300, the percentage of genetic vari- the overestimation of the QTL parameters, and we
ance explained by markers (m2) is 0.7, and five QTLs of equal
showed that it has an important effect when the power
effects are included in the model.
of QTL detection is small (Nm2h2low) even if the
popula-tion size is .200. By means of simulations, Beavis
(1994) also found that the effects associated with
de-our graphs r530% could therefore be roughly
interpre-tected QTLs are more overestimated when the popula-ted as one marker every 180 cM. The realistic domains
tion size is low, and that this bias cannot be neglected of the graphs then correspond to a recombination rate
even for a population of 500 individuals. Of course, it
between marker-QTL, r, ,15% (which corresponds to
would be most useful to have an estimation of this bias
4d ,72 cM and m2.0.49).
to correct the estimated values, but this requires further
Increasing a is also a way to increase the power of
investigation. detection, but it results in an increased risk of detecting
It was shown that the RE of MAS depends on the false QTLs. This parameter therefore has contradictory
genetics of the trait of interest, experimental
character-effects on RE. Figure 3 (with m2 5 0.7 and N5 300)
istics, and options concerning data analyses.Landeand
shows that the effect of adepends on the heritability.
Thompson(1990) did not discuss the effect of the
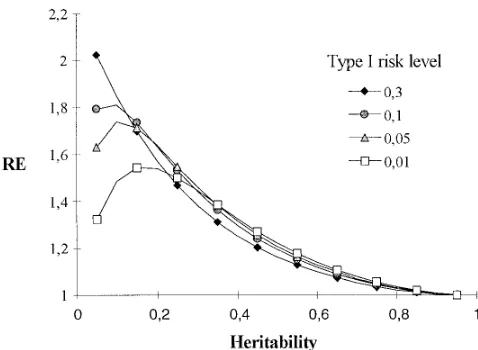
num-When the heritability is low, increasing a leads to a
ber of QTLs but, as for us, the RE of MAS depends on better RE. It is the opposite when the heritability is
the QTL effect distribution: MAS is more efficient for high. Thus, for low heritabilities, the gain in power of
small nE, i.e., when a few QTLs explain a major part
detection largely compensates the risk of false
detec-of the variation detec-of the trait. Our results suggest that tions. As a consequence, the heritability optimum
ob-considering l QTLs of equal effects may give a good
served witha 50.05% disappears for higheravalues.
approximation of the RE that would be obtained with
Table 3, however, shows that the effect ofaalso depends
a more realistic geometric distribution of effects
corre-on the populaticorre-on size and m2. If m2 is low (e.g., for
sponding to a nEof l. The problem is to determine how
instance 0.5) and if the population size is small (N 5
many QTLs are involved in the variability of quantitative
100), RE decreases asaincreases. In this situation, even
traits under interest and how their effects are distrib-when the heritability is low, the markers that are truly
uted.Beavis(1994) showed that the number of QTLs
associated with QTLs account for only a minor part of
detected in a given experiment provides only an under-the genetic variation, and under-the gain in under-the power of
estimation of the true number of QTLs, which may be detection does not compensate the risk of false
detec-.20 for most traits. In this study, we consider only a
tions. When the size of the population is large (.500)
small number of QTLs (,20). The effect of a higher
and m2is high, whena increases, the relative increase
number of QTLs could have been investigated, but with of RE tends to be smaller because the power of detection
many QTLs, it is no longer realistic to consider them
is high enough, even with lowa. In true experiments,
as independent. Without this assumption of
indepen-m2 should generally be .0.5 because of the marker
dence, the calculations are much more complex. It is density now available for many species, and the size of
known that linkage between two QTLs could result in
the population will often be,500 because of resource
the detection of a “ghost” QTL between them, which
limitations; thus, the choice of amay be important to
with that obtained with the same number of QTLs as- In our approach, marker-QTL associations are sup-posed to be detected by a simple regression. It is now sumed to be independent. The number of QTLs
consid-ered in this study can roughly be seen as the number acknowledged that the methods based on the
simultane-ous use of numersimultane-ous markers (nearby markers or mark-of independent chromosomal areas that are involved
in the variability of the trait. ers linked to other QTLs) can improve the power of
detection of a given marker-QTL association and the We demonstrated that even if the RE is generally
higher for low heritabilities, when the population size precision of the estimated QTL effects (seeLanderand
Botstein 1989; Zeng 1994; Jansen and Stam 1994).
is finite, there is an optimal heritability below which
the RE decreases. This was mentioned byLande and LandeandThompson (1990) proposed a stepwise
re-gression that was used by Gimelfarb and Lande
Thompson (1990) in their discussion and was
con-firmed byHospital et al. (1997) by means of simula- (1994a,b, 1995) andHospitalet al. (1997). Obviously,
the methods leading to the best power of detection
tions. When the population is finite but large (.500),
however, the optimal heritability is close to zero, and should be used and could lead to better results than
the simple method investigated here. For all the possible this is of little practical impact.
We showed that RE increases with population size. methods, a stopping rule for the introduction of
mark-ers into the index must be defined. In our approach,
LandeandThompson(1990) studied the effect of
pop-ulation size on the estimated percentage of genetic vari- we studied the effect of the type I error risk, and we
found that it must be adapted according to the heritabil-ance accounted for by the markers significantly
associ-ated with a QTL. Their results, however, indicassoci-ated that ity. If the heritability is low (,0.3), it is better to use a
larger type I error risk. It is the reverse at high heritabili-the population size below which MAS is not efficient
is much higher than the one we found. Lande and ties, but the effect of type I error risk is then expected
to be rather small. Thus, it is generally best to avoid
Thompson(1990) considered that a marker is always
included in the index if the expectation of the estimated using a low type I error risk, except when the heritability
is high and estimated accurately. In our approach, we variance accounted for by this marker is equal or
supe-rior to a threshold value corresponding to a type I error did not study the effect of including too many
parame-ters in the model. A related problem was investigated risk of 1%; conversely, if the expected value of the
esti-mator is under the threshold value, the marker is consid- by Gimelfarb and Lande (1994a, 1995), who
con-cluded that there is an optimal number of markers to ered to be never included in the index. Yet, in actual
experiments, such a marginal marker may have a very be included in the index.
In spite of the assumptions made, our analytical re-low but not zero power of detection. Hence, when the
population size is small,LandeandThompson(1990) sults are consistent with results of simulations conducted
in this study, justifying the statistical approach. More-underestimate the expected percentage of variance
as-sociated with markers and, thus, the RE of MAS because over, our results are also generally consistent with the
results obtained by means of simulations by other au-in this situation no marker is considered “possibly
de-tected.” Our analysis shows that even if MAS is more thors using more sophisticated biological models.
The problem of MAS profitability:Our results show
efficient for high population sizes, it is still efficient
for populations of z200 individuals, which are more that MAS can be more efficient than selection based
only on phenotype in a large range of situations, as realistic than the large population sizes indicated by
LandeandThompson(1990). long as the size of the population is at least 200, the
heritability of the trait is between 0.05 and 0.5, and We pointed out that MAS is more efficient when the
distance between markers and QTLs is small. Such a the markers are relatively close to the QTLs. While the
expected RE of MAS is higher for low heritabilities (0.1–
result was also observed byEdwardsandPage(1994)
when only one marker was linked to each QTL, as in 0.2), however, our simulations show that the frequency
of experiments that lead to a worse genetic gain with our model. This effect was reduced when they used a
model with two markers linked to each QTL. Moreover, MAS than with phenotypic selection (RE,1) is higher
(e.g., with five QTLs of equal effects, N5300, m250.5,
Gimelfarb and Lande (1994a,b, 1995) showed that
with many markers on each chromosome there is an a 5 5%, and h2 taking the values 0.15, 0.3, and 0.45,
the number of simulations where RE , 1 are,
respec-optimal density of markers, above which the RE
de-creases. According to their results, it seems that the tively, 13, 9, and 5). This was studied in more detail by
Hospital et al. (1997) by using a larger number of
effect of the marker-QTL distance depends mostly on
the number of markers on each chromosome. If there simulations and a more complex genetic model. This
element reinforces the interest of MAS for medium are numerous markers on each chromosome, the
flank-ing markers of each QTL give complementary informa- heritabilities (0.3–0.4).
Nevertheless, even if MAS is more efficient than pheno-tion and the distance between them is not the deciding
factor—until a certain limit. The results we obtained by typic selection, this method is expensive because of the
genotyping. Doing several replications of each genotype considering that markers are close to the QTLs may be
a good approximation of the RE obtained with two or using complementary information coming from
Gallais, A., andA. Charcosset, 1994 Efficiency of marker-assisted
prove the efficiency of phenotypic selection. Situations
selection, pp. 91–98 in Biometrics in Plant Breeding: Applications of
can be found where additional replications may be less Molecular Markers. Proceedings from the Ninth Meeting of the
EUCAR-PIA Section Biometrics in Plant Breeding, edited byJ. W. van Ooijen
expensive than obtaining marker data and yet lead to
andJ. Jansen. Wageningen, The Netherlands.
the same genetic advance. For instance, with N5300,
Gimelfarb, A., andR. Lande, 1994a Simulation of marker-assisted
m250.8, and 10 QTLs of equal effects, the maximum
selection in hybrid populations. Genet. Res. 63: 39–47.
Gimelfarb, A., andR. Lande, 1994b Simulation of marker-assisted
RE of MAS is obtained for a h2of 0.15 and isz1.54. In
selection for non-additive traits. Genet. Res. 64: 127–136.
this case, phenotypic selection can provide the same
Gimelfarb, A., andR. Lande, 1995 Marker-assisted selection and
genetic gain as MAS by using three replications of each marker-QTL associations in hybrid populations. Theor. Appl.
Genet. 91: 522–528.
genotype instead of one. If the genotyping is more
ex-Haldane, J. B. S., 1919 The combination of linkage values and the
pensive than adding two extra replications (which is
calculation of distance between loci of linked factors. J. Genet.
presently the case for most traits and most markers), 8:299–309.
Hospital, F., L. Moreau, F. Lacoudre, A. CharcossetandA.
Gal-MAS is not profitable. New marker techniques based
lais, 1997 More on the efficiency of marker-assisted selection.
on PCR can reduce the cost of MAS. Our analytical
Theor. Appl. Genet. 95: 1181–1189.
approach can be used to predict the expected genetic Knapp, S. J., W. W. StroupandW. M. Ross, 1985 Exact confidence
intervals for heritability on a progeny mean basis. Crop Sci. 25:
gain for a large range of parameters and then to define
192–194.
the best strategy of allocating resources for a given cost
Knapp, S. J., andW. C. Bridges, 1990 Using molecular markers to
of genotyping. This point is currently being investigated estimate quantitative trait locus parameters: power and genetic
variances for unreplicated and replicated progeny. Genetics 126:
in our laboratory.
769–777.
This problem of cost is complex because even in
situa-Lande, R., and R. Thompson, 1990 Efficiency of marker-assisted
tions where MAS is not more profitable than other meth- selection in the improvement of quantitative traits. Genetics 124:
743–756.
ods of selection in the first generation of selection, it
Lander, E. S., andD. Botstein, 1989 Mapping mendelian factors
allows one to select the individuals based on their
underlying quantitative traits using RFLP linkage maps. Genetics
marker types in the second generation. There is no 124:185–199.
Jansen, R. C., andP. Stam, 1994 High resolution of quantitative
need to evaluate their phenotype and no need to
deter-traits into multiple loci via interval mapping. Genetics 136: 1447–
mine all the marker types; it is only necessary to evaluate
1455.
the genotype at markers linked to QTLs. If the selection Paterson, A. H., S. Damon, J. D. Hewitt, D. Zamir, H. D.
Rabino-witchet al., 1991 Mendelian factors underlying quantitative
can be performed on immature individuals, the second
traits in tomato: comparison across species, generations and
envi-selection cycle can be achieved in a single generation.
ronments. Genetics 127: 181–197.
This possibility of adding one selection cycle based only Soller, M., and T. Brody, 1976 On the power of experimental
designs for the detection of linkage between marker and
quantita-on markers was not cquantita-onsidered in our analytical
ap-tive loci in crosses between inbred lines. Theor. Appl. Genet. 47:
proach, but simulations (Hospitalet al., 1997) indicate
35–39.
that this may be a very efficient strategy in terms of Stromberg, L. D., J. W. DudleyandG. K. Rufener, 1994
Compar-ing conventional early generation selection with molecular
genetic gain per time unit, even for high heritabilities,
marker-assisted selection in Maize. Crop Sci. 34: 1221–1225.
provided that there is a close linkage between markers
Stuber, C., M. GoodmanandR. Moll, 1982 Improvement of yield
and QTLs. If the heritability is high, the power of detec- and ear number resulting from selection at allozyme loci in maize
population. Crop Sci. 22: 737–740.
tion of QTL effects is high, and markers bring nearly
Stuber, C., andM. D. Edwards, 1986 Genotypic selection for
im-the same information as im-the phenotype, but in im-the
sec-provement of quantitative traits in corn using molecular marker
ond cycle, the selection on markers only is faster. loci. Proceedings of the 41st Annual Corn and Sorghum Research
Conference, American Seed Trade Association, 41: 70–83. We thank the anonymous reviewers for their helpful comments on
Stuber, C., andP. Sisco, 1992 Marker-facilitated transfer of QTL
an earlier version of this article.
alleles between elite inbred lines and responses in hybrids, Pro-ceedings of the 46th Annual Corn and Sorghum Research Confer-ence, American Seed Trade Association, 46: 104–113.
Whittaker, J. C., R. N. Curnow, C. S. HaleyandR. Thompson, LITERATURE CITED
1995 Using marker-maps in marker-assisted selection. Genet. Res. 66: 255–265.
Beavis, W. D., 1994 The power and deceit of QTL experiments:
Zeng, Z. B., 1994 Precision mapping of quantitative trait loci.
Genet-lessons from comparative QTL studies. Proceedings of the 49th
ics 136: 1457–1468. Annual Corn and Sorghum Research Conference. American
Zhang, W., andC. Smith, 1992 Computer simulation of
marker-Seed Trade Association, 49: 250–265.
assisted selection utilizing linkage disequilibrium. Theor. Appl.
Charcosset, A., andA. Gallais, 1996 Estimation of the
contribu-Genet. 83: 813–820. tion of quantitative trait loci (QTL) to the variance of a
quantita-Zhang, W., andC. Smith, 1993 Simulation of marker-assisted
selec-tive trait by means of genetic markers. Theor. Appl. Genet. 93:
tion utilizing linkage disequilibrium: the effect of several addi-1193–1201.
tional factors. Theor. Appl. Genet. 86: 492–496.
Edwards, M. D., T. Helentjaris, S. WrightandC. W. Stuber, 1992
Molecular-marker-facilitated investigations of quantitative trait
Communicating editor:B. S. Weir
loci in maize. 4. Analysis based on genome saturation with isozyme and restriction fragment length polymorphism markers. Theor. Appl. Genet. 83: 765–774.
Edwards, M. D., andN. J. Page, 1994 Evaluation of marker-assisted
APPENDIX A selection through computer simulation. Theor. Appl. Genet. 88:
376–382. The expected genetic gain of MAS is defined by
Equa-Frei, O., C. Stuber andM. Goodman, 1986 Y ield manipulation
tion 3 in the text. The phenotype Pi of the individual i
from selection on allozyme genotypes in a composite of elite
and a residual term, Ei, which includes an environmental follows a central F distribution. The probability of
de-error term and a genetic term corresponding to nonad- claring the effect significant (false positive) is equal to
ditive effects theatype I level risk. If there is a QTL near the marker,
the statistic follows a noncentral F distribution. The
Pi5 Ai1Ei.
probability of detecting it is the power of detection.
The genetic value of the offspring of i is equal to1⁄
2Ai. Following the approach described by Soller and
In the case of a population of finite size, if the selec- Brody (1976) and Knapp and Bridges (1990), the
tion is made on the two sexes, it follows that power is defined as the probability Pr[F
C21,N21,φ .
Fcrita,C21,N21,0] where C21 is the number of independent DGMAS 52i
cov(1⁄
2A,bˆPP1 bˆmM)
√
var(bˆPP1bˆmM) estimated parameters (C2151 for the simpleregres-sion), Fcrita,C21,N21,0is the critical value from a central F
distribution used to test QTL effect with a type I error of
5i bˆPs
2
A1bˆmcov(A,M)
√
bˆ2Ps2P1bˆm2sM2 12bˆPbˆmcov(P,M)
, (A1)
a, and FC21,N21,φis a random variable from a noncentral
F distribution (φ ≠0). FollowingCharcossetand
Gal-where i is the intensity of selection. In this formula, we
lais(1996), the noncentrality parameter isφ5(N21)
suppose that the heritability is known. The molecular
score was defined in the text (Equation 5) as rq2
12 r2
q
. The power of detection can then be deduced
Mi5
o
qaˆquiq. from the true effect accounted for by the marker.
Because all the markers are independent, among the
The marker typeuqis independent of E. The estimated l
j markers truly linked to QTLs having the same effect
additive effect aˆq associated with marker q has been
(aj), we consider that the number of markers detected
estimated in the sample. It is a constant at the reference
to be associated with a QTL follows a binomial law B(pj,
population level. Then,
lj), where pjis the power of detection. There are as many
cov(P,M) 5cov(A,M)5 cov(
o
l
alul,
o
qaˆquq) different binomial laws as the number of different QTL
effects (z) included in the model. In the same way,
5
o
q
o
lalaˆqcov(ul,uq), among the markers unlinked with QTLs, the number
of markers erroneously detected to be associated with
where al is the additive effect of the lth QTL. All the a QTL follows a B(a, Nm-l ) binomial law, where
cov(ul,uq)5 0 except those involving a marker and its l5
o
zj51lj is the number of markers truly linked to a
linked QTL. Denoting l 5 var(uq), the formula can QTL. Because all the markers are independent, we
con-then be simplified as sider that all these binomial laws are independent. All
the possible results of a QTL detection can be divided
cov(P,M)5 cov(A,M)5
o
q
aˆqaqvar(uq)5
o
qaˆqaql,
according to the number of true QTLs with the jth (A2)
effect (ntj) and false QTLs (nf ) detected. It results that
where
E(RE) 5
o
l1
nt150
··
o
lj
ntj50
··
o
lz
ntz50
o
Nm2l
nf50
p(nt1). . .p(ntj). .p(ntz)·p(nf )
aq5alcov(ul,uq)/var(uq)5al(1 22r),
can be interpreted as an additive effect associated with
E(RE/nt1,. . .,ntj,. . .,ntz,nf), (B1)
the q th marker.
The parameterldepends only on the population type: where p(nt1), p(ntj) and p(ntz) are the probabilities of
l 51 for HD or RIL;l 50.5 for F2 andl 51⁄
4for BC. detecting nt1, ntj, and ntz QTLs among those of class
The variance of the molecular score is computed as 1,. . ., j, and z, respectively, p(nf ) is the probability of
detecting nf. Because binomial laws are independent,
var(M)5 s2
M5var(
o
qaˆquq)5
o
qaˆ2
ql 12
o
q qo
9≠qaˆqaˆq9cov(uq,uq9).
the probability of detecting simultaneously nt1, ntj, and
ntZ real and nf false QTLs is the product of individual
Because markers are independent, all cov(uq,uq9) 5 0.
probabilities. The problem is then reduced to the evalu-Then,
ation of E(RE/nt1,. . .,ntj,. . .,ntz,nf), the expected RE of MAS s2
M 5
o
qaˆ2
ql. (A3)
conditional to the number of true and false QTLs de-tected.
Using Equations A2 and A3 and Equation 4 in the text,
In Equation 7, three terms depend on estimations Equation A1 leads to the formula in Equation 7 in the
coming from the experiment
o
q
rˆ2
q,
o
qaˆ2
q/sˆ2P, and
text.
o
qaˆqaˆq/sˆ2P. SinceAPPENDIX B
aˆ2
q/sˆP25
N 21
N SSq SStot5
N2 2
N rˆ
2
q 1
1
N,
For a given experiment, the association between a given marker and a QTL is tested with a Fisher test. If
x5
o
q
rˆ2
q and y5
o
q
aqaˆq/sˆ2P. (B2) tions because it implies genotyping a lot of individuals
but using only half of them for QTL detection, or using a previous generation to choose the markers. Here we The expected relative efficiency can be approximated
only consider the RE of MAS in the first generation of from a Taylor series by
selection. Because it is difficult to avoid this bias, we take it into account when evaluating the expected relative
E[RE(x,y)]≈RE(E[x],E[y])1 1⁄ 2var[x]
]2RE(x,y)
]2x2 |E[x],E[y]
efficiency of MAS by considering that estimated effects associated with markers depend on a “truncated” F
1 1⁄ 2var[y]]
2RE(x,y)
]2y2 |E[x],E[y]1cov[x,y]
]2RE(x,y)
]x]y |E[x],E[y]. distribution. rˆ2
q and
aˆq
sˆP
are functions of F noted rˆ2
q(F)
(B3)
and aˆq
sˆP
(F ). Then, noting g(F ), the density function of To test the presence of a QTL near a marker, Fisher’s
test is performed. The value of the statistic, F, is con- an F distribution (a central distribution if there is no
nected with the estimated effects associated with mark- QTL near the marker or a noncentral distribution if
ers the marker is linked to a QTL),
E(x)5
o
q
#
1∞Fcrit
rˆ2
q(F)g(F)dF and E(y)5
o
q#
1∞
Fcrit
aˆq
sˆP(F)
g(F )dF. rˆ2
q 5
F21
N2 11 F21 (B4)
(B6) and
Because the expected effect associated with a marker, considering truncated F distribution, is not null, we
aqaˆq
sˆ2
P
5|aq|
sP
!
F(N2 1)
N(F1[N22]) (B5) can associate an expected effect for false-positive
mark-ers. This expected effect because all the more important
(if we suppose that the sign of the effect associated with asabecomes smaller. For the same reason, the effect
a marker is always well estimated, i.e., aqand aˆqhave the of a marker that is truly linked to a QTL is overestimated.
same sign). The overestimation becomes all the bigger as the power
The value of the estimated effect at a given marker of detection (and a) becomes smaller.
varies from one experiment to the other but its expected
value over all the possible experiments equals the true var(rˆ2
q), var
1
aˆ qsˆP
2
, and cov
1
rˆ2q,aˆ q
sˆP
2
effect because the estimator is unbiased. Nevertheless,
only markers with a significant effect are introduced are evaluated in the same way. With the assumption that
in the selection index. As mentioned by Lande and there is no covariance between the estimated variances
Thompson(1990), this selection leads to a bias because at different markers, we have
the F statistic at each marker is always bigger than the
var(x)5
o
q
var(rˆ2
q)
critical value. To avoid this bias,LandeandThompson
(1990) proposed to detect the marker-QTL associations
var(y)5
o
q
a2
q
s2
P
var
1
aˆq sˆP2
from one sample and to evaluate the effects accounted for by the selected markers in another sample that is independent from the first one and where the selection
cov(x,y)5
o
q
aq
sP
cov
1
rˆ2q,aˆ q
sP
2
.