Available online at www.ijrat.org
Optimization of Process Parameters of Friction Stirs Processing
on Aluminium Alloy 7075
1
Dr. Md. Aleem Pasha, 2R. Siva Rama Krishna
1,2
Assistant Professor
1,2Department of ME, CBIT, Hyderabad
Abstract: Friction Stir Processing (FSP) is a relatively new entrant in the domain of solid state processing technique mainly
applied in the manufacturing of hybrid metal matrix composites. Aluminum and its corresponding alloys have got the excellent combination of properties like high strength to weight ratio, good corrosion resistance, high thermal and electrical conductivity, high reflectivity, low emissivity making it as a ideal choice for the aerospace and automotive industries. Some application in these industries requires high hardness and high strength to weight ratio. Friction Stir Processing realizes achieving this by introduction of reinforcing particles onto the surface of the metal matrix by the rubbing action of the tool. The process is mainly influenced by the process parameters like tool rotational speed, Traverse speed (feed), Geometry of the tool, Tool material, diameter of the hole, spacing of the hole, tool tilt angle, plunge depth etc .In this work, attempts will be conducted to identify the optimum process parametric conditions for Friction Sir Processing by using Taguchi Design of experiments technique to enhance surface properties of Aluminum alloys.
1. INTRODUCTION
Vipin Gopan et al. [1] investigated the effect of various process parameters on Friction Stir Processing of Aluminum alloys. The process parameters selected for this study are speed (rpm), feed (mm/min) and depth of cut (mm). Three levels of speed, feed and depth of cut were selected and experiments were designed on the basis of Taguchi Orthogonal array. NareshNadammal et al. [2] studied the microstructure and texture development during single and multiple pass friction stir processing (FSP) of a strain hard enable wrought Al-Mg alloy (AA5086) was investigated.. S.Chainarong et al. [3]attempted to improve the mechanical properties of SSM 356 aluminum alloys by friction stir processing, a solid-state technique for micro structural modification using the heat from a friction and stirring. The parameters of friction stir processing for SSM 356
aluminum alloys were studied at three different travelling speeds: 80, 120 and 160 mm/min under three different rotation speeds 1320, 1480 and 1750 rpm. The hardness and tensile strength properties were increased by friction stir processing. Vaira Vigneshand Padmanaban [4]applied friction stir processing on AA5083, with an objective to improve its wear resistance. FSP was conducted by varying tool rotation speed, tool traverse speed and tool shoulder diameter as per face centered central composite design. WenjingYanget al. [5] proposed a novel approach named double-sided friction stir processing (DFSP) was proposed to prepare 7050-T7451 aluminum alloy plates, and effects of solution treatment (ST) on microstructures and mechanical properties of DFSP were investigated.
2.
EXPERIMENTATION:Fig.1: FSP
The vertical milling machine model of HMT FM-2V is used during the work process of friction stir processing. The capacity of machine is 10 HP. The range of the speed is 35 RPM minimum and 1800 RPM maximum. The feed capacity is minimum 16mm/min and maximum 800
Available online at www.ijrat.org
193 have been carried out according to L9 34 Orthogonal Array as per the following table 3.
[image:2.612.75.521.138.211.2]Chemical Composition Of Tool:
Table.1: Chemical composition of H13 Tool Steel
Element C Mn Cr Mo V Si Fe
Weight (%) 0.40 0.35 5.20 1.30 0.95 1.0 90.8
The process parameters that are considered for the present research work are:
Table.2: Factors and Levels considered of parameters Levels Tool rotational
speed (rpm)
Feed (mm/min) Width (mm) Depth (mm)
1 710 16 1 2
2 900 20 1.5 3
3 1120 25 2 4
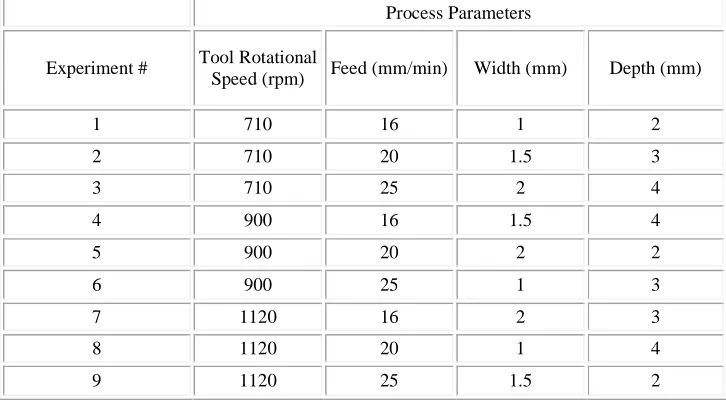
The levels of these factors can be depicted in the form of a table as follows: Table.3: L9 3
4
Orthogonal Array
The surface of the processed plates after the first pass of processing yielded some surface defects like cracking, rough surface and improper mixing of the reinforce material with the Aluminum matrix as shown in figure 2 . Hence a second pass of Friction Stir Processing has been performed
with the same set of parameters that are used for the first pass and yielded defect free processed region as shown in figure 3. The quality of the processed regions is evaluated by conducting tests like Tensile test and Rockwell hardness test.
Process Parameters
Experiment # Tool Rotational
Speed (rpm) Feed (mm/min) Width (mm) Depth (mm)
1 710 16 1 2
2 710 20 1.5 3
3 710 25 2 4
4 900 16 1.5 4
5 900 20 2 2
6 900 25 1 3
7 1120 16 2 3
8 1120 20 1 4
[image:2.612.124.487.333.533.2]Available online at www.ijrat.org
Fig.2: Process of FSP Fig.3: FS Processed plates with single pass
3. RESULTS AND DISCUSSION:
a) Tensile test: Tensile test has been performed on the FS
processed plates to determine yield strength, ultimate tensile strength, % elongation of the weldment. One tensile
specimen from each of the processed region has been cut with wire cut EDM according to ASTM E8/E8-M-16a standard
[image:3.612.303.503.124.243.2].
Fig.4: Tensile specimens of FSP Plates
Results of Tensile Test
Tensile tests have been performed on the FSP plates with Nano UTM. The results of the tensile test are tabulated as follows:
Table 4. Results of Tensile test
Experiment No. Ultimate Tensile Strength (MPa)
Peak Load (kN) % Elongation
1 326.14 11.741 11.192
2 294.866 10.615 7.376
3 241.207 8.638 4.616
4 342.028 12.313 9.226
5 299.124 10.768 15.514
6 170.093 6.123 10.340
7 176.078 6.339 8.633
8 235.05 8.462 9.338
9 235.23 8.468 9.385
[image:3.612.155.461.310.433.2]Available online at www.ijrat.org
[image:4.612.133.482.102.268.2]195 Figure 5: Comparison of Tensile strength
The region processed by tool rotational speed as 910rpm, feed as 16mm/min, width as 1.5mm, depth of slot as 4mm yielded better results when compared with its counterparts and is about 62.5% of the base material ultimate tensile strength. This might be due to proper heat generation in the processed zone and proper plasticizing the base material resulting in the effective mixing of the reinforcement material with the matrix material.
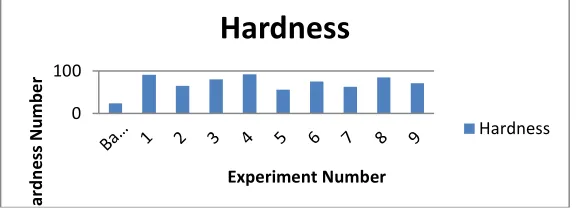
Results Of Hardness Test
[image:4.612.112.500.389.519.2]Rockwell B scale hardness test has been performed on the cross section of the processed region to determine the impact of the process parameters and the abrasive material used in the research work in determining hardness of the Aluminium matrix.
Table 5 Results of Hardness test Experiment
No.
Distance from Centre of Processed zone (mm)
-10 -05 00 05 10
1 72 98 91 70 66.5
2 76 70 65 60 74
3 75 52 80 56 65.5
4 55 62 92 74 70
5 24 61 56 56 61
6 54 28 75 75 76
7 55 31 63 8 71
8 62 62 85 61.5 77
9 76.5 30 71 76 63
A graph has been plotted by considering distance from the weld centre on the X-Axis and Rockwell hardness value on the Y-Axis to investigate the impact of process parameters
and abrasive material in altering the hardness of aluminium matrix.
Fig.6: Comparison of Hardness
From the Figure 6 it can be seen that, for most of the processed zones there is great increase in the hardness value in the processed regions and is eventually high for the joint processed by tool rotational speed as 910rpm, feed as
16mm/min, width as 1.5mm, depth of slot as 4mm yielded better results when compared with its counterparts and is about 62.5% of the base material ultimate tensile strength. This might be due to proper heat generation in the processed 0
100 200 300 400
T
e
n
si
le
S
tr
e
n
g
th
M
P
a
Experiment Number
Tensile Strength Mpa
Tensile Strength Mpa
0 100
H
a
rd
n
e
ss
N
u
m
b
e
r
Experiment Number
Hardness
[image:4.612.163.451.565.669.2]Available online at www.ijrat.org zone and proper Plasticizing the base material resulting in
the effective mixing of the reinforcement material with the
matrix material.
.
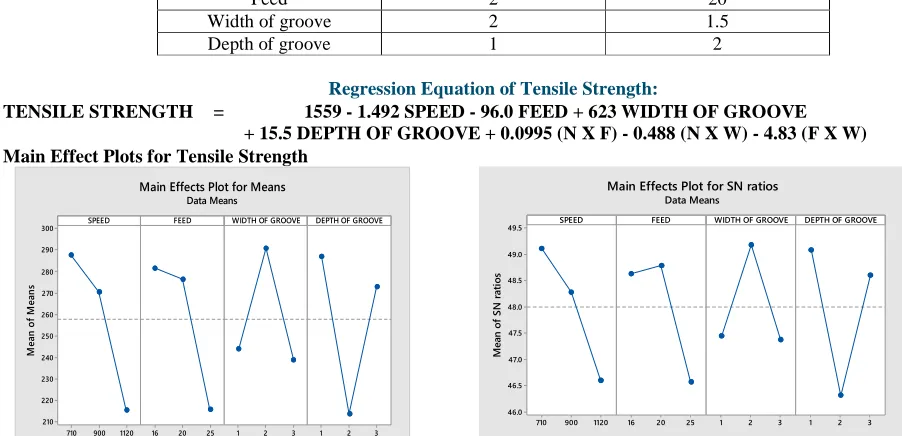
[image:5.612.59.510.185.403.2]Optimal combination of factor levels for Tensile strength:
Table 6. Optimal combination of factor levels for tensile strength Parameters Optimal levels Optimal value
Speed 1 710
Feed 2 20
Width of groove 2 1.5
Depth of groove 1 2
Regression Equation of Tensile Strength:
TENSILE STRENGTH = 1559 - 1.492 SPEED - 96.0 FEED + 623 WIDTH OF GROOVE
+ 15.5 DEPTH OF GROOVE + 0.0995 (N X F) - 0.488 (N X W) - 4.83 (F X W) Main Effect Plots for Tensile Strength
Fig.7: Main effect plots for Tensile strength
The above graph indicates that which level of process parameter is mostly affected on the tensile strength of fsp plates. According to above graph fist level of rotational speed is best to get optimum tensile strength i.e 710 RPM.
Interaction Plots for Tensile Strength:
[image:5.612.160.455.518.663.2]Second level of feed is best is best to get optimum tensile strength i.e 20mm/min. Third level of width of groove is best to get optimum tensile strength i.e 2mm.
Fig.8: Interaction plots for Tensile strength
Figure 8 explains the interaction of process parameters. It above graph indicating that the tensile strength of FSP
1120 900 710 300
290
280
270
260
250
240
230
220
210
25 20
16 1 2 3 1 2 3
SPEED
M
e
a
n
o
f
M
e
a
n
s
FEED WIDTH OF GROOVE DEPTH OF GROOVE Main Effects Plot for Means
Data Means
1120 900 710 49.5
49.0
48.5
48.0
47.5
47.0
46.5
46.0
25 20
16 1 2 3 1 2 3
SPEED
M
e
a
n
o
f
S
N
r
a
ti
o
s
FEED WIDTH OF GROOVE DEPTH OF GROOVE Main Effects Plot for SN ratios
Data Means
Available online at www.ijrat.org
[image:6.612.71.521.115.344.2]Taguchi Analysis of Hardness Test:
Table 7: Optimal combination of factor levels for hardness Parameters Optimal levels Optimal value
Speed 1 710
Feed 1 16
Width of groove 2 1.5
Depth of groove 3 4
Main effects plot for Hardness
Figure 9: Main effect plots for Hardness
The above graph indicates that which level of process parameter is mostly affected on the hardness strength of fsp plates. According to above graph fist level of rotational
speed is best to get optimum hardness i.e 710 RPM. Second level of feed is best is best to get optimum hardness i.e 16mm/min. Third level of width of groove is best to get optimum hardness i.e 2mm.
Regression Equation HARDN
ESS
= 1243 - 0.854 SPEED - 46.3 FEED - 643 WIDTH OF GROOVE + 37.7 DEPTH OF GROOVE + 0.0222 (N X F) + 0.322 (N X W) + 17.71 (F X W)
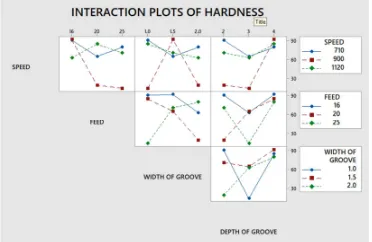
Figure 10: Interaction plots for Hardness
Figure 10 explains the interaction of process parameters. It means that, all the parameters which were considered for friction stir processing are affecting the Hardness strength. The above graph indicating that the tensile strength of FSP plates is depended on all the process parameters.
4. CONCLUSIONS:
1.The results of the tensile tests revealed that the joint fabricated with by tool rotational speed as 900rpm, feed as
16mm/min, width as 1.5mm, depth of slot as 4mm yielded better results when compared with its counterparts and is about 62.5% of the base material ultimate tensile strength. This might be due to proper heat generation in the processed zone and proper Plasticizing the base material resulting in the effective mixing of the reinforcement material with the matrix material.
The results of Rockwell B-Scale hardness test revealed that the joint processed with by tool rotational speed as 900rpm, feed as 16mm/min, width as 1.5mm, depth of slot as 4mm yielded better results when compared with its counterparts
1120 900 710 40 38 36 34 32 30 25 20
16 1 2 3 1 2 3
SPEED M e a n o f S N r a ti o s
FEED WIDTH OF GROOVE DEPTH OF GROOVE
Main Effects Plot for SN ratios
Data Means
Signal-to-noise: Larger is better 710 900 1120
90 80 70 60 50 40 25 20
16 1 2 3 1 2 3
SPEED M e a n o f M e a n s
FEED WIDTH OF GROOVE DEPTH OF GROOVE
Main Effects Plot for Means
[image:6.612.214.400.475.596.2]Available online at www.ijrat.org This might be due to proper heat generation in the processed
zone and proper plasticizing the base material resulting in the effective mixing of the reinforcement material with the matrix material.
REFERENCES
[1] VipinGopanP.S,SreekumarJishnu.P,Chandran
.
W,V ijay.
M, Sanjay Kumar “Experimental
Investigation on the Effect of Process
Parameters on Friction Stir Processing Of
Aluminium”
Volume 5, Issue 5, Part 2, Pages
13674-13681, 2018.
[2] Naresh Nadammal
,
Satish V.Kailas,
JerzySzpunar,
SatyamSuwas “Development of microstructure and texture during single and multiple pass friction stir processing of a strain hardenablealuminium alloy”
Volume 140, Pages
134-146, June 2018.
[3] S.Chainarong
,
P.Muangjunburee,
S.Suthummanon “Friction Stir Processing of SSM356 Aluminium Alloy” Volume 97, Pages 732-740, 2014.
[4] R.Vaira Vignesh
,
R.Padmanaban “Influence of friction stir processing parameters on the wear resistance of aluminium alloy AA5083” Volume 5, Issue 2, Part 2, Pages 7437-7446,2018.
[5]