R E S E A R C H
Open Access
A kind of effective data aggregating
method based on compressive sensing
for wireless sensor network
De-gan Zhang
1,2, Ting Zhang
1,2, Jie Zhang
3*, Yue Dong
1,2and Xiao-dan Zhang
4Abstract
Wireless sensor network (WSN) in the Internet of Things consists of a large number of nodes. The proposal of
compressive sensing technology provides a novel way for data aggregation in WSN. Based on the clustering structure of WSN, a kind of effective data aggregating method based on compressive sensing is proposed in this paper. The aggregating process is divided into two parts: in the cluster, the sink node sets the corresponding seed vector based on the distribution of network and then sends it to each cluster head. Cluster head can generate corresponding own random spacing sparse matrix based on its received seed vector and collect data through compressive sensing technology. Among clusters, clusters forward measurement values to the sink node along multi-hop routing tree. Performance analysis and comparison with the relative methods show that our method is effective and superior to other methods regardless of intra-cluster or inter-cluster on the total energy consumption of network.
Keywords:WSN, Internet of things, Compressive sensing, Data aggregating, Effective
1 Introduction
Data aggregating is an effective strategy to control en-ergy consumption because the number of transmissions can be reduced after aggregation. Reference [1–4] strives for energy balancing to make the network lifetime max-imum. The unbalanced consumption of energy is harm-ful to network safety and health [5–9]. If the sensor nodes of wireless sensor networks (WSNs) spend their energy in a relatively balanced way, the connectivity among sensor nodes and the sink nodes can be kept for a longer time, making the network segmentation to be postponed. Avalanched quantities of tiny sensor nodes establish WSNs in the Internet of Things. These nodes can monitor all kinds of object information around them in real-time. Since the energy of these sensor nodes is usually very limited, how to ensure complete data aggre-gating with the minimum energy consumption of nodes has been a very critical issue in WSNs [10–12].
In order to remove redundant portions of the collected data, and control the number of data nodes in WSNs,
which can save the energy consumption of nodes, re-cently, many scholars proposed a compressive sensing (CS) technology, which can collect and reconstruct sig-nal with high probability through sampling points less than the Nyquist sampling theorem [13–18]. According to the sparsity of the signal, compressive sensing tech-nology can decrease the original signal from high dimen-sional to low dimendimen-sional on the nodes. It needn't aggregate the signal and recover it with high probability on the sink node. The proposal of compressive sensing has good performance on image processing and other applications [19–27].
Without using compressive sensing in data aggregation, nodes near the leaves forward a small amount of packets, but those which are close to the sink node need to for-ward a large number of packets [28–30]. With using com-pressive sensing in data aggregating, each node simply forwards Mpackets, so the total transmission number of the network withNnodes isMN. However, transmission quantity is still large. References [6–10] proposed a hybrid protocol. In this protocol, nodes near the leaves forward original data without using compressive sensing, and those which are close to the sink node use compres-sive sensing technology to transmit data. References * Correspondence:[email protected]
3Beijing No. 20 High School, Xiaoyingxilu, Haidian District, Beijing 100085,
China
Full list of author information is available at the end of the article
[31–35] applied hybrid compressive sensing to the data aggregating and proposed a minimum energy aggregation tree. The previous work directly applies compressive sensing method to the route tree. Since clustering method has many advantages over the routing tree [36–40], compressive sensing method on clustering network is applied. Compared with routing tree data ag-gregating methods, clustering algorithm generally has a better communication load balance [41, 42]. In addition, previous works ignore the distribution of location infor-mation and node distribution, which can contribute that data aggregating consumes less energy in WSNs of the Internet of Things [43–47].
References [13,14] proposed Toeplitz matrix and proved that it meets the restricted isometry property (RIP). Since the correlation of data collected in a single cluster is rela-tively large, the sparse matrix to the process of compressive sensing can be used. It can minimize the number of independent random variables, which can reduce the com-plexity of compressive sensing process, and improve the calculation speed in the meantime.
The literature [14–18] proposed Toeplitz random meas-urement matrix and proved it. The literature [17–26] proposed quasi-Toeplitz matrix, semi-Hadamard matrix, and chaos-Toeplitz matrix and proved that they met the condition of the RIP. Based on the former researches, some scholars [27–35] proposed random spacing sparse Toeplitz matrix optimized by singular value decompos-ition (SVD) and apply it in wireless sensor networks.
According to random space sparse matrix based on the Toeplitz matrix, the vector T1= [ϕ1,ϕ2,…,ϕN,ϕN+ 1,…,
ϕN+M−1] contains all the elements of a Toeplitz matrix. They sparseT1with space △= 2, the value of its element
ϕi(i∈Λ,Λ is ⌈(N+M−1)/△⌉indexes randomly selected from 1~N+M−1) is subject to independent and identi-cally distributed, and the other elements are set to 0. Finally, the sparse vector is used to construct random spacing sparse Toeplitz matrix:
ϕiþ1;jþ1¼ϕi;j ð1Þ
The Gaussian random matrix requires MN -indepen-dent random elements, the general Toeplitz matrix only needs M + N−1, and the random space sparse Toeplitz matrix needs only ⌈(N+M−1)/Δ⌉|Δ= 2, …, 16 independ-ent random elemindepend-ents, so it is possible to further reduce complexity.
The innovation or contribution of this paper is as fol-lows: based on the clustering structure of WSNs, a new data aggregating method based on sparse hybrid com-pressive sensing is proposed The aggregating process is divided into two parts: in the cluster, the sink node sets the corresponding seed vector based on the distri-bution of network and then sends it to each cluster
head. Cluster head can generate corresponding own random spacing sparse matrix based on its received seed vector and collect data through compressive sensing technology. Among clusters, clusters forward measurement values to the sink node along the multi-hop routing tree which we built before. Per-formance analysis and comparison of the experimental results with the relative methods show that our method is effective and superior to other methods re-gardless of intra-cluster or inter-cluster on the total energy consumption of network and the lifetime of network.
2 Modeling based on hybrid compressive sensing for WSN
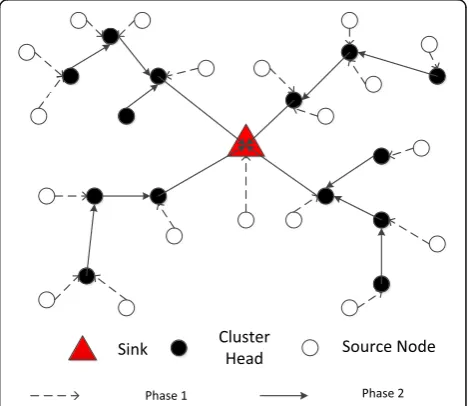
In the data aggregating process, first of all, the network is clustered. Each cluster has its cluster head, one sample is shown in Fig.1. The measurement matrix of the entire network is generated by sink nodes according to the sparse seed vector and sends the sparse seed vector to each cluster head. So, the measurement matrix can be divided into many sub-matrices; each sub-matrix corre-sponds to a cluster. ϕHirepresents theithsub-matrix,CHi represents its cluster head, andxHi represents data vector
of this cluster. CHican calculate the measurement values
ϕHixHi of received dataxHibased on its sub-matrix. When CHi generates itsMi predicted values, it forwards data to the sink node along the backbone tree which connects clustered heads to the sink node.
Assume that all of the nodes are divided into four clusters (because the 5 or 6 or 7 or 8 or other clusters are the same as that of four clusters, we select four clus-ters as an example), which are connected through a
backbone aggregation tree. Data vectorxcan be represented by ½xH1 xH2 xH3 xH4T. Matrix ϕ can be represented by
ϕH1 ϕH2 ϕH3 ϕH4
. Generally, those assumptions mentioned in this paper are realistic, and their implica-tions tell us that the truth is from the real scenarios of the applications, and the results can be tested the cases of the applications.
As shown in Formula (2), the predicted coefficient of measurement matrix is the sum of all the measured co-efficients in the cluster. Therefore, in each round, the cluster head generates predicted coefficients; all cluster heads forward the received predicted coefficients to the sink node. When the sink node collectedM rounds pre-dicted value, it can recover the original data.
We define the compressive ratio as ρ=M/N, which means that the ratio is between the measurement valueM
in the process of compressive sensing and the lengthNof collected signal. It describes the compression efficiency of the entire network.
We define the relative reconstruction error asε¼kd−d Λ k22
kdk2 2 ,
i.e., the ratio between the absolute error and the true value, wheredis the true distance value of a certain nodeiand its
cluster head node anddΛ is the measurement distance value of a certain nodeiand its cluster head node.
3 Data aggregating method based on compressive sensing in WSNs
Although compressive sensing technology can effectively re-duce the energy consumption of each node in the network, it is directly related to the measurement value M in com-pressive sensing. When the value ofM is large, the energy consumption of nodes remains high. To solve this problem, a novel hybrid compressive sensing data aggregating method is proposed, which mainly consists of four parts: network clustering, building the appropriate inter-cluster routing tree, compressive sensing data aggregating in clusters, and cluster head transmitting data to the sink node. How to con-struct the routing tree and evolve the process of compressive sensing in clusters is shown below.
3.1 Network model
We make the following assumptions in the network (generally, those assumptions are realistic, and their im-plications tell us that the truth is from the real scenarios of the applications):
1) Nnodes randomly distribute in a circular
perception area (the radius is L); the sink node is at the center of the sensing area (as shown in Fig. 1).
2) The sink node has enough data space and the ability of process.
3) The initial energy and the transmission rate of each sensor node are the same.
4) Nodes can know its own location information using the relative locating technology.
Lemma 1: Suppose that nodes in the wireless sensor network are distributed randomly, data aggre-gating in the cluster uses sparse matrices. If the clus-ter head is at the cenclus-ter of this clusclus-ter, then nodes consume least energy for each measurement value ag-gregating process.
Proof Assume that the jth cluster consists of mj nodes; the sparse ratio of the measurement matrix in the process of compressive sensing is s. In each ag-gregating process, the average number m0j of nodes which involves in the aggregation of measurement values is:
m0j¼X
mj
i¼1
s1¼mjs ð3Þ
Obviously, only m0j nodes need to forward their cor-responding weights for each time. Therefore, cluster head node receivesm0j packets. So, at every measure-ment, the average energy consumption in the jth
cluster is:
tion consumed by the ith node when forwarding k
bit data to its cluster head. E(di) represents the distance expectations from the ith node to its clus-ter head. As shown in the formula above, the aver-age energy consumption is decided by Eðd2iÞ . Suppose that the cluster is square and its side length is b and the cluster head’s coordinate (x0,
f xð ;yÞ ¼ is at the center area of the cluster.
Assuming that the network is divided into Nc non-overlapping clusters, that means Nc nodes are selected as the cluster heads; the other nodes connect to the cluster head near to them.
We also assume that the node can adjust their own en-ergy levels based on real transmission distance. Thus, the energy consumption from nodenito nodenjis Pij¼dαij.
The parameter α depends on the characteristics of the channel, which usually take between 2 and 4 as mentioned by References [13, 14]. Here, we choose α= 2, which is realistic for a typical WSN deployment [13–16]. Eventu-ally, we use the normalized reconstruction error as the CS signal reconstruction error.
3.2 Establishment of inter-cluster routing tree
Hops are forwarded from current cluster head to other cluster head (NoH), i.e., the node determines the value based on its own communication radius and the distri-bution of cluster heads in the network.
Lemma 2: Suppose that cluster heads forward measure-ment values along the inter-cluster multi-hop shortest routing tree, so the energy consumption of inter-cluster will reach to the minimum value.
ProofThe cluster head will geth−1 data packets at each time collecting measurement values, and the definition of the energy consumption of inter-cluster is as follows:
Einter¼
where di represents the transmission distance of the i th
data packet. The formula above shows that ifhandkare
constant, the final result is decided byPhi¼1d2i.
We propose an iterative algorithm to build distributed inter-cluster routing. Assuming that all cluster heads have the same transmission radius (R). Within the com-munication radius, cluster heads can communicate with each other. All cluster heads broadcast the hops from themselves to the sink node to their neighbors. TheNoH
of cluster head which contains the sink node in their communication radius is set as 1 at the first time of iter-ating. At the next iteration, these cluster heads broadcast their NoH to their neighbors and set the NoH of those cluster head nodes without NoH to be 2. After a series of iterations, it keeps choosing routing path until no cluster head is left. The algorithm can be abbreviated as the following steps:
3.3 Intra-cluster data aggregating based on compressive sensing
Step 1: The sink node forwards the seed vector U(ui),{i = 1,2,…, N} with sparse space △ to
every cluster head. Each cluster head determinating its position in the seed vector depends on its position on the backbone tree.
Step 2: Start from its position in the seed vector, the ith
cluster head node traverses forwardNivalues depends on the number of its intra-cluster nodesNi. Then, the cluster head gets its own
new sparse seed vector and eventually generates its corresponding sub-matrixMi×Ni.
Step 3: Non-CH (cluster head, CH) nodes forward their nodes to CH; CHs calculate the received data as Mimeasurement values by using the formula
yi=φixi.
Step 4: CHs forward measurement values to the sink node along the generated forwarding path. Step 5: The sink node generates the whole
measurement matrix based on the whole seed vectorU(ui),{i =1,2,…,N} and recovers the
original data depends on received datay =[y1,y2,…,yNc] by using CS reconstruction
algorithm.
4 Analysis of energy consumption in WSN
As stated in the above sections, non-CH nodes send their readings to their cluster heads. The energy consumption of intra-cluster defines asPintra-cluster. In the next step, the cluster heads get their corresponding measurement values (yi=φixi) based on intra-cluster node data and then send measurement values to the sink node. The energy con-sumption of intra-cluster node represents as PtoBS, and total energy consumption is expressed as follows:
Ptotal¼ðPintra‐clusterþPtoBSÞ ð8Þ
1) Analysis ofPintra-cluster
We assume that WSN is divided intoNcclusters evenly, each cluster has the same number of nodesN/Nc, including a cluster head andN/Nc−1 non-CH nodes. Then,
Pintra‐cluster¼Nc
where r is a random variable, which corresponds to the distance between a common node and its cluster head;αis the path loss exponent. In this paper, we set it as 2, so we can calculate the expectationE[r2]:
E r2 ¼∬x2þy2ρðx;yÞdxdy¼∬r02ρ r0;θ
r0dr0dθ
ð10Þ
whereρ(r,θ) represents the distribution of nodes. We also assume that each cluster is a circular area of R¼L= ffiffiffiffiffiffiNc
p
radius; the density of nodes in all clusters is distributed evenly. Therefore,
2) Analysis ofPtoBS
We define the energy consumption of inter-cluster transmission as follows:
PtoBS¼
XNc
i¼1
NoH ið Þ R2M ið Þ ð13Þ
whereM(i) is the number of measurement values of the
ithcluster;R2is the energy consumption on each hop. In the case of the analysis, we assume that all cluster sizes are equal. According to the literature [18], the number of measurement values required for each cluster is linearly proportional to the number of nodes in each cluster. Therefore, Eq. (12) can be rewritten as follows:
PtoBS¼R2
As aforementioned, M represents the total number of measured values required in the network.Ncis the num-ber of clusters. Formula (14) can be rewritten as follows:
PtoBS¼NoHaveR2M ð15Þ
whereNoHaveis the average number of hops.
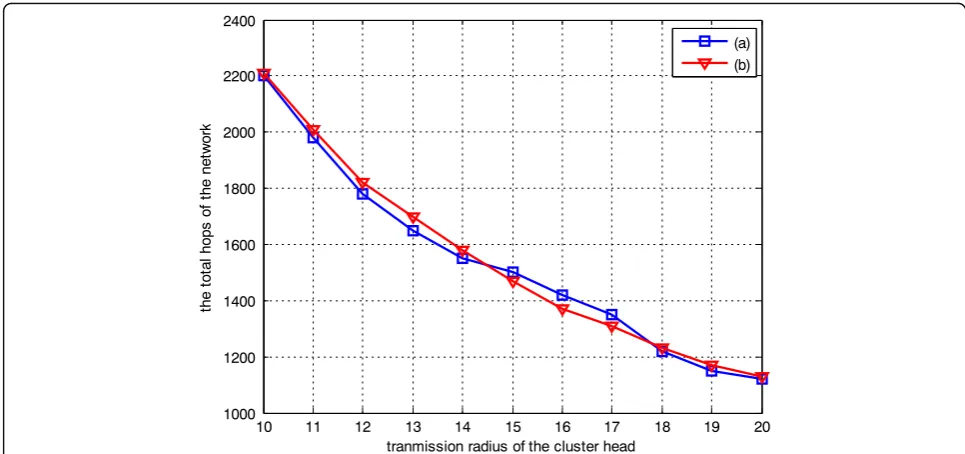
3) Analysis of communication radius of cluster head
K-means or LEACH. We change different communication radius R= {10, 12, 14, 16, 18, 20} in order to change the number of clusters in the network. As shown in Figs. 2 and3, the total hops will change after increas-ing or decreasincreas-ing of radiusRcorrespondingly. Generally, the units of the communication radiusRused to measure the quantities are specified meter asmor the times ofm, so we ignore the unit description for the following figures.
Figure2shows the comparison of the total hop change in the network when changing the communication range
of the cluster head. Figure 3 shows the comparison of the total energy consumption of the network when changing the communication range of the cluster head. The figures above (a) uses K-means before data aggre-gating and (b) uses LEACH before data aggreaggre-gating.
5 Description of the algorithm
Theorem 1 Assuming that wireless sensor network is clustering uniformly, the intra-cluster collect data by using compressive sensing technology, sparse matrix is
Fig. 2Comparison of the total hops change in the network
selected as the measurement matrix, cluster head node is at the center of cluster, and inter-cluster forwards data along the shortest multi-hop routing tree. Then every time in the data aggregating, the total energy consump-tion of network is minimum.
Proof From the previous Lemma 1 and Lemma 2, the mean value of energy consumption in the wireless sen-sor network is as follows:
Etotalð Þ ¼h
wherem0i represents the average number of nodes within
ith cluster the first time to participate in a single meas-urement. In the case of uniform clustering,m0i¼m0jand
d2i ¼d2jði;j¼1;2;…;h;i≠jÞ then Pi¼1
h
m0i and Phi¼1d2i
reach the minimum. So,EtotalðhÞreaches the minimum. This section presents a kind of data aggregating algo-rithm based on hybrid compressive sensing, which is dif-ferent from the traditional hybrid compressive sensing data aggregation. The measurement matrix required for every cluster is generated by seed vector provided by the sink node; because all of the intra-cluster nodes have the same calculation process, the entire network has bal-anced energy consumption. The complete algorithm is described as follows:
1) The network is clustered by using conventional clustering methods, such as LEACH and K-means. 2) The aforementioned method is used to construct
the inter-cluster multi-hop shortest routing tree between cluster heads and the sink node. Each cluster head can get its ownNoH. As seen in Formula (13), ifMandNcare certain, the energy
consumption of inter-cluster is only associated with NoH.
3) The sink node generates a corresponding sparse seed vectorU(ui),{i =1,2,…,N} according to the number of nodes in the network and send it to each cluster head.
4) Each cluster head (assuming thatithcluster head) using the received seed vector generates its measurement matrixMi×Niaccording to its
location and the number of nodes in it. 5) In the cluster, data is collected by using
compressive sensing technology, then we can get Mmeasurement values of the corresponding cluster head.
6) Cluster heads forwardMmeasurement values to the sink node along the inter-cluster multi-hop shortest routing tree. Based on Theorem 1, the total energy consumption of network during the data acquisition is minimum, so as to achieve the best performance; otherwise, we use machine learning approach to reconstruct signal and then ensure that the total energy consumption is minimum. Detailed machine learning approach can be found in our relative research works [7–11], because of the length limit of the paper, we ignore the detailed description.
7) Since the measurement matrix used in each cluster is generated by the partial seed sparse vector U(ui),{i =1,2,…,N}, so the sink node may also generate a total block matrix as the recovery matrix. The sink node recovers the original data by using corresponding reconstruction algorithm.
Because the random space sparse matrix can be dy-namically generated by a series of seed vectors, the measurement matrix required for the whole network can be determined by the sink node. On one hand, com-pared with the Gaussian random matrix, it reduces the number of independent variables; on the other hand, it avoids the problem that nodes cannot save the dynamic measurement matrix while routing path changes in the process of conventional hybrid compressive sensing.
6 Results and discussions
This section provides some simulations and evaluations of this proposed data aggregating method.
6.1 Performance of data aggregating based on random space sparse compressive sensing
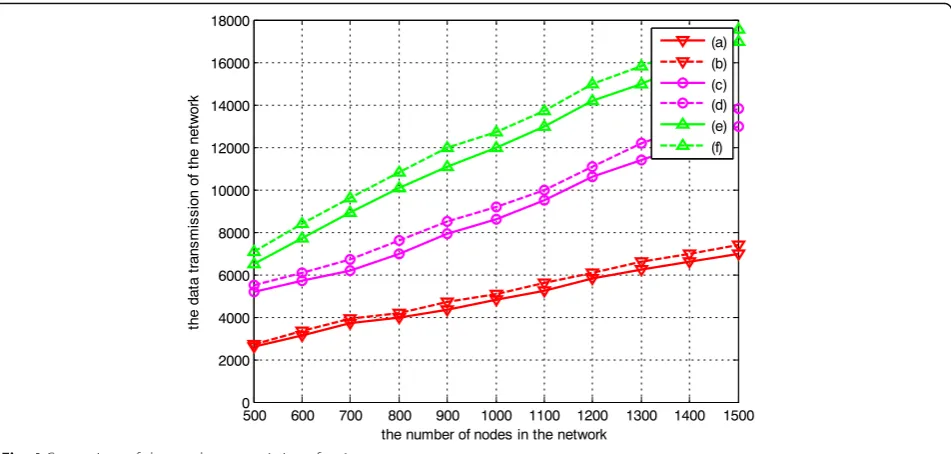
We always assess the performance of methods by using the amount of data packet transmission collected by nodes in the network; the space here is △= 2. We compare six schemes: (a) K-means clustering scheme based on random space sparse measurement matrix, (b) LEACH clustering scheme based on random space sparse measurement matrix, (c) K-means clustering scheme based on Gaussian measurement matrix, (d) LEACH clustering scheme based on Gaussian measurement matrix, (e) K-means clustering scheme without compressive sensing, and (f) LEACH clus-tering scheme without compressive sensing. The number of nodes is increased from 500 to 1500, the transmission ra-dius nodes is 10, and the compressive ratio isρ= M/N.
Figure 4 shows the comparison of data packet trans-mission of various programs when the compressive ratio is ρ= 0.2. Figure 5shows the comparison of data packet transmission of various programs when the compressive ratio is ρ= 0.1. The two values of the compressive ratio
would be a realistic one will be based on the require-ments of the realistic applications, if the high ratio is needed, then selecting high ratio, such as ρ= 0.2, which is related to the crucial importance and know the im-portance of the results.
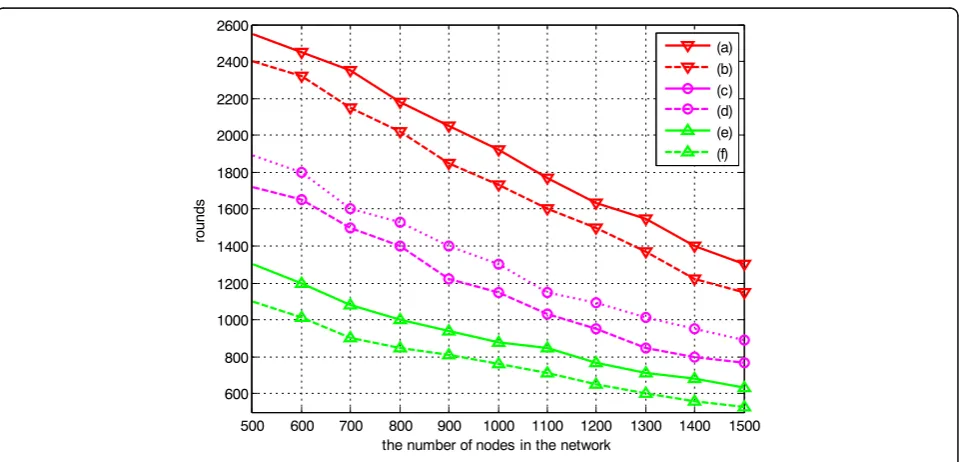
Figure6shows the comparison of the tendency of the network lifecycle changes with the number of nodes when the compressive ratio isρ= 0.1. Figure7shows the comparison of the tendency of the network lifecycle changes with the number of nodes when the compres-sive ratio isρ= 0.2. It can be seen from the figures that the use of compressive sensing obviously prolongs the
network’s lifecycle, while compared to the Gaussian ran-dom matrix, ranran-dom space sparse matrix collects less data packets, thereby further increases the number of rounds of the network.
6.2 Simulation and analysis of energy consumption in network
We also deploy 2000 nodes, and L is 100. Firstly, the network is clustered by K-means or LEACH, then we get
Ncclusters. We use our CS data aggregating method and calculate the energy consumption of the entire network. The sink node is set at the center of sensing field. Given
Fig. 4Comparison of data packet transmission of various programs
the number of measurementsM= 500, in order to meet the target error 0.1, we change the number of cluster head of the network by changing the transmission radius of nodes. We use the transmission radiusR= [50, 30, 25, 22, 18, 14, 11] to represent the number of the cluster headNc= [10, 50, 100, 200, 300, 400, 500].
First, the energy consumption of intra-cluster is simu-lated. We select random space sparse matrix and Gauss-ian matrix to do the comparison, and we also choose the different random space△. As shown in Figs.8 and9((a)
represents as the program using K-means and random space sparse matrix, (b) as the program using LEACH and random space sparse matrix, (c) as the program using K-means and Gaussian random matrix, and (d) as the program using LEACH and Gaussian random matrix), they represent the total energy consumption of intra-cluster including cluster head. If the number of cluster increases, then the energy consumption of intra-cluster decreases. At this time, the transmission of data packet of inter-cluster consumes much energy. As
Fig. 6Comparison of tendency of the network lifecycle changes with the number of nodes
can be seen from the figures, the random space sparse matrix consumes less than the Gaussian matrix due to a large number of zero element.
With the increase of the number of cluster heads, we represent (a) as the program using K-means and random space sparse matrix with △= 2, (b) as the program using LEACH and random space sparse
matrix with △= 2, (c) as the program using K-means and Gaussian random matrix, and (d) as the program using LEACH and Gaussian random matrix.
In addition, with the increase of the number of clus-ters, we represent (a) as the program using K-means and random space sparse matrix with △= 4, (b) as the pro-gram using LEACH and random space sparse matrix
Fig. 8Comparison of change of the energy consumption of intra-cluster
with△= 4, (c) as the program using K-means and Gauss-ian random matrix, and (d) as the program using LEACH and Gaussian random matrix.
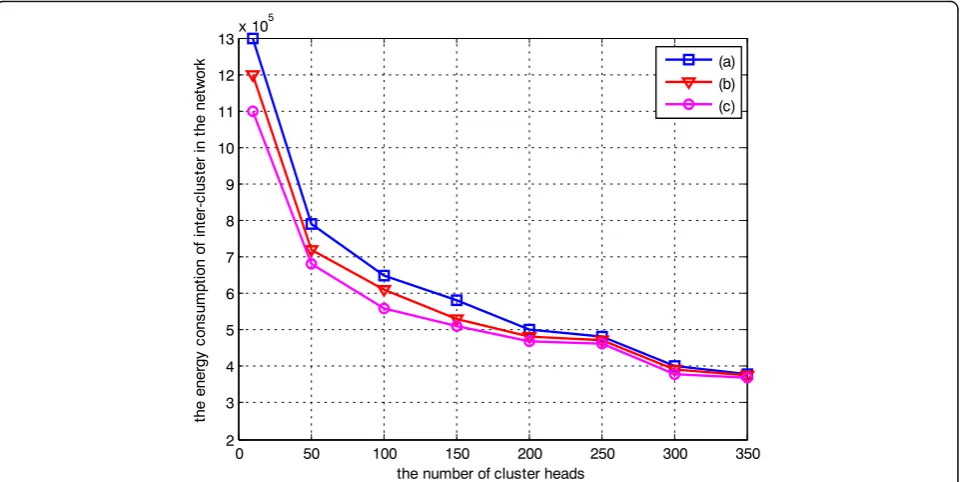
Figure 10 shows that the entire energy consumption of inter-cluster is decreased with the increasing of the number of clusters. We represent (a) as uniform clustering, (b) as LEACH, and (c) as K-means.
Figure 11 shows the trend of the total energy con-sumption of the network. It can be seen from the figure that the use of inter-cluster multi-hop routing signifi-cantly reduces the total energy consumption of the net-work when there are too many clusters. We represent (a) as the use of inter-cluster multi-hop routing and K-means, (b) as the use of inter-cluster multi-hop
Fig. 10Comparison of change of the energy consumption of inter-cluster
routing and LEACH, (c) as the only use of K-means, and (d) as the only use of LEACH.
In addition, we do the comparison experiments on the total consumption of network of WSN with the relative methods [19–27]. When we consider the total consump-tion of network, an abnormal situaconsump-tion occurs (in Fig.12, the abnormal situation regarding new nodes added to the network in the actual applications because of the dy-namic change of the network topology, such as some
nodes go into the relative clusters or some nodes leave the relative clusters, the implication is that the WSN is self-organized based on the requirements of the relative applications), which has added new nodes in the data collection process. In order to consider the worst case, we assume that new nodes are added at the front end of the network. Fifty new nodes are joined in the network every 2 cycles. From the results of Fig.12(in Fig.12, we represent (c) as the method of Reference [19], we
Fig. 12Comparison of the energy consumption of network
represent (b) as the method of Reference [20], we repre-sent (a) as the method of this paper), we can see that our method reduces the total energy consumption of network than that of other methods regardless of intra-cluster or inter-cluster.
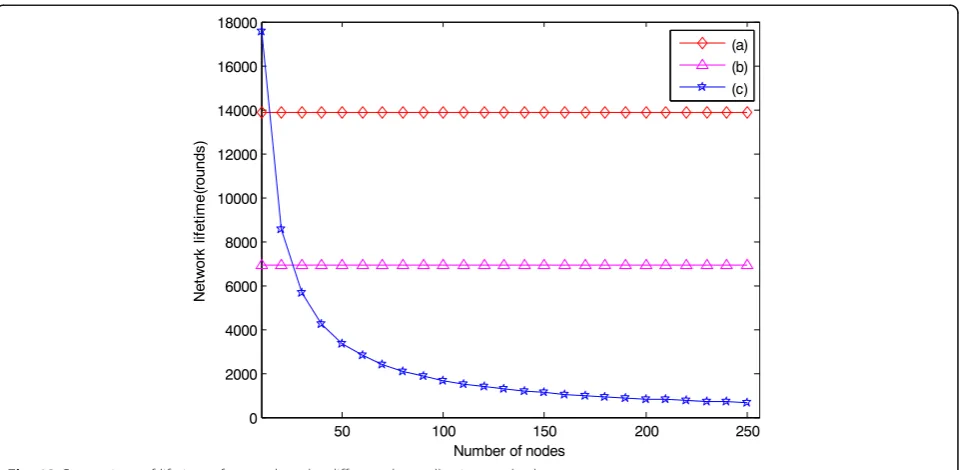
Figure13shows the comparison of lifetime of network under different data collection methods. In Fig. 13, we represent (c) as the method of Reference [21], we repre-sent (b) as the method of Reference [23], and we repre-sent (a) as the method of this paper. From the results of Fig.13, we can see that our method prolongs the lifetime of network than that of other methods.
The algorithm can be described as intra-cluster method based on existing methods and the inter-cluster aggregation based on minimum consumption. The com-mon problem in clustering networks which is the energy balancing during the head selection is well considered by the machine learning process.
The WSNs will inevitably use clustering when the node number is large. It is not a fair comparison be-tween the cluster and non-cluster structure in large-scale networks, so we adopt the overhead of nor-malized network transmission based on the relative weight.
In order to compare our work with other clustering methods and including the machine learning process, the cost of the algorithm (the bandwidth, energy con-sumption caused by the extra communication) is consid-ered on the performance analysis as Fig. 14 ((a) as the method of this paper, (b) as the method of Reference [23], (c) as the method of Reference [21], and (d) as the method of Reference [24]).
From Fig.14, we can see that optimized compressive sens-ing data collection program reduces the overhead of normal-ized network transmission than the un-optimnormal-ized program.
7 Conclusions
A kind of effective data aggregating method based on compressive sensing in WSN is proposed. The method can effectively reduce the energy consumption of the network. The sink node forwards sparse seed to cluster heads. Within a cluster, the cluster head generates its re-quired measurement matrix according to the received sparse seed and then produces the corresponding meas-urement values by using random space sparse compres-sive sensing. Cluster heads forward measurement values to the sink node along the inter-cluster multi-hop rout-ing tree from one cluster to another. The sink node re-constructs the original signal by using the corresponding compressive sensing reconstruction algorithm. We analyze the energy consumption of the algorithm in the network, the relationship between the size of cluster head and the energy consumption of inter-cluster, and the relationship between the size of cluster head and the energy consumption of network. The experimental re-sults show that this method can effectively reduce the energy consumption of the network.
Acknowledgements
This research work is supported by the National Natural Science Foundation of China (Grant No. 61571328), Tianjin Key Natural Science Foundation (No.13JCZDJC34600), CSC Foundation (No. 201308120010), Major projects of science and technology in Tianjin (No.15ZXDSGX 00050), training plan of Tianjin University Innovation Team (No.TD12-5016), major projects of science and technology for their services in Tianjin (No.16ZXFWGX00010,
No.17YFZCGX00360), the Key Subject Foundation of Tianjin (15JCYBJC46500), and training plan of Tianjin 131 Innovation Talent Team (No.TD2015-23).
Funding
The work is partially supported by the following funding: training plan of Tianjin University Innovation Team (No.13-5025).
Availability of data and materials
The data will not be shared due to confidentiality matters.
Authors’contributions
D-gZ designed the algorithm. TZ wrote this paper. JZ did the experimental tests. YD optimized the algorithm and experiments. X-dZ checked the whole paper and figures. All authors read and approved the final manuscript.
Authors’information
De-gan Zhang, Ph.D., graduated from the Northeastern University, China. Now, he is a visiting professor of School of Electronic and Information Engineering, University of Sydney, Sydney, NSW 2006, Australia; professor of Tianjin Key Lab of Intelligent Computing and Novel software Technology, Key Lab of Computer Vision and System, Ministry of Education, Tianjin University of Technology, Tianjin, 300384, China. His research interest includes image processing, service computing, etc.
Ting Zhang, Ph.D., is a member (M) of IEEE in 2012. Now, she is a researcher at Tianjin University of Technology, Tianjin, 300384, China. Her research interest includes WSN, mobile computing, etc.
Jie Zhang (Beijing No.20 High School, Xiaoyingxilu, Haidian District, Beijing 100085, China). His research interest includes image processing, CRN, WSN, and IOT.
Yue Dong, Ph.D., is a researcher at Tianjin University of Technology, Tianjin, 300384, China. Her research interest includes WSN, etc.
Xiao-dan Zhang, Ph.D., is a member (M) of IEEE in 2012. Now, she is a researcher at Institute of Scientific and Technical Information of China, Beijing, 100038, China. Her research interest includes WSN, mobile computing, etc.
Ethics approval and consent to participate
Not applicable.
Competing interests
The authors declare that they have no competing interests.
Publisher’s Note
Springer Nature remains neutral with regard to jurisdictional claims in published maps and institutional affiliations.
Author details
1
Key Laboratory of Computer Vision and System, Tianjin University of Technology, Ministry of Education, Tianjin 300384, China.2Tianjin Key Lab of Intelligent Computing and Novel Software Technology, Tianjin University of Technology, Tianjin, China.3Beijing No. 20 High School, Xiaoyingxilu, Haidian District, Beijing 100085, China.4Institute of Scientific and Technical Information of China, Beijing 100038, China.
Received: 22 February 2018 Accepted: 5 June 2018
References
1. C Luo, W F, J Sun, Efficient measurement generation and pervasive sparsity for compressive data gathering. IEEE Trans. Wirel. Commun.9(12), 3728– 3738 (2011)
2. DG Zhang, G Li, K Zheng, An energy-balanced routing method based on forward-aware factor for wireless sensor network. IEEE Trans Ind Inf10(1), 766–773 (2014)
3. YY Xiao, Time-ordered collaborative filtering for news recommendation. China Commun12(12), 53–62 (2015)
4. DG Zhang, X Wang, XD Song, A novel approach to mapped correlation of ID for RFID anti-collision. IEEE Trans. Serv. Comput.7(4), 741–748 (2014) 5. XD Zhang, Design and implementation of embedded un-interruptible
power supply system (EUPSS) for web-based mobile application. Enterp Inf Syst6(4), 473–489 (2012)
6. S Yi, J Heo, Y Cho, PEACH: power-efficient and adaptive clustering hierarchy protocol for wireless sensor networks. Comput. Commun.30(14–15), 2842– 2852 (2007)
7. K Zheng, Novel quick start (QS) method for optimization of TCP. Wirel. Netw22(1), 211–222 (2016)
8. K Zheng, T Zhang, A novel multicast routing method with minimum transmission for WSN of cloud computing service. Soft. Comput.19(7), 1817–1827 (2015)
9. HL Niu, Novel PEECR-based clustering routing approach. Soft. Comput. 21(24), 7313–7323 (2017)
10. DG Zhang, A new approach and system for attentive mobile learning based on seamless migration. Appl. Intell36(1), 75–89 (2012)
11. YN Zhu, A new constructing approach for a weighted topology of wireless sensor networks based on local-world theory for the Internet of Things (IOT). Comput Math Appl64(5), 1044–1055 (2012)
12. XJ Kang, A novel image de-noising method based on spherical coordinates system. EURASIP J Adv Sig Process2012(110), 1–10 (2012).https://doi.org/ 10.1186/1687-6180-2012-110
13. J Haupt, WU Bajwa, Toeplitz compressed sensing matrices with applications to sparse channel estimation. IEEE Trans. Inf. Theory56(11), 5862–5875 (2010) 14. C Zhang, HR Yang, Compressive sensing based on deterministic sparse Toeplitz measurement matrices with random pitch. Acta Automat. Sin. 38(8), 1362–1369 (2012)
15. YP Liang, A kind of novel method of service-aware computing for uncertain mobile applications. Math Comput Model57(3–4), 344–356 (2013) 16. S Zhou, New mixed adaptive detection algorithm for moving target with
big data. J Vibroengineering18(7), 4705–4719 (2016)
17. R Devore, Deterministic constructions of compressed sensing matrices. J. Complex.23(4), 918–925 (2007)
18. R Calderbank, S Howard, Construction of a large class of deterministic sensing matrices that satisfy a statistical isometry property. IEEE J Sel Top Sig Proces4(2), 358–374 (2009)
19. B Malathi, Data collection based hybrid compressive sensing in wireless sensor networks. Int J Adv Inf Sci Technol (IJAIST)4(2), 2319–2682 (2015) 20. GK Nigam, Effective compressive sensing for clustering in wireless sensor
networks. Ind J Sci Technol9(38), 0974–5645 (2016)
21. KA Shabna, Cluster method using hybrid compressive sensing for sensor network. Int J Modern Trends Eng Res (IJMTER)2(5), 2349–9745 (2015) 22. M Kumar, S Verma, Clustering approach to data aggregation in wireless
sensor networks. 16th IEEE Int Conference Netw1(1), 125–135 (2008) 23. A Rajalakshmi, T Mohanraj, Efficient data transmission in wireless sensor
networks using hybrid compressive sensing. J Recent Res Eng Technol2(3), 2349–2252 (2015)
24. P Sukumar, B Sowmya, Effective hybrid compressive sensors using wireless networks in clustering methods. Int J Comput Sci Trends Technol (IJCST) 4(2), 110–119 (2016)
25. B Ameena, M Biradar, The hybrid compressive sensing data collection method in cluster structure for efficient data transmission in WSN. Int J Sci Res (IJSR)4(6), 210–219 (2015)
26. NV Deshmukh, AV Deorankar, Consuming less energy in hybrid compressive sensed WSN. Natl Conference Adv Computing, Commun Netw1(1), 30–40 (2016)
27. X Wang, XD Song, New medical image fusion approach with coding based on SCD in wireless sensor network. J Electr Eng Technol10(6), 2384–2392 (2015)
28. Z Ma, Shadow detection of moving objects based on multisource information in Internet of Things. J Exp Theor Artif Intell29(3), 649–661 (2017)
29. WB Li, Novel fusion computing method for bio-medical image of WSN based on spherical coordinate. J Vibroengineering18(1), 522–538 (2016) 30. XD Song, X Wang, New agent-based proactive migration method
and system for big data environment (BDE). Eng. Comput.32(8), 2443–2466 (2015)
31. WB Li, Novel ID-based anti-collision approach for RFID. Enterp Inf Syst10(7), 771–789 (2016)
32. DL Donoho, Compressed sensing. IEEE Trans Inform Theory52(4), 1289– 1306 (2006)
33. S Zhou, New Dv-distance method based on path for wireless sensor network. Intell Autom Soft Comput23(2), 219–225 (2017)
35. S Liu, T Zhang, Novel unequal clustering routing protocol considering energy balancing based on network partition & distance for mobile education. J. Netw. Comput. Appl.88(15), 1–9 (2017).https://doi.org/10. 1016/j.jnca.2017.03.025
36. X Zhang, X Zhang, G C, A micro-artificial bee colony based multicast routing in vehicular ad hoc networks. Ad Hoc Netw.58(4), 213–221 (2017) 37. KS He, YQ Li, CC Yin, A novel compressed sensing-based non-orthogonal
multiple access scheme for massive MTC in 5G systems. EURASIP J. Wirel. Commun. Netw.2018(81), 1–12 (2018)
38. JF Wan, B Zeng, A scalable and quick-response software defined vehicular network assisted by mobile-edge computing. IEEE Commun. Mag.55(7), 94–100 (2017)
39. DY Jia, High-efficiency urban-traffic management in context-aware computing and 5G communication. IEEECommunications Mag55(1), 34–40 (2017)
40. QR Wang, P Deng, A survey on position-based routing for vehicular ad hoc networks. Telecommun. Syst.62(1), 15–30 (2016)
41. S Zhou, YM Tang, A low duty cycle efficient MAC protocol based on self-adaption and predictive strategy. Mob Netw Appl2(2017).https://doi.org/ 10.1007/s11036-017-0878-x
42. Z Ma, A novel compressive sensing method based on SVD sparse random measurement matrix in wireless sensor network. Eng. Comput.33(8), 2448– 2462 (2016)
43. H LNiu, Novel positioning service computing method for WSN. Wirel. Pers. Commun.92(4), 1747–1769 (2017)
44. X Wang, A kind of novel VPF-based energy-balanced routing strategy for wireless mesh network. Int. J. Commun. Syst.30(6), 1–15 (2017) 45. XD Song, X Wang, Extended AODV routing method based on
distributed minimum transmission (DMT) for WSN. Int J Electron Commun69(1), 371–381 (2015)
46. CP Zhao, A new medium access control protocol based on perceived data reliability and spatial correlation in wireless sensor network. Comput Electric Eng38(3), 694–702 (2012)