Light elements synthesized in the He-layer and
the H-rich envelope of a type II supernova, III
—In
fl
uence of the nuclear reprocessing after the mixing—
Takashi Yoshida1, Hiroyuki Emori2, and Kiyoshi Nakazawa2
1Department of Physics, Kyushu University, Ropponmatsu, Fukuoka 810-8560, Japan
2Department of Earth and Planetary Sciences, Tokyo Institute of Technology, Meguro-ku, Tokyo 152-8551, Japan
(Received October 5, 2000; Accepted April 22, 2001)
This is the third paper of a series of our papers, in which we have investigated explosive nucleosynthesis of the X-elements (Li, Be, and B) and the CNO-elements in supernova explosions. We concentrate here on evaluating the varieties of the isotopic/elemental ratios of the light elements due to the mixing process between the He-layer and the H-rich envelope of a supernova taking account of nuclear reprocessing after the mixing. Almost all of the X-elements are influenced strongly by the nuclear reprocessing after the mixing; theX-elements produced in the He-layer are decomposed by protons in the H-rich envelope even if the He-component mixes with a bit of the H-component. The p-rich isobars of7Li and11B, namely7Be and11C, are not decomposed in the mixture, so that
the11B/7Li ratio is determined by the11C/7Be ratio after7Li and11B are completely decomposed. On the other
hand, the CNO-elements are almost free from the nuclear reprocessing after the mixing. The small ratios of6Li/7Li
and9Be/7Li, and the diagram of11B/7Li-12C/13C obtained in the previous studies are still valid.
1. Introduction
Presolar grains have been identified with large isotopic heterogeneities of several orders of magnitude and their large isotopic heterogeneities suggest us that isotopic traces of nucleosynthetic processes remain in these grains (e.g., Zinner, 1998). Until now, some presolar grains have been identified as supernova origin on the basis of the carbon iso-topic ratio, the 28Si excess, and the 44Ca excess from the
radioactive decay of44Ti (Amariet al., 1992, 1995; Nittler et al., 1996). However, some of the grains show the other isotopic ratios inconsistent with those predicted from super-nova nucleosynthesis theory (Travaglioet al., 1999). Our poor understanding on this problem is due, at least partly, to the lack of theoretical studies of supernova nucleosyn-thesis which have challenged the comparison between the isotopic ratios of the elements produced in supernovae and those obtained from presolar grains (e.g., Meyeret al., 1995; Travaglioet al., 1999). In most cases, theoretical studies of supernova nucleosynthesis have aimed at the overall element production in supernovae to interpret the solar-system com-position (e.g., Woosleyet al., 1990; Woosley and Weaver, 1995; Thielemannet al., 1990, 1996).
Our interest is to understand extensively the isotopic/el-emental ratios of elements ejected from supernovae and to establish methods forfinding presolar grains from a super-nova. We have studied the varieties of the isotopic/elemental ratios of the X-elements (Li, Be, and B) and the CNO-el-ements synthesized in the He-layer and the H-rich envelope
Copy right cThe Society of Geomagnetism and Earth, Planetary and Space Sciences (SGEPSS); The Seismological Society of Japan; The Volcanological Society of Japan; The Geodetic Society of Japan; The Japanese Society for Planetary Sciences.
of a 16.2Msupernova which corresponds to a 20M zero-age main sequence star (Shigeyama and Nomoto, 1990). In Yoshidaet al. (2000a) which hereafter is referred to as Pa-per I, we investigated the influence of the adopted neutrino emission model and presented useful diagrams composed of two kinds of isotopic/elemental ratios. In Yoshidaet al. (2000b) which hereafter is referred to as Paper II, we stud-ied the explosive nucleosynthesis using modeled chemical compositions composed of four elements as1H,4He,12C,
and16O. Combining probable ranges of the chemical
com-positions in the presupernova stage, we refined the diagrams. The results of the two papers are summarized as follows:
1) Among the X-elements, 7Li and 11B are synthesized
appreciably in the He-layer and the inner H-rich enve-lope of a supernova and10B is also synthesized in the
He-layer. The amounts of these elements depend on the adopted neutrino emission model rather than the chem-ical compositions in the presupernova stage.
2) In the convective He-layer, 13C, 14N, 15N, and 17O
among the CNO-elements are synthesized during the supernova explosion. The amounts of these elements depend on the neutrino emission model but the varieties are confined within a factor of 10 or so. Furthermore, stable isotopes12C,16O, and18O keep their amounts in
the presupernova stage.
3) In the radiative He-layer and the H-rich envelope where the shock temperature is lower than 1.4×10⁸ K, the
CNO-elements are scarcely synthesized during the su-pernova explosion.
4) Presolar grains from a supernova are certainly distin-guishable by the use of the diagrams of 11B/7 Li-12C/13C,14N/15N-12C/13C, and16O/17O-12C/13C.
Addi-tionally, we can say that presolar grains with very small
6Li/7Li and9Be/7Li ratios (6Li/7Li <
∼ 3×10⁻⁵ and
9Be/7Li<
∼2×10⁻⁴) are supernova origin.
Other than the neutrino emission and the chemical com-positions in the presupernova stage, there is the possibil-ity that the explosive nucleosynthesis is influenced by mix-ing between layers durmix-ing the supernova explosion. Some authors pointed out theoretically that the Rayleigh-Taylor instability should take place during supernova explosions (Chevalier, 1976; Ebisuzakiet al., 1989) and, as a result, would lead to large scale mixing in the ejecta (e.g., Hachisu et al., 1990, 1992, 1994; Fryxellet al., 1991; Herant and Woosley, 1994). Further, it is suggested that the convective instability just above a proto-neutron star enables success-ful explosion of the supernova (Herantet al., 1992; Burrows and Fryxell, 1992; Burrowset al., 1995). Although no sil-icate grains have been observed in SN 1987A, existence of large scale mixing during the supernova explosion is also supported by observations of light curve,γ-ray spectra, in-frared spectra, and so on, for SN 1987A (e.g., Arnett and Fu, 1989; Fu and Arnett, 1989; Shigeyama and Nomoto, 1990; Wooden, 1997).
Large scale mixing during supernova explosions has in-fluences on our problem in two ways: one is that the mixing brings about a chemical blend between two mixedfluid el-ements (hereafter such mixing will be called “the mechan-ical mixing”) and the other is that new nucleosynthetic re-actions are activated by the mixing and the chemical com-position of the mixture varies not only by the mechanical mixing but also by “the nuclear reprocessing after the mix-ing”. In Paper I and Paper II, we have already taken account of the former effect in constructing the diagrams between two isotopic/elemental ratios but not the latter effect. Since the Rayleigh-Taylor instability occurs just after the shock arrival to the He/H boundary and develops with the charac-teristic time of dynamical motion (e.g., Herant and Woosley, 1994), the temperature in the mixture may be high enough to induce new kinds of nucleosynthesis. In this study, we will concentrate ourselves on the study of the nuclear reprocess-ing after the large-scale mixreprocess-ing between the He-layer and the H-rich envelope.
In Section 2, we describe in short the explosion model of a 16.2Msupernova, the nuclear reaction network, and the initial chemical compositions, all of which were constructed in Paper I. Furthermore, we explain how to describe the mix-ing durmix-ing the supernova explosion. The mixmix-ing is simply modeled by four parameters, i.e., the locations of twofluid elements which will be mixed, the time of mixing, and the mixing ratio between the twofluid elements. In Section 3, we describe in detail, as a typical example, how the abun-dance of7Li is influenced by the nuclear reprocessing after
the mixing as well as the adopted parameters of the mixing model. In addition, we present briefly influences of the nu-clear reprocessing on the abundances of the other light ele-ments comparing with the results in the case of the mechan-ical mixing. In Section 4, we show the varieties of6Li/7Li,
9Be/7Li, and11B/7Li ratios which are caused by the nuclear
reprocessing after the mixing. We summarize numerical re-sults obtained in this study in Section 5 and construct a di-agram of the ratios of11B/7Li and12C/13C adding the effect
of the nuclear reprocessing after the mixing.
2. Method of Calculation
2.1 Model of supernova explosion
In this study, we adopt quite the same supernova explo-sion model as that presented in Paper I. In this model, shock propagation is described on the basis of “the generalized Se-dov solution” of a spherically symmetric strong shock wave in the medium with one power law density profile (Sedov, 1959). The power law density profile isfitted to the density structure of 14E1 model written in Shigeyama and Nomoto (1990), i.e., a 16.2 M presupernova model which corre-sponds to a 20 M zero-age main sequence star (see fi g-ures 2 and 3 in Paper I).
We also make use of our nuclear reaction network, de-scribed in Paper I, which consists of 52 species of nuclei from1H to23Mg. All reactions in this network are compiled
in Yoshida (2000). Neutrino-induced reactions (Woosleyet al., 1990), so-called theν-process, are also included in our reaction network and their reaction rates are adopted from Hoffman and Woosley (1992). For parameters governing theν-process, we use the same values as those of Paper I, i.e., temperatures of neutrinoflavors are taken to be
Tνe=Tν¯e=4 MeV/k and
Tνμ=Tνμ¯ =Tντ =Tντ¯ =8 MeV/k,
(1)
wherekis Boltzmann constant. For the total energy carried by neutrinos,Eν, and the decay time of neutrinoflux,τν, we
put to be the standard values of Paper I, i.e.,
Eν =3×1053erg and τν=3 s, (2)
in most cases. Only when we construct a diagram between two isotopic ratios in Section 5, we also consider additional four cases (see Paper I):
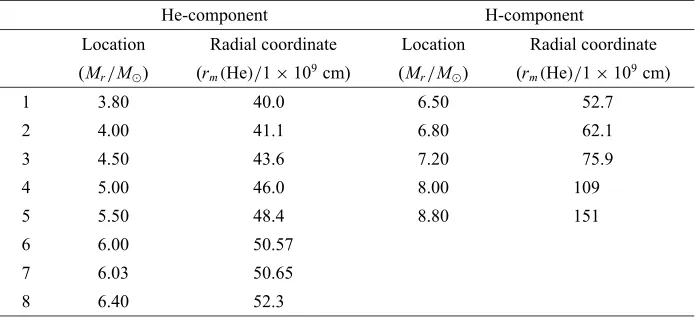
Table 1. Original locations of the He-component,Mm(He), and the H-component,Mm(H). These locations are written in terms of the mass coordinate. For the later convenience, we also show the corresponding radial coordinates,rm(He)andrm(H)at the time when the shock front arrives at the He/H boundary. The radial coordinates are written in the unit of 1×109cm. Note that the He-components at locations 7 and 8 are in the radiative He-layer.
He-component H-component
Location Radial coordinate Location Radial coordinate
(Mr/M) (rm(He)/1×109cm) (Mr/M) (rm(He)/1×109cm)
1 3.80 40.0 6.50 52.7
2 4.00 41.1 6.80 62.1
3 4.50 43.6 7.20 75.9
4 5.00 46.0 8.00 109
5 5.50 48.4 8.80 151
6 6.00 50.57
7 6.03 50.65
8 6.40 52.3
2.2 Model of mixing between the He-layer and the H-rich envelope
A progenitor of a type II supernova consists of several lay-ers with different chemical compositions. At each boundary of these layers there is a density gap because of the discon-tinuity of the mean molecular weight and the condiscon-tinuity of the temperature as well as the pressure at the boundary. The gap at the boundary between the He-layer and the H-rich en-velope is expressed in terms of the densities of the top of the He-layer,ρHe, and the bottom of the H-rich envelope,ρHas
ρHe−ρH ρHe+ρH =
μHe−μH
μHe+μH =0.32, (5)
whereμHe(= 1.34)andμH(= 0.69)are the mean
molec-ular weights in the He-layer and the H-rich envelope, re-spectively (see section 3.4 in Paper I). Owing to the den-sity gap, these layers become unstable against the Rayleigh-Taylor instability near the boundary after the shock passage (Ebisuzakiet al., 1989). Sincefluid elements decelerate be-hind the shock front,fluid elements of the heavy He-layer feel relatively strong outward inertia force and penetrate into the H-rich envelope. The outward inertia force per unit mass is almost equal to the pressure gradient (Chevalier, 1976).
Recently, some authors have conducted hydrodynamical simulations of the Rayleigh-Taylor instability during super-nova explosions (e.g., Hachisuet al., 1990). In their stud-ies,fluid elements in the He-layer penetrate into the H-rich envelope in the form of plumes with mushroom-like struc-ture. However, it is difficult to see detailed microscopic pro-cesses of the mixing in the hydrodynamical simulations. So, on the basis of the hydrodynamical simulations of the mix-ing, we construct the model of the mixing between the He-component and the H-He-component:
1) Original location of thefluid elements in the He-layer isMm(He), and that in the H-rich envelope isMm(H).
Note that the locations are presented in terms of the mass coordinate.
2) The twofluid elements mix each other attm after the
shock front passes the boundary.
3) The mixing ratio between the twofluid components is x.
4) The pressure and the temperature of the mixture are determined so as to balance with those of surrounding matter.
For the original locations of the He-component,Mm(He),
and the H-component, Mm(H), we consider eight and five
cases, respectively. They are tabulated in Table 1 together with the corresponding radial distances,rm(He)andrm(H),
at the time when the shock front arrives at the He/H bound-ary. According to the hydrodynamical simulations, He-com-ponents penetrate into the outer region of the H-rich en-velope with a mushroom-like feature (e.g., Hachisuet al., 1992; Herant and Woosley, 1994). However, we do not con-sider such a distant mixing because the nuclear reprocessing after the mixing does not occur practically in such mixing, as will be shown in Section 3.
The mixing time,tm, is chosen as follows:
tm=ta+τm, (6)
where ta is the time when the shock arrives at the He/H
boundary andτmis the time interval between the shock
ar-rival time and the mixing time. The time interval,τm, should
be of the order of the growth time of the Rayleigh-Taylor in-stability,τRT, given by (e.g., Chandrasekhar, 1981)
τRT=1/
ρHe−ρH ρHe+ρHκ
−ρ1
∂P
∂r
, (7)
whereκ is the azimuthal wave number of perturbations. In this study we defineτmas
τm=cm
√
κlτRT, (8)
wherecm is a numerical parameter. We setcm to be 0.5, 1
(the standard value), 2, and 5 and setlto berm(H)−rm(He).
mixing ratios,x:
x =0,1×10−5,1×10−4,1×10−3,2×10−3,
5×10−3,1×10−2,2×10⁻², (9)
5×10−2,0.1,0.3,0.5,0.7,0.9,1.
In the above, the case ofx =0 corresponds to a pure He-component and that of x = 1 corresponds to a pure H-component.
The pressure of the mixture,Pm, should become quite the
same as that of the surrounding gas of the H-rich envelope. The temperature of the mixture,Tm, is expected to be nearly
equal to that of the surrounding H-rich envelope. So in this study we simply put to be
Pm=PH and Tm=TH for t≥tm, (10)
wherePHandTHare the pressure and the temperature of the
surrounding H-rich envelope, respectively. In this case, the density of the mixture is found to be
ρm=μm
μHρH for t ≥tm. (11)
In the above, ρH is the density of the surrounding H-rich
envelope and the mean molecular weight of the mixture,μm,
is given by
wherexis the mixing ratio mentioned above.
3. Nuclear Reprocessing Due to the Mixing
3.1 Typical example of the nuclear reprocessing—Case of7Li
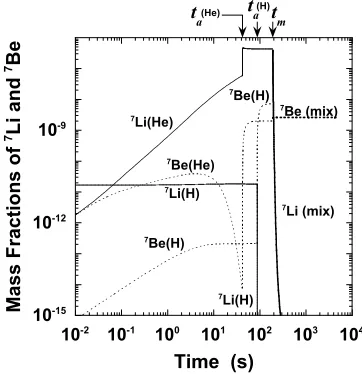
In Fig. 1, time variation of the abundances of 7Li and
its unstable isobar, 7Be, is shown in the case ofx = 0.1, cm =1,Mm(He)=5.5M, andMm(H)=6.5M(which corresponds to the bottom of the H-rich envelope). Further-more,taandtmare the time of the shock arrival and the time
of the mixing, respectively. Before the shock arrival, both
7Li and7Be are produced through theν-process in the
He-component; the main production paths of7Li and 7Be are 4He(ν, νp)3H(α, γ )7Li and 4He(ν, νn)3He(α, γ )7Be,
re-spectively. At the same time,7Be is decomposed through 7Be(n,p)7Li. In the H-component,7Be is formed through
the same production process as in the He-component but7Li
keeps its initial abundance. After the shock arrival to the He-component,7Li and7Be are produced explosively through 3H(α, γ )7Li and3He(α, γ )7Be. The abundance of7Li in the
He-component attains to 4×10⁻⁷. In the H-component,7Be
is produced explosively after the shock arrival but the abun-dance of7Li rapidly decreases owing to decomposition by
protons.
As soon as the He-component and the H-component mix each other at the time,tm, the abundance of7Li in the
mix-ture decreases rapidly; 7Li which is abundant in the
He-component is decomposed by protons which are abundant in the H-component through7Li(p, αγ )4He. However, p-rich
isobar,7Be, is not decomposed even after the mixing. Thus,
10-15
Fig. 1. Time variation of the abundances of 7Li (solid lines) and 7Be (dotted lines). Symbols He and H in parentheses denote of the
He-component at Mm(He) = 5.5 M and of the H-component at
Mm(H) = 6.5 M, respectively. Bold lines are of the mixture with the mixing ratio,x, equal to 0.1.
thefinal abundance of7Li is determined by the abundance
of7Be remained in the mixture.
Next, thefinal abundances of7Li with different locations
of the He-component,Mm(He), and the mixing ratio,x, are
shown in Fig. 2. Figures 2(a) and (b) are in the cases of Mm(He)=3.8 M(the innermost region of the He-layer) and 6.0M(the outermost region), respectively. The origi-nal location of the H-component,Mm(H), isfixed to be 6.5
M in bothfigures. Solid line and dotted line denote the final abundances of7Li and7Be, respectively, in the case of
the mechanical mixing (i.e., the case that the nuclear repro-cessing is not considered). In Fig. 2(a), thefinal abundance of7Li in the mixture agrees with the solid line, i.e., the
nu-clear reprocessing after the mixing does not occur practi-cally. This is due to the fact that, as shown in Paper I,7Li
is originally produced as7Be in the inner region of the
He-layer and that7Be is not decomposed by protons even after
the mixing in this case (see Fig. 1).
As seen from Fig. 2(b), on the other hand, the mixture with the He-component from the outer region, namely Mm(He) >∼5.0 M, thefinal abundance of7Li behaves dif-ferently from the previous case. When the mixing ratio, x, is smaller than 1×10−3,7Li is not decomposed because of
a shortage of proton abundance. When 2×10⁻³ <
∼ x <∼
2×10⁻², the abundance of7Li decreases with an increase
in the mixing ratio; this is brought about by the decompo-sition of7Li through7Li(p, αγ )4He in the mixture. In the
case ofx >∼ 2×10−2,7Li is completely decomposed and
thefinal abundance of7Li is determined by that of7Be
un-processed by the mixing. In the case of the mixing with the He-component from the radiative He-layer, the behavior of the abundance of7Li in the mixture is similar to this.
Figure 2(b) also shows the influence of the mixing time, cmon thefinal abundance of7Li. With an increase incm, the
10-9
10-8
10-7
10-6
10-5 10-4 10-3 10-2 10-1 100
Mass Fraction of
7 Li
x (a)
10-9
10-8
10-7
10-6
10-5 10-4 10-3 10-2 10-1 100
Mass Fraction of
7 Li
x (b)
Fig. 2. The final abundances of7Li in the mixture in the cases of
Mm(He) = 3.8M(panel (a)) and 6.0M(panel (b)). The location of the H-component isfixed to beMm(H) =6.5M. The horizontal axis denotes the mixing ratio,x. Open circles are the abundances of7Li
in the mixtures in the case ofcm = 1 (see Subsection 2.2). In panel (b), crosses, squares, and diamonds are the abundances in the cases of
cm = 0.5, 2, and 5, respectively. Solid line and dotted line show the
final abundance of7Li and the abundance of7Be produced during the
explosion, respectively, in the case of the mechanical mixing.
the mixing ascmbecomes larger, namely the mixing timeτm
does, too. In the case ofcm =5, the abundance of7Li almost
agrees with the solid line, i.e.,7Li is scarcely decomposed
by protons in this case.
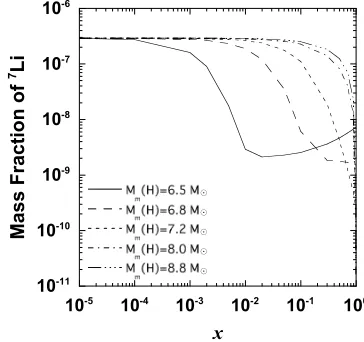
In Fig. 3, we show the abundances of7Li in the mixtures
between the H-component with various original locations of Mm(H)and the He-component with Mm(He) = 6.0 M. For largeMm(H),7Li suffers the nuclear reprocessing in the
mixture at large mixing ratio, i.e., the nuclear reprocessing becomes less effective when Mm(H)is large. In the case
of Mm(H) = 6.8 M, 7Li is completely decomposed and only7Be remains whenx >
∼0.3. On the other hand, in the cases ofMm(H)= 8.0 M and 8.8 M, the abundance of 7Li is almost equal to the corresponding abundance in the
case of the mechanical mixing. The abundances of the other light elements behave similarly in such mixing between the fluid elements which are at a long distance at the pre-mixing
10-11
10-10
10-9
10-8
10-7
10-6
10-5 10-4 10-3 10-2 10-1 100
Mass Fraction of
7 Li
x
Fig. 3. The same as Fig. 2 but in the cases with variousMm(H). The location of the He-component isMm(He)=6.0Mandcmisfixed to be 1.
stage. Thus, we do not need to consider such mixing with Mm(H) >∼8.8M, which hereafter we call the distant mix-ing.
3.2 Reprocessing on the otherX-elements
3.2.1 11B We will consider the nuclear reprocessing
on11B after the mixing. The abundances of11B in the
mix-ture in the cases ofMm(He)=3.8Mand 6.0Mare pre-sented in Figs. 4(a) and (b), respectively (Mm(H)isfixed to
be 6.5M). In thesefigures, the abundance of11B decreases
with an increase in the mixing ratio,x, and converges to the abundance of11C in the mixture at the shock arrival to the
He/H boundary shown by the dotted line, as same as the case of7Li. As seen in Paper I,11B is also formed as the decay
product of11C as in the case of7Li which is also produced
from 7Be. The production reactions are7Li(α, γ )11B and 12C(ν, νp)11B for11B and7Be(α, γ )11C and12C(ν, νn)11C
for11C. Then, although11B is decomposed by protons in the
mixture, itsp-rich isobar,11C, remains even after the mixing
and decays into11B. In the case ofM
m(He)=6.0M,11B is completely decomposed whenxis larger than 2×10⁻².
On the other hand, the mixing ratio more than 0.3 is needed to decompose11B completely in the case ofM
m(He)=3.8
M. This is because it takes longer time to mix and the max-imum temperature in the mixture is lower in the latter case than in the former.
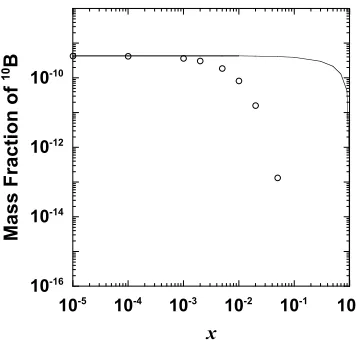
3.2.2 10B Figure 5 shows the abundance of10B in the
mixture between the He-component (Mm(He) = 6.0 M) and the H-component (Mm(H)=6.5 M). Note that there is no10B in the H-component as presented in Paper I. When x<∼1×10⁻³, thefinal abundance of10B is almost equal to
that of the mechanical mixing (which is shown by the solid line in Fig. 5). On the other hand, whenx >∼1×10⁻³, the
abundance of10B becomes small compared with that of the
mechanical mixing. This is apparently because the nuclear reprocessing on10B occurs, i.e.,10B is decomposed through 10B(p, α)7Be in the mixture. Differently from the cases of 7Li and11B,10B has no p-rich isobars which are not
10-12
10-11
10-10
10-9
10-8
10-7
10-5 10-4 10-3 10-2 10-1 100
Mass Fraction of
11 B
x (a)
10-12
10-11
10-10
10-9
10-8
10-7
10-5 10-4 10-3 10-2 10-1 100
Mass Fraction of
11 B
x (b)
Fig. 4. The same as Fig. 2, but for thefinal abundances of11B in the cases
ofMm(He)=3.8M(panel (a)) and 6.0M(panel (b)). The location of the H-component isfixed to beMm(H)=6.5Mandcmisfixed to be 1. Solid line and dotted line show thefinal abundances of11B and11C,
respectively, in the case of the mechanical mixing at the shock arrival to the He/H boundary.
10-16
10-14
10-12
10-10
10-5 10-4 10-3 10-2 10-1 100
Mass Fraction of
10 B
x
Fig. 5. Thefinal abundances of10B (open circles) in the mixture
be-tween the He-component atMm(He)=6.0Mand the H-component atMm(H)=6.5M(cm =1). Solid line shows the abundance in the case of the mechanical mixing.
10-20
10-18
10-16
10-14
10-12
10-5 10-4 10-3 10-2 10-1 100
Mass Fraction of
6 Li
x (a)
10-20
10-18
10-16
10-14
10-12
10-5 10-4 10-3 10-2 10-1 100
Mass Fraction of
9 Be
x (b)
Fig. 6. The same as Fig. 5, but for the abundances of6Li (panel (a)) and 9Be (panel (b)).
3.2.3 6Li and9Be In Figs. 6(a) and (b) the abundances
of 6Li and9Be are shown, respectively, in the mixture
be-tween the He-component at Mm(He) = 6.0 M and the H-component at Mm(H) = 6.5 M. As seen from these figures, both6Li and9Be are influenced strongly by the
nu-clear reprocessing even if the mixing ratio is as small as x 1 ×10⁻³. In this case 6Li is decomposed through 6Li(p, α)3He and9Be is decomposed through9Be(p, α)6Li
and9Be(p,dα)4He.
We showed in Paper I and Paper II that both 6Li and 9Be are not produced in the inner region of the He-layer
(Mr <∼ 5.2 M). In this study, we confirm again that6Li and9Be are not produced even in the mixture between the
He-component and the H-component. Thus, the abundances of6Li and9Be are small except outer region of the He-layer
and become extremely small in the mixture contaminated by only small fraction of the H-component.
3.3 Reprocessing on the CNO-elements
The abundances of 13C are illustrated in Fig. 7 in the
cases where the He-components atMm(He)=3.8, 5.0, 6.0,
and 6.4 M mix with the H-component at Mm(H) = 6.5
M. The parameter cm is taken to be 1. Four lines
al-10-8
10-6
10-4
10-5 10-4 10-3 10-2 10-1 100
Mass Fraction of
13 C
x 3.8 5.0
6.0 6.4
Fig. 7. Thefinal abundances of13C (open circles) in the mixture in the
cases of Mm(He) = 3.8M, 5.0M, 6.0M, and 6.4M(Mm(H) isfixed to be 6.5M). Lines show the corresponding abundances of the mechanical mixing and the number attached to each line denotes the location of the He-component.
most perfectly free from the nuclear reprocessing after the mixing, i.e., the13C abundance is determined by the
me-chanical mixing. Speaking in detail, only in the case of Mm(He) = 6.0 M andcm equal to 0.5, the temperature
of the mixture is relatively high and a bit of increment of
13C (through12C(p, γ )13N(,e+νe)13C) is observed after the
mixing. However, in all cases where cm ≥ 1 we see no
apparent changes of the13C abundance. Furthermore, the
other choice ofMm(H)does not change the above result on
13C since such a choice gives the temperature of the mixture
lower than that in the case of Fig. 7.
We observe no nuclear reprocessing after the mixing for the other CNO-elements, including15N which seems to be
fragile to protons (oppositely, 15N is slightly produced in
the case ofcm=0.5). Thus, we can say that the abundances
of the CNO-elements are determined by theν-process and explosive nucleosynthesis and are free from the nuclear re-processing after the mixing, except the mechanical mixing, even if there occurs large scale mixing during the supernova explosion.
4. Effects of Mixing on the Isotopic Ratios of the
X-Elements
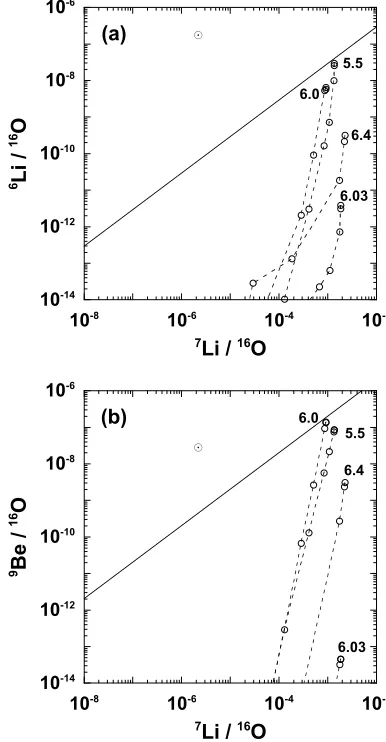
4.1 The6Li/7Li and9Be/7Li ratios
The diagram of 6Li/16O-7Li/16O ratios is presented in
Fig. 8(a) which is the same form as that infigure 8(a) in Pa-per I. Hereafter, we present the number ratio of two species as an abundance ratio. Markers linked by the dashed line are the ratios in the mixtures of which He-components come from the same location in the He-layer. The6Li/16O ratio
is decreased more drastically than the7Li/16O ratio by the
mixing irrelevant to the mixing ratio and to the location of the He-component. This is due, of course, to the fact that
6Li is more fragile than7Li to the irradiation of protons
fol-lowed by the mixing. We see that all markers linked with dashed lines are below the bold line, i.e., the6Li/7Li ratio is
always smaller than 3×10⁻⁵which is the maximum value
found in Paper I and Paper II. The diagram of9Be/16
O-10-14
10-12
10-10
10-8
10-6
10-8 10-6 10-4 10-2
6 Li / 16 O
7Li / 16O
(a)
5.5
6.0
6.03 6.4
10-14
10-12
10-10
10-8
10-6
10-8 10-6 10-4 10-2
9 Be / 16 O
7Li / 16O
(b)
5.5 6.0
6.03 6.4
Fig. 8. Diagrams between6Li/16O and7Li/16O number ratios (panel (a))
and between9Be/16O and7Li/16O number ratios (panel (b)). Markers
connected by the dashed line show the ratios in the mixture with various mixing ratios,x. Original locations of the He-components, Mm(He), are labeled by attached annotation. Solid lines indicate the6Li/7Li ratio
equal to 3×10⁻⁵(panel (a)) and the9Be/7Li ratio equal to 2×10⁻⁴
(panel (b)). These are the maximum values found in Paper I and Paper II. For comparison we show the ratios of the solar-system composition by .
7Li/16O ratios is presented in Fig. 8(b). Similarly to the case
of6Li/16O, the9Be/16O ratio is decreased more steeply than
the7Li/16O ratio by the mixing and is always smaller than
2×10⁻⁴which is the maximum value evaluated in Paper I
and Paper II. Consequently, the main conclusion obtained in Paper I and Paper II that presolar grains with6Li/7Li ratio
less than 3×10⁻⁵and with9Be/7Li ratio less than 2×10⁻⁴
should be supernova origin is not altered even if the nuclear reprocessing after the mixing is considered.
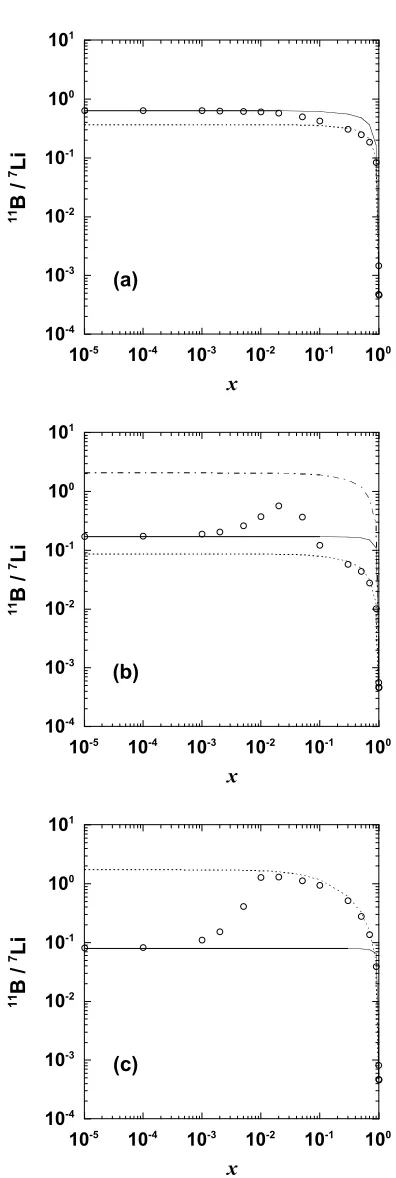
4.2 The11B/7Li ratio
Thefinal ratio of11B/7Li is influenced by the mixing in a
complicated manner in spite of the similar behavior between
7Li and11B (see the previous section). The reason is that7Li
and11B are easily decomposed by protons but their p-rich
isobars, 7Be and11C, which decay respectively to7Li and 11B, are not.
In Fig. 9, the11B/7Li ratio is shown as a function of the
10-4
10-3
10-2
10-1
100
101
10-5 10-4 10-3 10-2 10-1 100
11 B / 7 Li
x (a)
10-4
10-3
10-2
10-1
100
101
10-5 10-4 10-3 10-2 10-1 100
11 B / 7 Li
x (b)
10-4
10-3
10-2
10-1
100
101
10-5 10-4 10-3 10-2 10-1 100
11 B / 7 Li
x (c)
Fig. 9. Thefinal11B/7Li ratios (open circles) in the mixture in the cases of
Mm(He)=3.8M(panel (a)), 5.0M(panel (b)), and 6.0M(panel (c)) (Mm(H)= 6.5M). Solid line and dotted line show the mixing lines of11B/7Li and11C/7Be at the shock arrival to the He/H boundary,
respectively. Dash-dotted line in panel (b) shows the11B/7Be ratio of the
mechanical mixing.
M, 5.0M, and 6.0M, respectively. The location of the H-component, Mm(H), isfixed to be 6.5 M. In the case of Mm(He)=3.8 M (see Fig. 9(a)), the11B/7Li ratio co-incides with the solid line when x <∼ 2×10⁻² and with
the dotted line whenx>∼0.3; the former is the mixing line of 11B/7Li and the latter is that of11C/7Be. In the case of x <∼ 2×10⁻², neither7Li nor 11B is decomposed in the
mixture. On the other hand, in the case of x >∼ 2×10⁻²
only7Be synthesized before the mixing remains in the
mix-ture (see Fig. 2(a)), but both7Li and11B are decomposed.
As mentioned before,7Be outnumbers7Li before the
mix-ing. So, the11B/7Li ratio runs along the mixing line of the 11B/7Be ratio whenx <
∼2×10⁻²and of the11C/7Be ratio
whenx>∼0.3.
In the case of Mm(He)= 5.0 M, the11B/7Li ratio be-comes larger than not only that of the mechanical mixing but also the corresponding 11C/7Be ratio presented by the
dash-dotted line when 1×10⁻³ <
∼x <∼0.1 (see Fig. 9(b)). Note here that, although both7Li and11B are decomposed
by protons,7Li is more fragile to the irradiation of protons
compared with11B. Whenx<
∼3×10−2,7Li is decomposed (but11B is not) and the11B/7Li ratio becomes larger than
the11B/7Li ratio of the mechanical mixing. With a further
increase in the mixing ratio,11B starts to be decomposed,
so that the11B/7Li ratio becomes small. For x >
∼ 0.1, the
11B/7Li ratio reduces to the 11C/7Be ratio of the
mechan-ical mixing because 7Li and 11B are decomposed almost
completely. The ratio of11B/7Li is always smaller than the 11B/7Be ratio of the mechanical mixing.
In the case of Mm(He) = 6.0 M, we have a behavior of the11B/7Li ratio different from the previous two cases,
as shown in Fig. 9(c), because the11C/7Be ratio of the
He-component (about 2) is greater than the11B/7Li ratio (about
0.1) in this case. When x <∼ 1×10⁻³, the 11B/7Li ratio
is almost equal to that of the mechanical mixing and when x>∼1×10⁻²the11B/7Li ratio agrees with the11C/7Be ratio
of the mechanical mixing. In the latter case, both7Li and 11B are completely decomposed.
Now, we consider how the11B/7Li ratio depends on the
location of the H-component in the mixture. Figure 10 presents the11B/7Li ratio in the mixtures for variousM
m(H).
The location of the He-component isfixed to beMm(He)=
6.0 M. From thisfigure we see the following two char-acters. One is that the mixing ratio which gives the maxi-mum11B/7Li ratio becomes larger asM
m(H)increases. The
reason is that the maximum temperature of the mixture de-creases with an increase in Mm(H), so that more protons
need to decompose7Li and11B in the mixture. The other
is that the peak value of the11B/7Li ratio becomes larger
as Mm(H)increases as long as we are concerned with the
case of Mm(H) <∼ 7.2 M, whereas it becomes smaller when Mm(H) >∼7.2 M. This is brought about by the fact that7Li is more fragile than11B to proton captures. When Mm(H) <∼7.2M, a part of11B and all7Li are decomposed in the mixture. The amount of the decomposed11B becomes
smaller with an increase in Mm(H). When Mm(H) >∼ 7.2
M, all11B remains and a part of7Li is decomposed in the mixture. Increase in thefinal amount of7Li causes the
de-crease of11B/7Li ratio. At last, in the case of such a distant
10-4
mixing ratio, x. The location of the He-component is fixed to be
Mm(He) =6.0M. Arrows show the maximum11B/7Li ratios in the cases ofMm(H)=8.0Mand 8.8M.
nuclear reprocessing on7Li and11B after the mixing, so that
the11B/7Li ratio is determined by the mechanical mixing.
Anyway, wefind that the11B/7Li ratio is confined within
a level between 1×10⁻⁴ and 4 even if we take account of
the nuclear reprocessing after the mixing; the11B/7Li ratio
varies slightly wider than that evaluated in Paper I and Pa-per II, i.e., 1×10⁻⁴<
∼11B/7Li<∼3 but the difference is not so important.
5. Summary and Conclusions
We have investigated the varieties of the isotopic/ele-mental ratios of the light elements due to various parame-ters which would affect the nucleosynthesis of the light ele-ments. In this study, we concentrated on the mixing process during the supernova explosion and explored the nuclear processing on the light elements after the mixing. Four re-sults are obtained.
1) The X-elements produced in the He-layer are decom-posed by protons in the H-rich envelope when fluid components from these layers mix. The degree of the decomposition depends on the location of each compo-nent before the mixing, the mixing ratio, and the mix-ing time.
2) Among the X-elements, 7Li and11B which are
abun-dant in the He-component are decomposed by only a small amount of protons from the H-component in the mixture. However, their p-rich isobars, 7Be and11C,
are not decomposed. As a result, the variety of the
11B/7Li ratio is not so changed even if the nuclear
re-processing after the mixing is considered.
3) The fragile species, 6Li and9Be, are completely
de-composed by protons in the mixture if the mixing ra-tio is larger than 2×10⁻³. Although10B is also
de-composed by protons in the mixture, the degree of the decomposition is less effective compared with6Li and 9Be.
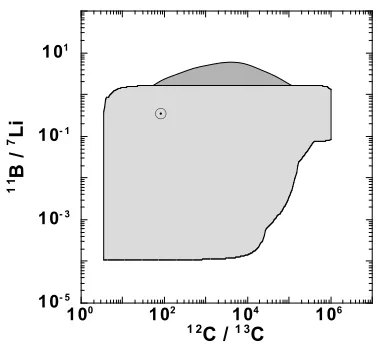
Fig. 11. The number ratios of11B/7Li-12C/13C. The light shaded region
denotes the ratios of the mechanical mixing between the He-layer and the H-rich envelope; the region is identical to the entire region shown in
figure 14(a) in Paper I. The dark shaded region denotes the ratios not due to the mechanical mixing but due to the nuclear reprocessing after the mixing. The markshows the ratios of the solar-system composition.
4) The abundances of the CNO-elements are scarcely af-fected by the nuclear reprocessing after the mixing. In Paper I and Paper II, we investigated the possible ranges of the isotopic/elemental ratios, which we are inter-ested in, using the three kinds of diagrams:11B/7Li-12C/13C, 14N/15N-12C/13C, and16O/17O-12C/13C. In this study wefind
that the nuclear reprocessing after the mixing does not affect the abundances of the CNO-elements. Thus, the diagrams of
14N/15N-12C/13C and16O/17O-12C/13C are not changed even
if the nuclear reprocessing is considered. Hence, we will mention only the diagram of11B/7Li-12C/13C ratios. In order
to compare the11B/7Li-12C/13C diagrams of the two
stud-ies, the present study and Paper I, we take account of the variety of the neutrino emission model as we did in Paper I: four neutrino emission models, given by Eqs. (3) and (4), are adopted additionally. The result is shown in Fig. 11. In ad-dition to the light shaded region obtained by the mechanical mixing identical to the entire region shown infigure 14(a) in Paper I, there appears newly a dark shaded region in the ranges of 2<∼11B/7Li<
∼6 and 60<∼12C/13C<∼1×105 ow-ing to the effect of the nuclear reprocessow-ing. Scatters of the elemental ratios due to the nuclear reprocessing are almost masked by those of the mechanical mixing and, as a result, the dark shaded region is apparently small compared with the region of the mechanical mixing. So, the diagram of
11B/7Li-12C/13C ratios is scarcely changed even if we
con-sider the nuclear reprocessing after the mixing.
From the above results we can say that the conclusions obtained in Paper I and Paper II are valid without large mod-ifications even if we consider the nuclear reprocessing after the mixing between the He-layer and the H-rich envelope. The conclusions are as follows:
1) Presolar grains from the supernova should have the
6Li/7Li ratio less than 3×10⁻⁵and the9Be/7Li ratios
2) The11B/7Li ratio of the presolar grains from the
super-nova falls on the light shaded region or the dark shaded region in Fig. 11, which is almost the same as that of Paper I.
Acknowledgments. The authors would like to thank Kohichi Iwamoto, Ken’ichi Nomoto, and Toshikazu Shigeyama for giving the data of internal structure for a progenitor model, 14E1, and helpful discussion. This work is supported, in part, by Grand-in-Aid for General Scientific Research (B) (No. 09440089) and Re-search Fellowships of the Japan Society for the Promotion of Sci-ence for Young Scientists (No. 12000289). The computation has been made by Cray C916 and NEC SX-5 at the Computer Center of Tokyo Institute of Technology.
References
Amari, S., P. Hoppe, E. Zinner, and R. S. Lewis, Interstellar SiC with un-usual isotopic compositions: grains from a supernova?,Astrophys. J., 394, L43–L46, 1992.
Amari, S., E. Zinner, and R. S. Lewis, Large18O excesses in circumstellar
graphite grains from the Murchison meteorite: indication of a massive-star origin,Astrophys. J.,447, L147–L150, 1995.
Arnett, W. D. and A. Fu, The late behavior of supernova 1987A. I. The light curve,Astrophys. J.,340, 396–413, 1989.
Burrows, A. and B. A. Fryxell, An instability in neutron stars at birth, Sci-ence,258, 430–434, 1992.
Burrows, A., J. Hayes, and B. A. Fryxell, On the nature of core-collapse supernova explosions,Astrophys. J.,450, 830–850, 1995.
Chandrasekhar, S.,Hydrodynamic and Hydromagnetic Stability, pp. 428– 436, Dover, New York, 1981.
Chevalier, R. A., The hydrodynamics of Type II supernovae,Astrophys. J., 207, 872–887, 1976.
Ebisuzaki, T., T. Shigeyama, and K. Nomoto, Rayleigh-Taylor instability and mixing in SN 1987A,Astrophys. J.,344, L65–L68, 1989. Fryxell, B., E. M¨uller, and D. Arnett, Instabilities and clumping in SN
1987A. I. Early evolution in two dimensions,Astrophys. J.,367, 619– 634, 1991.
Fu, A. and W. D. Arnett, The late behavior of supernova 1987A. II. Gamma-ray transparency of the ejecta, Astrophys. J., 340, 414–425, 1989.
Hachisu, I., T. Matsuda, K. Nomoto, and T. Shigeyama, Nonlinear growth of Rayleigh-Taylor instabilities and mixing in SN 1987A,Astrophys. J., 358, L57–L61, 1990.
Hachisu, I., T. Matsuda, K. Nomoto, and T. Shigeyama, Mixing in ejecta of supernovae. I. General properties of two-dimensional Rayleigh-Taylor instabilities and mixing width in ejecta of supernovae,Astrophys. J.,390, 230–252, 1992.
Hachisu, I., T. Matsuda, K. Nomoto, and T. Shigeyama, Mixing in ejecta of supernovae. II. Mixing width of 2D Rayleigh-Taylor instabilities in the helium star models for type Ib/Ic supernovae,Astron. Astrophys. Suppl., 104, 341–364, 1994.
Herant, M. and S. E. Woosley, Postexplosion hydrodynamics of supernovae
in red supergiants,Astrophys. J.,425, 814–828, 1994.
Herant, M., W. Benz, and S. Colgate, Postcollapse hydrodynamics of SN 1987A: two-dimensional simulations of the early evolution,Astrophys. J.,395, 642–653, 1992.
Hoffman, R. D. and S. E. Woosley, Tables of reaction rates for nucle-osynthesis for charged particle, weak, and neutrino interactions (Z < 45), (unpublished; http://isotopes.lbl.gov/isotopes/ hw92 1.html), 1992.
Meyer, B. S., T. A. Weaver, and S. E. Woosley, Isotopic source table for a 25Msupernova,Meteoritics,30, 325–334, 1995.
Nittler, L. R., S. Amari, E. Zinner, S. E. Woosley, and R. S. Lewis, Extinct
44Ti in presolar graphite and SiC: proof of a supernova origin,Astrophys.
J.,462, L31–L34, 1996.
Sedov, L. I.,Similarity and Dimensional Methods in Mechanics, pp. 260– 270, Academic Press, New York and London, 1959.
Shigeyama, T. and K. Nomoto, Theoretical light curve of SN 1987A and mixing of hydrogen and nickel in the ejecta,Astrophys. J.,360, 242–256, 1990.
Thielemann, F.-K., M. Hashimoto, and K. Nomoto, Explosive nucleosyn-thesis in SN 1987A. II. Composition, radioactivities, and the neutron star mass,Astrophys. J.,349, 222–240, 1990.
Thielemann, F.-K., K. Nomoto, and M. Hashimoto, Core-collapse super-novae and their ejecta,Astrophys. J.,460, 408–436, 1996.
Travaglio, C., R. Gallino, S. Amari, E. Zinner, S. E. Woosley, and R. S. Lewis, Low-density graphite grains and mixing in Type II supernovae,
Astrophys. J.,510, 325–354, 1999.
Wooden, D. H., Observational evidence for mixing and dust condensation in core-collapse supernovae, inAstrophysical Implications of the Labo-ratory Study of Presolar Materials, edited by T. J. Bernatowicz and E. Zinner, pp. 317–376, AIP Conference Proceedings 402, Woodbury, New York, 1997.
Woosley, S. E. and T. A. Weaver, The evolution and explosion of massive stars. II. Explosive hydrodynamics and nucleosynthesis,Astrophys. J. Suppl.,101, 181–235, 1995.
Woosley, S. E., D. H. Hartmann, R. D. Hoffman, and W. C. Haxton, The ν-process,Astrophys. J.,356, 272–301, 1990.
Yoshida, T., Light elements synthesized in the He-layer and the H-rich en-velope of Type II supernovae, Doctoral Thesis, 2000.
Yoshida, T., H. Emori, and K. Nakazawa, Light elements synthesized in the He-layer and the H-rich envelope of a type II supernova—Influence of the adopted neutrino emission model—,Earth Planets Space,52, 203– 219, 2000a (Paper I).
Yoshida, T., K. Nakazawa, and H. Emori, Light elements synthesized in the He-layer and the H-rich envelope of a type II supernova, II—Influence of initial chemical compositions—,Earth Planets Space,52, 361–376, 2000b (Paper II).
Zinner, E., Stellar nucleosynthesis and the isotopic composition of presolar grains from primitive meteorites,Annu. Rev. Earth Planet. Sci.,26, 147– 188, 1998.