1556-6811/09/$12.00
doi:10.1128/CVI.00248-09
Copyright © 2009, American Society for Microbiology. All Rights Reserved.
Development and Analytical Validation of an Immunoassay for
Quantifying Serum Anti-Pertussis Toxin Antibodies
Resulting from
Bordetella pertussis
Infection
䌤
Sandra L. Menzies,
1* Vijay Kadwad,
1,4Lucia C. Pawloski,
2Tsai-Lien Lin,
3Andrew L. Baughman,
2Monte Martin,
2Maria Lucia C. Tondella,
2Bruce D. Meade,
1,5and the Pertussis Assay Working Group
Division of Bacterial, Parasitic, and Allergenic Products, Center for Biologics Evaluation and Research, FDA, Rockville, Maryland
1;
Division of Bacterial Diseases, Centers for Disease Control and Prevention, Atlanta, Georgia
2; Division of Biostatistics,
Center for Biologics Evaluation and Research, FDA, Rockville, Maryland
3; Immunoassay Department,
BRIT, Mumbai, India
4; and Meade Biologics, LLC, Hillsborough, North Carolina
5Received 19 June 2009/Returned for modification 28 August 2009/Accepted 19 October 2009
Adequately sensitive and specific methods to diagnose pertussis in adolescents and adults are not widely
available. Currently, no Food and Drug Administration-approved diagnostic assays are available for the
serodiagnosis of
Bordetella pertussis
. Since concentrations of
B. pertussis
-specific antibodies tend to be high
during the later phases of disease, a simple, rapid, easily transferable serodiagnostic test was developed. This
article describes test development, initial evaluation of a prototype kit enzyme-linked immunosorbent assay
(ELISA) in an interlaboratory collaborative study, and analytical validation. The data presented here
dem-onstrate that the kit met all prespecified criteria for precision, linearity, and accuracy for samples with
anti-pertussis toxin (PT) immunoglobulin G (IgG) antibody concentrations in the range of 50 to 150 ELISA
units (EU)/ml, the range believed to be most relevant for serodiagnosis. The assay met the precision and
linearity criteria for a wider range, namely, from 50 to 200 EU/ml; however, the accuracy criterion was not met
at 200 EU/ml. When the newly adopted World Health Organization International Standard for pertussis
antiserum (human) reference reagent was used to evaluate accuracy, the accuracy criteria were met from 50
to 200 international units/ml. In conclusion, the IgG anti-PT ELISA met all assay validation parameters within
the range considered most relevant for serodiagnosis. This ELISA was developed and analytically validated as
a user-friendly kit that can be used in both qualitative and quantitative formats. The technology for producing
the kit is transferable to public health laboratories.
Despite effective immunization with pertussis vaccines,
per-tussis remains endemic. Recently reported disease has increased
in adolescents and adults, among whom the diagnosis of
per-tussis is especially problematic (7, 8, 10, 16, 30). Routine
sur-veillance, outbreak investigations, and implementation of
con-trol measures have been limited by a lack of validated and
standardized tests to identify suspected cases of pertussis (4,
29, 32, 36, 38). By the time health care is sought and pertussis
is suspected, isolation of
Bordetella pertussis
by culture or
con-firmation by PCR is uncommon (24, 29, 31, 36). Although
detecting the physical presence of the bacterium is difficult,
antibody titers directed to
B. pertussis
tend to be elevated
during the later phase of illness and persist after the infection
is resolved, so the development and validation of a simple and
rapid serodiagnostic test has practical utility for diagnosing
pertussis infections. The ability to confirm outbreaks quickly
using a serologic test has the potential to conserve resources
that have been used for outbreaks mistakenly attributed to
pertussis (4). Additionally, the routine availability of a
serodi-agnostic test for pertussis would provide significant public
health benefit by furnishing public health officials with a more
accurate assessment of the burden of disease in the United
States and with a better understanding of the role of
adoles-cents and adults in the transmission of pertussis. Acellular
pertussis vaccines for adults and adolescents have recently
been licensed (5, 6); however, the absence of readily available,
validated and standardized tests to confirm suspected cases in
these older age groups has hampered the collection of the
epidemiological data required to guide developers and public
health officials in effective utilization of these vaccines (11, 12,
32). A serodiagnostic test could supply these data and allow the
design and evaluation of control strategies.
A large body of evidence is now available to demonstrate
that measurement of specific antibodies could assist in the
laboratory confirmation of pertussis (8, 13–15, 17, 20);
how-ever, the criteria defining the infection threshold are not well
agreed upon by international and national health
organiza-tions. One proposal for threshold values was based on the
measurement of antibodies against pertussis toxin (PT),
fila-mentous hemagglutinin, and fimbria types 2 and 3 in a
popu-lation of more than 6,000 U.S. residents of ages 6 to 49 years
who participated in the Third National Health and Nutrition
Examination Survey (2). Based on the mixture modeling of
these data to identify hypothesized exposure groups, an anti-PT
immunoglobulin G (IgG) level of
⬎
94 ELISA units (EU)/ml
was proposed as the diagnostic cutoff point for recent
infec-tion, with a lower value of
⬎
49 EU/ml as an intermediate
* Corresponding author. Mailing address: CBER/OVRR/DBPAP,
1401 Rockville Pike, HFM-422, Rockville, MD 20850. Phone: (301)
451-3991. Fax: (301) 402-2776. E-mail: [email protected].
䌤
Published ahead of print on 28 October 2009.
1781
on August 17, 2020 by guest
http://cvi.asm.org/
cutoff that suggested possible infection (3). Alternate
diagnos-tic thresholds have been developed and applied. Specifically,
the Massachusetts State laboratory has utilized a cutoff value
of 200 EU/ml for almost 20 years (23), and De Melker et al. (9)
adopted a value of 125 EU/ml for routine use in The
Nether-lands. Thus, the above studies established a variety of
thresh-old cutoffs for anti-PT titers that range from 49 to 200 EU/ml.
Final assessment of these proposed diagnostic cutoff points
requires a prospective clinical study including patients with
confirmed
B. pertussis
infection. By establishing accurate cutoff
values for anti-PT titers for patients currently or recently ill,
serological detection may provide a qualitative assessment of
whether a test sample has anti-PT titers that are higher or
lower than appropriately defined positive and negative control
values.
Despite these potential benefits, no Food and Drug
Admin-istration (FDA)-approved diagnostic assays are currently
avail-able for the serodiagnosis of
B. pertussis
infection, and none of
the published methods (1, 9, 17, 19, 23, 25–27, 33–35, 37) have
been demonstrated to be readily transferable to public health
laboratories. Thus, the overall goal of this project is to develop
a simple and readily transferable enzyme-linked
immunosor-bent assay (ELISA) for the measurement of anti-PT IgG in
human serum samples that subsequently could be subjected to
an appropriate clinical assessment. A single-serum
dilution-based ELISA procedure with ready-to-use reagents was
de-signed and optimized to quantify the anti-PT range thought
relevant for diagnosing late-stage pertussis infections. We
de-scribe the initial assay development, initial evaluation of the
prototype kit by an interlaboratory collaborative study, and
assay validation study.
MATERIALS AND METHODS
Human sera.Human sera that were either positive or negative for IgG anti-bodies to PT were obtained by recalcification of plasma. The Centers for Disease Control and Prevention (CDC) provided the plasma, which was obtained from screened donors. Positive plasmas were collected from adult donors with docu-mented pertussis identified through surveillance activities. The donors were culture positive forB. pertussisor epidemiologically linked to a culture-confirmed pertussis case. Specimens were collected 4 to 6 weeks after onset of cough. Negative specimens were collected from adults without pertussis enrolled through a blood bank. Negative serum had anti-PT concentrations below the limit of detection of 2 EU/ml in a conventional ELISA (25). Positive and neg-ative specimens were used as samples for the collaborneg-ative study and the ana-lytical validation. Human specimens were collected in compliance with ethical and regulatory requirements. The Center for Biologics Evaluation and Research (CBER) provided the U.S. Reference Pertussis Antiserum (human), lot 3 (CBER3), which has an assigned unitage of 200 EU/ml of IgG anti-PT (25, 39). Kathryn Edwards of Vanderbilt University provided the Vanderbilt pertussis reference serum, a secondary reference that was calibrated in EU/ml using CBER3 (2). The WHO pertussis antiserum (human) reference reagent, which became available in January 2009, was obtained from the National Institute for Biological Standards and Control (NIBSC, Potters Bar, United Kingdom). The reagent, NIBSC code 06/140, has been assigned a value of 335 IU of IgG anti-PT per ampoule (39). Based on an international collaborative study (39), 1 EU of IgG anti-PT is approximately equal to 1 IU of IgG anti-PT.
Lyophilized standards and controls.Various quantities of 14 positive sera were combined to prepare a pertussis master serum pool (PMP-1). PMP-1 was calibrated against the Vanderbilt pertussis reference serum (2) and assigned a unitage of 619 EU/ml. Six kit standards, with concentrations of 15, 30, 60, 120, 240, and 480 EU/ml, and three kit controls were prepared: negative control I (CI) with nondetectable concentrations of anti-PT IgG, control II (CII) with 49 EU/ml, and control III (CIII) with 94 EU/ml. Standards and controls were prepared by combining PMP-1 with negative sera and then diluting the sera 1:100 using preparation buffer (phosphate-buffered saline [1⫻PBS], pH 7.4, with 4%
bovine serum albumin [Sigma-Aldrich, St. Louis, MO]). PBS (1⫻) was prepared by dilution of 10-times-concentrated PBS (0.1 M sodium phosphate, 1.45 M sodium chloride, pH 7.4, when diluted for use). One-ml aliquots of the diluted sera were lyophilized on either a 1- or 2-day cycle. Standard and control batch 04, used in the interlaboratory collaborative study, was lyophilized on a 2-day cycle (CBER, Rockville, MD), and standard and control batch 08, used in the analyt-ical validation, was lyophilized on a 1-day cycle (CDC, Atlanta, GA). The con-centrations of anti-PT IgG in standards and controls following lyophilization were verified by comparison to a reference serum. The Vanderbilt reference serum, which had been calibrated using CBER3, was used for verification of standard and control batch 04. Because the supply of the Vanderbilt reference had been depleted, CBER3 was used for verification of standard and control batch 08. Concentrations of standards and controls were defined in EU/ml because they were calibrated using CBER3.
Detection antibody.These studies used a horseradish peroxidase (HRP)-con-jugated anti-human IgG(1,2,3,4) Fc-specific mouse isotype IgG1 monoclonal antibody (clone HP6043; Hybridoma Reagent Laboratory, Baltimore, MD). For the prototype kit used in the interlaboratory collaborative study, conjugate was diluted 1:4,200 in HRP stabilizer (KPL, Gaithersburg, MD), lyophilized in 1-ml aliquots using a 2-day lyophilization schedule, and stored at 2 to 8°C. Vials were reconstituted with 8.0 ml of assay buffer (1⫻PBS containing 4% bovine serum albumin and 0.05% Tween 20 [Spectrum, Gardena, CA]) on the day of use for a final dilution of 1:33,600. The kit used in the analytical validation contained conjugate diluted 1:5,000 in preparation buffer containing 50% glycerol and stored at⫺20°C. On the day of use, the conjugate was diluted to 1:70,000 using assay buffer. The conjugate stored in 50% glycerol was used in lieu of lyophilized conjugate because it was more stable and easier to prepare.
ELISA.The ELISA was adapted from methods reported previously (2, 25) with minor modifications. All plated volumes were 100l per well. Purified PT antigens (80g/ml; lot PT/Ag/03/97 for the interlaboratory collaborative study and lot APT0BAA241 at 95.5g/ml for the analytical validation; GlaxoSmith-Kline, Rixensart, Belgium) were stored at⫺20°C in 50 mM phosphate buffer (pH 7.6) and 500 mM NaCl that contained 50% glycerol. The PT was diluted to approximately 2g/ml (range of 2.0 to 2.3g/ml) in coating buffer (0.05 M carbonate-bicarbonate buffer, pH 9.6; Sigma-Aldrich, St. Louis, MO) and added to each well of a microtiter strip (Immunolon 2HB; Thermo Scientific, Waltham, MA) prior to incubation for 14 to 24 h at 2 to 8°C. On the day of an assay, test serum samples were diluted 1:100 in assay buffer. Lyophilized standards and controls were reconstituted with standard and kit control diluent (deionized water containing 0.05% Tween 20). After the coated microtiter strips were washed three times with wash solution (1⫻PBS containing 0.05% Tween 20), test sera, standards, and controls were added and plates were incubated for 2 h⫾ 15 min at room temperature, approximately 22°C. Following a second wash, anti-human IgG conjugate was added and plates were incubated again at room temperature for 2 h⫾15 min. After a final wash, TMB substrate (SureBlue Reserve [3,3⬘,5,5⬘ tetramethylbenzidine]; KPL, Inc., Gaithersburg, MD) was added, followed by incubation at room temperature for 9 to 11 min. The reaction was terminated by adding stop solution (1 N hydrochloric acid; VWR Scientific, West Chester, PA). Microtiter strips were read at a wavelength of 450 nm. ELISA unitage for each sample was calculated using a four-parameter logistic reference curve. For the interlaboratory collaborative study, each site used the commercially available four-parameter logistic software available in their labo-ratory. Gen5 software (BioTek, Winooski, VT) was used to calculate unitage during the analytical validation. An assay in the collaborative section was con-sidered valid if the following criteria were met: the standard curve had a smooth sigmoidal shape and had a correlation coefficient of⬎0.95, the percent coeffi-cient of variation (%CV) of the optical density (OD) of the replicate wells for all standards and controls was⬍15%, the OD of the assay buffer wells was⬍0.200 and the OD of CI was⬍0.400, the OD of 480 EU/ml standard was between 1.200 and 3.000, and the calculated concentrations of CII and CIII fell within prespeci-fied limits (for CII, 26 to 68 EU/ml; for CIII, 56 to 134 EU/ml). The criteria for the analytical validation were the same as those for the collaborative study except the criterion for the %CV of the OD for the standard and control replicate wells was changed to be less than or equal to 20%.
Interlaboratory collaborative study design.The collaborative study included eight analysts from four laboratories (one analyst from Vanderbilt University, two each from Colorado State Laboratory and the CDC, and three from CBER), who each performed five independent assays using identical kits and aliquots of the same test samples provided by the coordinating laboratory. The analysts and laboratories had relevant experience performing ELISAs; however, there was heterogeneity in the extent of recent experience and in the equipment available at each laboratory. Each assay was performed on a different day. In each assay, one negative sample and seven serum samples of various concentrations were
on August 17, 2020 by guest
http://cvi.asm.org/
tested. The seven positive test samples were targeted at the following concen-trations: 30, 55, 85, 105, 105, 170, and 275 EU/ml. The two 105-EU/ml samples were prepared from the same serum. Four of the samples were tested once per assay, and four were independently diluted and tested three times per assay. The analyst was blinded to identification of samples prior to study initiation, and sample placement on each assay plate was randomly assigned to generate a different layout for each of the five assays. Prior to initiating the study, each analyst was required to successfully complete one qualifying assay. Data were analyzed qualitatively and quantitatively. A total of 741 results were reported from assay plates that met the prespecified validity criteria. A test result was included in the analysis if the reported value fell within the assay range of 15 to 480 EU/ml and the %CV of the concentration measured in replicate wells did not exceed 25%. With these exclusions, 585 values were available for analysis, 63 were excluded because the %CV was greater than 25%, and 93 were excluded because they fell outside the working range of the assay. Of those excluded, 78 values that came from antibody-negative samples were⬍15 EU/ml.
Analytical validation.The analytical validation study evaluated assay precision (intra- and interassay and reproducibility), accuracy, dilutional linearity, and recovery. Since the ELISA was not designed to evaluate the lowest analyte potency, the limit of quantitation and limit of detection were not assessed. Acceptance criteria were specified prior to the start of the study and are defined in Results. Precision was evaluated at CBER and CDC laboratories using a 3⫻
3⫻3⫻3 design; specifically, each sample was diluted and tested three times per assay with three assays performed per day over a total of 3 days by three analysts per site. In each assay, seven samples were analyzed; these samples had target concentrations of 49, 58, 83, 100, 135, 204, and 217 EU/ml. Assays evaluating linearity, accuracy, and recovery were performed at the CDC laboratory. Lin-earity was assessed by diluting three high-concentration serum samples twofold, fourfold, and eightfold in antibody-negative serum; each dilution was then treated as a test sample. The geometric mean of the observed values was plotted versus the expected values and fit to a straight line. The 95% confidence limit for the slope and the coefficient of determination (r2
) were calculated. Accuracy was evaluated by diluting CBER3 with antibody-negative serum to final concentra-tions of 50, 100, 150, and 200 EU/ml. Subsequent to the primary validation study, an additional accuracy evaluation was performed using NIBSC 06/140 at final concentrations of 50, 100, 150, and 200 IU/ml. The measured concentration for three independent preparations was compared to the expected concentration. Recovery was assessed by spiking three clinical serum samples with different reconstituted standards to prepare six spiked serum samples. These spiked serum samples were independently spiked three times to yield a total of 18 samples with targeted concentrations ranging from 59 to 248 EU/ml. Recoveries were calcu-lated as the observed concentration divided by the expected concentration. The expected concentration was determined as the mean standard concentration value for each undiluted clinical sample analyzed as two unknown samples in the assay. A test result was excluded from the analysis if the %CV of the concen-tration measured in replicate wells exceeded 25%. After the data exclusions were carried out, 1,095 reported values were available for analysis.
Statistical analysis.For the interlaboratory collaborative study (IC), the %CV (IC %CV) was calculated for each study sample and the two positive control samples by dividing the standard deviation of the values for the study sample by the mean value for the sample. Mandel’skstatistic was used to evaluate within-analyst variability (21, 22).
Analysis of the analytical validation evaluated repeatability (intra-assay preci-sion), intermediate precision (interassay), and reproducibility (interlaboratory) using the variance components approach to estimate the variability from various sources. This analysis was performed on the log-transformed values. Repeatabil-ity was analyzed for each analyst and each sample using a statistical model that included the terms of day and plate within-day. The intra-assay %CV was calculated as [Exp (within-plate variance)⫺1]1/2⫻100, where Exp is exponent. Intermediate precision was evaluated for each sample at each laboratory using a statistical model that included terms analyst, day within analyst, and plate within analyst by day. The intermediate %CV was calculated as [Exp (sum of all variance components)⫺1]1/2⫻100. Reproducibility was evaluated for each sample using a statistical model that included site, analyst within site, day within site by analyst, and plate within site by analyst by day terms. The reproducibility %CV was calculated as [Exp (sum of all variance components)⫺1]1/2⫻
100. In addition, overall precision estimates across all samples or samples within the 50 to 200 EU/ml concentration range were obtained.
A qualitative approach was used to evaluate the assays performed in the collaborative study and the assays used for evaluating precision in the analytical validation. ODs instead of the calculated sample concentrations were used to define a concentration range for each test sample. Within each assay plate, the OD value for a sample was compared to the OD values for the controls CII and
CIII (target values of 49 and 94 EU/ml, respectively). If the mean sample OD was less than the mean OD of CII, then the sample was interpreted as negative. If the mean sample OD was greater than or equal to the mean OD of CII but less than the mean OD of CIII, then the sample was interpreted as intermediate. Finally, if the mean sample OD was greater than or equal to the mean OD of CIII, then the sample was interpreted as positive.
RESULTS
Interlaboratory collaborative study.
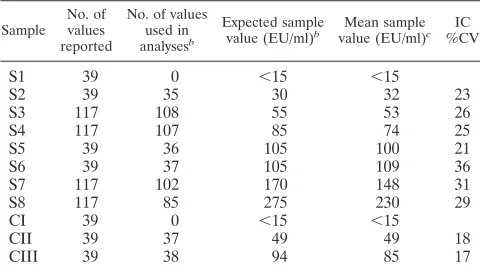
An IC was carried out
to evaluate the performance and transferability of the kit
de-sign. The assay met acceptance criteria between 32 EU/ml and
100 EU/ml; specifically, when the results of the eight analysts
were combined, the two controls and four control serum
sam-ples had an overall IC %CV of
ⱕ
26%. More variability was
observed for three control sera samples having concentrations
greater than 100 EU/ml. These samples had an IC %CV range
between 29 and 36% (Table 1).
Since the IC %CV for samples of
⬎
100 EU/ml was higher
than our targeted value of 25%, we assessed a variety of
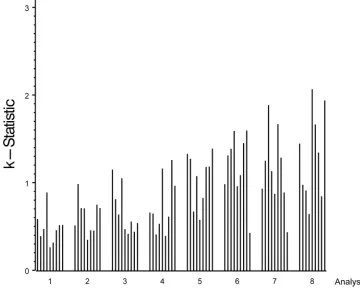
po-tential factors that might affect assay variability. Mandel
k
statistics indicated that heterogeneity among the analysts in
assay precision was the most likely factor that contributed to
the high IC %CV (Fig. 1) (21, 22). Evaluation by
k
statistics
generates a mathematical assessment of the consistency of each
analyst’s results compared to the average consistency across all
analysts. Because the number of analysts varied among the
laboratories, results were reported by analyst rather than by
laboratory to maintain blinding. In Fig. 1, the height of a bar
represents the precision achieved for each sample by each
analyst. When the
k
statistic for a given sample was greater
than 1, the variability for that analyst was higher than the
average variability across all analysts for that sample.
Con-versely, a
k
statistic less than 1 indicates that the variability for
that analyst was less than the average variability across all
analysts for that sample. For each analyst, the height of the bar
appeared similar for the majority of samples (Fig. 1).
Interest-ingly, the four analysts (analysts 5 through 8) with the highest
variability were distributed among three laboratories,
suggest-TABLE 1. IC data: descriptive statistics for quantitative results
aSample No. of values reported
No. of values used in analysesb
Expected sample value (EU/ml)b
Mean sample value (EU/ml)c
IC %CV
S1
39
0
⬍
15
⬍
15
S2
39
35
30
32
23
S3
117
108
55
53
26
S4
117
107
85
74
25
S5
39
36
105
100
21
S6
39
37
105
109
36
S7
117
102
170
148
31
S8
117
85
275
230
29
CI
39
0
⬍
15
⬍
15
CII
39
37
49
49
18
CIII
39
38
94
85
17
a
Controls CI, CII, and CIII and samples S1, S2, S5, and S6 were tested one time per assay plate; whereas, samples S3, S4, S7, and S8 were tested three times per assay plate.
b
A result was included in the analysis if the reported value fell within the assay range of 15 to 480 EU/ml and the %CV did not exceed 25%. Results were excluded as follows: 78 values were⬍15 EU/ml, 15 values were⬎480 EU/ml, and 63 values had a %CV of⬎25%.
c
ELISA units/ml.
on August 17, 2020 by guest
http://cvi.asm.org/
ing that the analytical performance of the analyst was more
important than variability emanating from the laboratory. The
assay met the acceptance criteria, especially in the range
an-ticipated to be most important for diagnosis (i.e., between 50
and 100 EU/ml). However, differences among the analysts’
experience levels suggests improving training and technical
proficiency would improve the robustness of this assay.
The interlaboratory data were also evaluated using a
quali-tative approach in which the test samples were classified as
negative, intermediate, or positive based on direct comparison
of the ODs of test and control samples as described in
Mate-rials and Methods above (Table 2). Overall, the results were
consistent with the quantitative results: the low-concentration
samples were most frequently classified as negative,
high-con-centration samples as positive, and remaining samples as
in-termediate. For example, the antibody-negative sample was
classified as negative 100% of the time, and a
low-concentra-tion sample (mean concentralow-concentra-tion of 32 EU/ml) was negative
91% of the time. For the two samples (5 and 6) with
concen-trations slightly above the CIII value of 94 EU/ml, the test
samples were positive 74% and 76% of the time, respectively,
while the two samples (7 and 8) with the highest anti-PT
concentrations were positive 100 and 99% of the time,
respec-tively. These data indicate that a qualitative approach is
feasi-ble for this assay once appropriate anti-PT threshold values are
established using positive and negative serum samples
col-lected and evaluated in clinical studies.
Technical proficiency requirements were refined.
Proce-dures to qualify each analyst were updated to allow for
addi-tional training and a more rigorous demonstration of technical
proficiency prior to test implementation. Reagents were
opti-mized to ensure that final OD readings were approximately
2.0, which is within the working range for most
spectropho-tometers. Additionally, longer-term stability studies suggested
FIG. 1. Plot of Mandel’s
k
statistic by sample within analyst (1 to 8). Analyst order was determined by visual observation of least-variable analyst
to most-variable analyst; sample order is the same as shown in Table 1 (samples with values of
⬍
15 EU/ml were excluded from this analysis). The
height of the bar is proportional to the analyst’s variability per sample.
TABLE 2. Qualitative evaluation results of the IgG anti-PT ELISA
test during an interlaboratory collaborative study
aSample identifier
Mean sample concentrations
(EU/ml)b
No. of resultsc
% of determinations scored as:
Negative (ODS⬍ ODCII)
Intermediate (ODSⱖODCII and⬍ODCIII)
Positive (ODSⱖ ODCIII)
S1
⬍
15
39
100
0
0
S2
32
32
91
9
0
S3
53
104
42
54
4
S4
74
99
3
71
26
S5
100
34
0
26
74
S6
109
34
3
21
76
S7
148
97
0
0
100
S8
230
93
1
0
99
a
The OD of samples (ODS) were compared with the OD of controls CII and CIII (ODCIIand ODCIII, respectively). Boldface (samples S3 and S4) indicates those samples with an IgG anti-PT concentration between those of CII (49 EU/ml) and CIII (94 EU/ml).
b
ELISA units/ml.
c
All results from valid plates were used provided that the %CV criteria were met for CII, CIII, and sample. Qualitative analyses were based solely on ODs; no results were excluded based on calculated values of⬍15 EU/ml or⬎480 EU/ml.
on August 17, 2020 by guest
http://cvi.asm.org/
that the lyophilized HRP-conjugated secondary antibody had
lost activity following a year of storage. To address the stability
issues and to facilitate production, the conjugate storage buffer
was changed to 50% glycerol. The conjugate stored in 50%
glycerol was used in the subsequent analytical validation study.
Based on these refinements, a new set of prototype kits was
produced for the analytical validation study.
Analytical validation.
Our prespecified acceptance criterion
for intra-assay precision required that the intra-assay %CV
would not exceed 25% for each sample with mean
concentra-tions between 50 and 200 EU/ml. The intra-assay variability
ranged from 8% to 25% when samples ranged from 50 to 200
EU/ml and from 8% to 27% when samples ranged from 49 to
217 EU/ml (Table 3). Intermediate precision was used to
as-sess interassay variability and analyst-to-analyst variability,
while reproducibility was used to evaluate the amount of
vari-ability between laboratories. The acceptance criteria for
inter-mediate precision and reproducibility stated that for each
sam-ple with study mean concentrations between 50 and 200 EU/
ml, neither the analyst-to-analyst %CV nor the site-to-site
%CV, respectively, would exceed 30%, as estimated through
the statistical model. For 50- to 200-EU/ml samples, the
inter-mediate precision ranged from 22% to 29%CV and
reproduc-ibility %CV ranged from 23% to 28%. Thus, all prespecified
precision criteria were met (Table 3).
Studies conducted during the assay trial revealed that the
electronic pipette used by analyst 1 at site B had been
appro-priately calibrated in the single dispense mode but not in the
multiple dispense mode. The multiple dispense mode was used
during the analytical validation. Although these data were
in-cluded in the primary analysis, when data from analyst 1 at site
B were removed during secondary analysis, the intermediate
precision %CV for samples in the range of 50 to 200 EU/ml
decreased from 24% to 15% and the reproducibility %CV
decreased from 23% to 20% (Table 3). Other analysis
indi-cated that major sources of variability were the intra-assay,
plate-to-plate, and analyst-to-analyst variations. The
day-to-day and site-to-site variations made little contribution to the
total variability.
Accuracy was evaluated using U.S. reference serum CBER3
(25, 39). According to the preestablished acceptance criteria,
the geometric mean concentrations from three independent
assays for samples containing 50 and 100 EU/ml had to be
within 80% and 125% of the true value. Three assay
determi-nations of samples containing 150 and 200 EU/ml had to be
within 74% and 135% of the true value. These accuracy criteria
were met for samples containing 50 to 150 EU/ml, which are
concentrations deemed most critical. However, the measured
value for the 200-EU/ml sample had a percent accuracy of 72
and did not meet the acceptance criteria (Table 4). When the
newly adopted WHO pertussis reference reagent, NIBSC 06/
140, became available, a secondary evaluation was performed
using this reagent. Specifically, when the concentrations of
diluted NIBSC 06/140 samples were measured in the ELISA,
the concentration measured in EU closely matched the
as-signed value in IU (Table 5). Under the assumption that 1 EU
is approximately equal to 1 IU (39), the percent accuracy for
the NIBSC 06/140 samples was 100% to 112% for
concentra-tions between 50 and 200 EU/ml (Table 5).
Recovery was analyzed by spiking 6 positive serum samples
independently three times with reconstituted standards,
yield-ing 18 samples with final concentrations rangyield-ing from 42 to 214
EU/ml. The acceptance criteria stated that 15 out of these 18
TABLE 3. Precision results of IgG anti-PT ELISA
aParameter
%CV for sample (geometric mean concn关EU/ml兴)
S1 (49) S2 (58) S3 (83) S4 (100) S5 (135) S6 (204) S7 (217)
Intra-assay precision
Analyst 1
22
25
18
15
24
15
21
Analyst 2
16
12
8
10
13
15
13
Analyst 3
12
10
15
10
14
14
13
Analyst 4
12
12
11
12
14
12
14
Analyst 5
16
16
18
21
17
19
18
Analyst 6
17
14
13
13
16
12
27
Interassay precision
Site A
22
23
22
24
23
23
26
Site B
21
29
23
21
25
21
26
Site B
b16
17
15
16
18
19
22
Reproducibility
Site-to-site
23
28
23
23
27
25
29
Site-to-site
c20
22
20
21
23
23
27
a
Samples are ordered from low to high concentrations. Boldface (samples 2 to 5) indicates those samples with an IgG anti-PT concentration in the range analyzed under the prespecified acceptance criteria (50 to 200 EU/ml).
b
Interassay precision without analyst 1 from site B.
c
Reproducibility without analyst 1 from site B.
TABLE 4. IgG anti-PT ELISA accuracy results obtained from
analytical validation
Anti-PT IgG concn (EU/ml)
for CBER3 (reference)
Anti-PT IgG concn (EU/ml)
% Accuracy Replicate
1
Replicate 2
Replicate 3
Geometric mean
Expected value
50 52 50 41 47 50 95
100 85 92 81 86 100 86
150 120 124 113 119 150 79
200 142 139 151 144 200 72
on August 17, 2020 by guest
http://cvi.asm.org/
samples must have an estimated recovery within 75% to 133%.
All 18 samples met this criterion, with percent recoveries
rang-ing from 90% to 117%; thus, the recovery criterion was met.
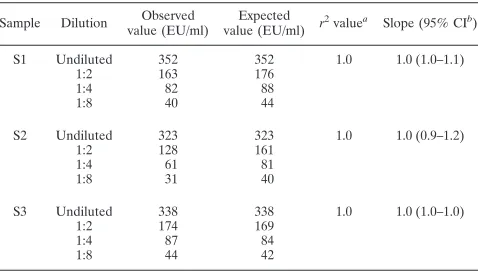
Linearity was assessed by measuring the concentration of
samples prepared by diluting high-concentration serum
sam-ples with antibody-negative serum and then plotting the
ob-served verses expected values. The acceptance criteria stated
that the 95% confidence limits for the slope of this plot should
be contained in the interval between 0.67 and 1.50 and the
r
2value should not be less than 0.95. For all three samples, the
measured slope was 1.0 with all 95% confidence intervals
within the range from 0.9 to 1.2; the
r
2value was 1.0 (Table 6).
Thus, the linearity criterion was met, and the data suggest
excellent linearity for the range from 40 to 338 EU/ml.
The data from the analytical validation study were also
eval-uated using the qualitative approach described for the
inter-laboratory collaborative study. The data are similar to those
presented in the collaborative study, providing further support
for the conclusion that the assay could easily be adapted to a
qualitative format once clinically validated cutoff values for
infection are obtained.
DISCUSSION
The overall goal of this project was to develop an ELISA kit
that could accurately and precisely measure the concentrations
of IgG anti-PT in the range of interest for diagnostic assays.
Critical reagents were prequalified so that the assay could be
performed by any laboratory with immunoassay equipment
and experience. Because a variety of clinical laboratories have
adopted proposed threshold cutoffs of 49 to 200 EU/ml, the
assay and validation protocol were designed to measure
sam-ples within this range. We sought optimal performance around
100 EU/ml. Based on these considerations, an assay kit was
assembled containing six lyophilized serum standards that
tested the limits of the assay from 15 to 480 EU/ml. The kit also
included a commercially available, well-characterized
mono-clonal antibody and lyophilized positive, negative, and
inter-mediate controls. The controls were devised to test whether
the assay could be used in either a quantitative or qualitative
manner to aid disease diagnosis. Because the most appropriate
cutoffs have yet to be confirmed, the current kit employs assay
controls targeting the concentrations of 0, 49, and 94 EU/ml as
proposed by Baughman et al. (2). When studies to confirm the
cutoffs are completed, the assay controls will be revised.
Several benefits were obtained by performing an
interlabo-ratory collaborative study prior to the analytical validation.
Most importantly, we learned that the assay could be
trans-ferred and that analysts with no experience with this specific
assay could perform the test successfully in both the
quantita-tive and qualitaquantita-tive formats. Additionally, the results and
feed-back from the participants provided valuable insight for
im-provements in the method. Specifically, the written procedures
were refined and clarified, the number of successful assays
required for qualification of an analyst was increased, and
reagents were adjusted to bring the OD readings into a
nar-rower range.
The data presented here demonstrate that the kit met all
prespecified criteria for precision, linearity, and accuracy for
samples with IgG anti-PT antibody concentrations in the range
of 50 to 150 EU/ml, the range believed to be most relevant for
serodiagnosis. The assay met the precision and linearity
crite-ria for a wider range, 50 to 200 EU/ml; however, the primary
accuracy criterion was not met for the sample at 200 EU/ml.
Specifically, the concentration of the 200-EU/ml sample of
CBER3 was underestimated by approximately 28%. The
rea-son for the underestimation of CBER3 at 200 EU/ml remains
unknown; however, a follow-up study using NIBSC 06/140
demonstrated that the assay met the predefined criterion at all
concentrations tested, including 200 IU/ml. Additionally, the
linearity assessment with three positive sera (Table 6)
indi-cated excellent linearity over the range from 42 to 352 EU/ml.
These data suggest that the underestimation is limited to the
CBER3 samples, and an investigation has begun to determine
whether the results for CBER3 were influenced by the age or
storage conditions of the preparations tested. Testing to
un-derstand the discrepancy between high-titer samples of NIBSC
06/140 and CBER3 are ongoing. The failure of CBER3 to
meet acceptance criteria should not compromise the
applica-bility of this assay provided future diagnostic thresholds are
limited to values lower than 200 EU/ml.
Together, the interlaboratory collaborative and analytical
validation studies indicate that the kit is relatively easy to
transfer and perform. Both studies suggest the importance of
establishing training and technical proficiency requirements
prior to test implementation. For future studies, we
recom-mend that one or more known positive serum samples be
added to each assay in addition to the lyophilized controls. The
TABLE 6. IgG anti-PT ELISA linearity results obtained from
analytical validation
Sample Dilution Observed value (EU/ml)
Expected value (EU/ml) r
2valuea Slope (95% CIb)
S1 Undiluted 352 352 1.0 1.0 (1.0–1.1)
1:2 163 176
1:4 82 88
1:8 40 44
S2 Undiluted 323 323 1.0 1.0 (0.9–1.2)
1:2 128 161
1:4 61 81
1:8 31 40
S3 Undiluted 338 338 1.0 1.0 (1.0–1.0)
1:2 174 169
1:4 87 84
1:8 44 42
aCoefficient of determination. bCI, confidence interval.
TABLE 5. IgG anti-PT ELISA accuracy results using WHO
pertussis antiserum (human) reference reagent
Anti-PT IgG concn (IU/ml)
for NIBSC 06/140 (reference)a
Anti-PT IgG concn (EU/ml)
% Accuracyb
Replicate 1
Replicate 2
Replicate 3
Geometric mean
Expected valueb
50 56 54 57 56 50 112
100 109 101 104 105 100 105
150 152 147 151 150 150 100
200 197 247 196 212 200 106
a
WHO Pertussis antiserum (human) reference reagent, NIBSC 06/140.
b
Expected value and accuracy calculations were based on the assumption that 1 IU⫽1 EU (39).
on August 17, 2020 by guest
http://cvi.asm.org/
serum control would be diluted along with the unknown
sam-ples and tracked over time to assess the stability of the kit and
continued qualification of the analyst. In addition, a
profi-ciency panel of serum should be established and provided to all
testing laboratories to evaluate the continued performance of
each testing laboratory. Results of the proficiency panel and
the positive-control serum can be used to qualify new
person-nel and evaluate the ongoing competency of personperson-nel
per-forming the assay.
Tetanus-diphtheria-acellular pertussis vaccines, which were
introduced into the adult population in 2005 (5, 6) may induce
elevated anti-PT IgG titers for a short time after vaccination,
requiring reevaluation of the diagnostic threshold (18, 28).
Finally, while the assay was designed and evaluated to quantify
anti-PT titers, the preliminary results presented here
demon-strate that the assay can serve in a qualitative format once optimal
threshold cutoffs are defined, thus eliminating the need for a
full set of standards. Such a format would reduce the number
of procedural manipulations needed to physically perform the
assay, and it would simplify the interpretation of the results by
eliminating the need for a statistical analysis program. This
would facilitate adoption and use by regional or state health
departments to assess pertussis outbreaks and measure the
burden of disease in adolescents and adults. In fact, the
pos-sibility of making this kit widely available has been proposed
for future evaluation.
In conclusion, the anti-PT IgG ELISA met all assay
valida-tion parameters within a range of 50 to 150 EU/ml. This
ELISA was developed and analytically validated to be a
user-friendly kit that can be used for both qualitative and
quantita-tive purposes. With the analytical validation of this test, the
first part of a two-phase project has been completed. In the
second phase, now under way at CDC, the test is being
eval-uated in a prospective multisite clinical trial that will evaluate
the sensitivity, specificity, and predictive values of this kit and
two other diagnostic tools (PCR and culture). Once subjected
to appropriate clinical assessment and once diagnostic
thresh-olds are established, this assay should be considered for
wide-scale use in public health, which would add an important tool
for pertussis diagnosis.
ACKNOWLEDGMENTS
This project was funded in part by an interagency agreement
be-tween the CDC and the FDA/CBER.
We acknowledge GlaxoSmithKline for providing the purified
per-tussis toxin antigens used in this study. We also acknowledge Trudy
Murphy, CDC, Atlanta, GA, for assistance in obtaining funding for
this project; Kristine Bisgard, CDC, Atlanta, GA, for procurement of
sera and other reagents; Pamela Cassiday, CDC, Atlanta, GA, for
collection and handling of reagents; Teresa Kenney, CDC, Atlanta,
GA, for input on the analytical validation protocol and for serving as
an analyst in the analytical validation; Freyja Lynn, FDA/CBER,
Rockville, MD, for discussions on assay design; Lokesh Bhattacharyya,
FDA/CBER, Rockville, MD, for input on the development of the
analytical validation protocol; Christine Anderson FDA/CBER,
Rock-ville, MD, for reagent lyophilization and shipping of supplies and kits
to study collaborators; Bruce Lowe, FDA/CBER, Rockville, MD, for
reagent preparation and lyophilization; Lindsay Swanson, Colorado
Department of Public Health, Denver, CO, for serving as an analyst in
the collaborative study; and Kris Ehrismann, Cynthia Kenyan, and
Claudia Miller, Minnesota Department of Health, St. Paul, MN, and
Stephanie Schauer, Susan Lett, and Linda Han, Massachusetts
De-partment of Health, Boston, MA, for collection and handling of
pos-itive plasma.
The Pertussis Assay Working Group included Gary Sanden, CDC,
Atlanta, GA (discussions on design and methodology and procurement
and storage of sera and other reagents); Barbara A. Slade, CDC, Atlanta,
GA (coordination of the assay development working group); Patricia
P. Wilkins, CDC, Atlanta, GA (discussions on design and
methodol-ogy; also analyst in the collaborative study); Jody Peters, Vanderbilt
University, Nashville, TN, Gregory L. Waidmann, Colorado
Depart-ment of Public Health, Denver, CO, and Leslie Wagner, CBER, FDA,
Bethesda, MD (analysts in the collaborative study); and Nicolette
deVore and Anita Verma, CBER, FDA, Bethesda, MD (analysts in
the analytical validation).
The findings and conclusions in this article have not been formally
disseminated by the Food and Drug Administration or the Centers for
Disease Control and Prevention and should not be construed as
rep-resenting any agency determination or policy.
REFERENCES
1.Andre, P., V. Caro, E. Njamkepo, A. M. Wendelboe, A. Van Rie, and N. Guiso.2008. Comparison of serological and real-time PCR assays to diag-noseBordetella pertussisinfection in 2007. J. Clin. Microbiol.46:1672–1677. 2.Baughman, A. L., K. M. Bisgard, K. M. Edwards, D. Guris, M. D. Decker, K. Holland, B. D. Meade, and F. Lynn.2004. Establishment of diagnostic cutoff points for levels of serum antibodies to pertussis toxin, filamentous hemag-glutinin, and fimbriae in adolescents and adults in the United States. Clin. Diagn. Lab. Immunol.11:1045–1053.
3.Baughman, A. L., K. M. Bisgard, F. Lynn, and B. D. Meade.2006. Mixture model analysis for establishing a diagnostic cut-off point for pertussis anti-body levels. Stat. Med.25:2994–3010.
4.CDC.2007. Outbreaks of respiratory illness mistakenly attributed to pertus-sis—-New Hampshire, Massachusetts, and Tennessee, 2004–2006. MMWR
56:837–842.
5.CDC.2006. Preventing tetanus, diphtheria, and pertussis among adolescents: use of tetanus toxoid, reduced diphtheria toxoid and acellular pertussis vaccines. Recommendations of the Advisory Committee on Immunization Practices (ACIP). MMWR Recomm. Rep.55:1–34.
6.CDC.2006. Preventing tetanus, diphtheria, and pertussis among adults: use of tetanus toxoid, reduced diphtheria toxoid and acellular pertussis vaccine. Recommendations of the Advisory Committee on Immunization Practices (ACIP) and recommendation of ACIP, supported by the Healthcare Infec-tion Control Practices Advisory Committee (HICPAC), for use of Tdap among health-care personnel. MMWR Recomm. Rep.55:1–37.
7.Cherry, J. D.2006. Epidemiology of pertussis. Pediatr. Infect. Dis. J.25:361– 362.
8.Cherry, J. D.2005. The epidemiology of pertussis: a comparison of the epidemiology of the disease pertussis with the epidemiology ofBordetella pertussisinfection. Pediatrics115:1422–1427.
9.de Melker, H. E., F. G. Versteegh, M. A. Conyn-Van Spaendonck, L. H. Elvers, G. A. Berbers, A. van Der Zee, and J. F. Schellekens.2000. Specificity and sensitivity of high levels of immunoglobulin G antibodies against per-tussis toxin in a single serum sample for diagnosis of infection withBordetella pertussis. J. Clin. Microbiol.38:800–806.
10.Edwards, K. M.2005. Overview of pertussis: focus on epidemiology, sources of infection, and long term protection after infant vaccination. Pediatr. Infect. Dis. J.24:S104–S108.
11.Forsyth, K., M. Nagai, A. Lepetic, and E. Trindade.2005. Pertussis immu-nization in the global pertussis initiative international region: recommended strategies and implementation considerations. Pediatr. Infect. Dis. J.24:S93– S97.
12.Forsyth, K. D., C. H. Wirsing von Konig, T. Tan, J. Caro, and S. Plotkin.
2007. Prevention of pertussis: recommendations derived from the second Global Pertussis Initiative roundtable meeting. Vaccine25:2634–2642. 13.Fry, N. K., O. Tzivra, Y. T. Li, A. McNiff, N. Doshi, P. A. Maple, N. S.
Crowcroft, E. Miller, R. C. George, and T. G. Harrison.2004. Laboratory diagnosis of pertussis infections: the role of PCR and serology. J. Med. Microbiol.53:519–525.
14.Giammanco, A., A. Chiarini, P. A. Maple, N. Andrews, R. Pebody, N. Gay, R. M. Olander, F. Fivet-Groyne, S. Baron, A. Tischer, S. Swidsinski, J. Schellekens, and E. Reizenstein.2003. European Sero-Epidemiology Net-work: standardisation of the assay results for pertussis. Vaccine22:112–120. 15.Giammanco, A., A. Nardone, R. Pebody, G. Kafatos, N. Andrews, A. Chia-rini, S. Taormina, F. de Ory, K. Prosenc, B. Krize, H. Hallander, M. Ljung-man, E. Marva, A. Tsakris, D. O’Flanagan, F. Schneider, A. Griskevicius, R. Vranckx, and I. Karacs. 2008. European Sero-Epidemiology Network 2: standardisation of immunoassay results for pertussis requires homogeneity in the antigenic preparations. Vaccine26:4486–4493.
16.Guris, D., P. M. Strebel, B. Bardenheier, M. Brennan, R. Tachdjian, E. Finch, M. Wharton, and J. R. Livengood.1999. Changing epidemiology of
on August 17, 2020 by guest
http://cvi.asm.org/
pertussis in the United States: increasing reported incidence among adoles-cents and adults, 1990–1996. Clin. Infect. Dis.28:1230–1237.
17.Kosters, K., M. Riffelmann, B. Dohrn, and C. H. von Konig.2000. Compar-ison of five commercial enzyme-linked immunosorbent assays for detection of antibodies toBordetella pertussis. Clin. Diagn. Lab. Immunol.7:422–426. 18.Le, T., J. D. Cherry, S. J. Chang, M. D. Knoll, M. L. Lee, S. Barenkamp, D. Bernstein, R. Edelman, K. M. Edwards, D. Greenberg, W. Keitel, J. Treanor, and J. I. Ward.2004. Immune responses and antibody decay after immuni-zation of adolescents and adults with an acellular pertussis vaccine: the APERT Study. J. Infect. Dis.190:535–544.
19.Litt, D. J., D. Samuel, J. Duncan, A. Harnden, R. C. George, and T. G. Harrison.2006. Detection of anti-pertussis toxin IgG in oral fluids for use in diagnosis and surveillance ofBordetella pertussisinfection in children and young adults. J. Med. Microbiol.55:1223–1228.
20.Lynn, F., G. F. Reed, and B. D. Meade.1996. Collaborative study for the evaluation of enzyme-linked immunosorbent assays used to measure human antibodies toBordetella pertussisantigens. Clin. Diagn. Lab. Immunol.3:689– 700.
21.Mandel, J.1991. Evaluation and control of measurements. Marcel Dekker, Inc., New York, NY.
22.Mandel, J.1991. The validation of measurement through interlaboratory studies. Chemom. Intell. Lab. Syst.11:109–119.
23.Marchant, C. D., A. M. Loughlin, S. M. Lett., C. W. Todd, L. H. Wetterlow, R. Bicchieri, S. Higham, P. Etkind, E. Silva, and G. R. Siber.1994. Pertussis in Massachusetts, 1981–1991: incidence, serologic diagnosis, and vaccine effectiveness. J. Infect. Dis.169:1297–1305.
24.Mattoo, S., and J. D. Cherry.2005. Molecular pathogenesis, epidemiology, and clinical manifestations of respiratory infections due toBordetella pertus-sisand otherBordetellasubspecies. Clin. Microbiol. Rev.18:326–382. 25.Meade, B. D., A. Deforest, K. M. Edwards, T. A. Romani, F. Lynn, C. H.
O’Brien, C. B. Swartz, G. F. Reed, and M. A. Deloria.1995. Description and evaluation of serologic assays used in a multicenter trial of acellular pertussis vaccines. Pediatrics96:570–575.
26.Prince, H. E., M. Lape-Nixon, and J. Matud.2006. Evaluation of a tetraplex microsphere assay forBordetella pertussisantibodies. Clin. Vaccine Immunol.
13:266–270.
27.Reder, S., M. Riffelmann, C. Becker, and C. H. Wirsing von Konig.2008. Measuring immunoglobulin G antibodies to tetanus toxin, diphtheria toxin, and pertussis toxin with single-antigen enzyme-linked immunosorbent assays and a bead-based multiplex assay. Clin. Vaccine Immunol.15:744–749.
28.Riffelmann, M., M. Littmann, C. Hulsse, and C. H. von Konig.2009. Anti-body decay after immunisation of health-care workers with an acellular pertussis vaccine. Eur. J. Clin. Microbiol. Infect. Dis.28:275–279. 29.Riffelmann, M., C. H. Wirsing von Konig, V. Caro, and N. Guiso.2005.
Nucleic acid amplification tests for diagnosis ofBordetellainfections. J. Clin. Microbiol.43:4925–4929.
30.Rothstein, E., and K. Edwards.2005. Health burden of pertussis in adoles-cents and adults. Pediatr. Infect. Dis. J.24:S44–S47.
31.Tatti, K. M., K. H. Wu, M. L. Tondella, P. K. Cassiday, M. M. Cortese, P. P. Wilkins, and G. N. Sanden.2008. Development and evaluation of dual-target real-time polymerase chain reaction assays to detectBordetellaspp. Diagn. Microbiol. Infect. Dis.61:264–272.
32.Tondella, M. L., G. M. Carlone, N. Messonnier, C. P. Quinn, B. D. Meade, D. L. Burns, J. D. Cherry, N. Guiso, E. L. Hewlett, K. M. Edwards, D. Xing, A. Giammanco, C. H. Wirsing von Konig, L. Han, L. Hueston, J. B. Robbins, M. Powell, C. M. Mink, J. T. Poolman, S. W. Hildreth, F. Lynn, and A. Morris. 2009. InternationalBordetella pertussis assay standardization and harmonization meeting report. Centers for Disease Control and Prevention, Atlanta, Georgia, United States, 19–20 July 2007. Vaccine27:803–814. 33.Trollfors, B., T. Lagergard, E. Gunnarsson, and J. Taranger.2003.
Deter-mination of pertactin IgG antibodies for the diagnosis of pertussis. Clin. Microbiol. Infect.9:585–589.
34.van Gageldonk, P. G., F. G. van Schaijk, F. R. van der Klis, and G. A. Berbers.2008. Development and validation of a multiplex immunoassay for the simultaneous determination of serum antibodies toBordetella pertussis, diphtheria and tetanus. J. Immunol. Methods335:79–89.
35.Watanabe, M., B. Connelly, and A. A. Weiss.2006. Characterization of serological responses to pertussis. Clin. Vaccine Immunol.13:341–348. 36.Wendelboe, A. M., and A. Van Rie.2006. Diagnosis of pertussis: a historical
review and recent developments. Expert Rev. Mol. Diagn.6:857–864. 37.Wirsing von Konig, C. H., D. Gounis, S. Laukamp, H. Bogaerts, and H. J.
Schmitt.1999. Evaluation of a single-sample serological technique for diag-nosing pertussis in unvaccinated children. Eur. J. Clin. Microbiol. Infect. Dis.
18:341–345.
38.Wirsing von Konig, C. H., S. Halperin, M. Riffelmann, and N. Guiso.2002. Pertussis of adults and infants. Lancet Infect. Dis.2:744–750.
39.Xing, D., C. H. Wirsing von Konig, P. Newland, M. Riffelmann, B. D. Meade, M. Corbel, and R. Gaines-Das.2009. Characterization of reference materials for human antiserum to pertussis antigens by an international collaborative study. Clin. Vaccine Immunol.16:303–311.