ISSN 2348 – 7968
317
Digital Media Authentication Method for Acoustic Environment
Detection
Tejashri Pathak, Prof. Devidas Dighe
Department of Electronics and Telecommunication, Savitribai Phule Pune University, Matoshri College of Engineering and Reseach Center, Nasik, India
Abstract
There are many t artifact and different distortions present in the recording. The reflections of sound depend on the geometry of the room and it causes the smearing of the recording called as reverberation. The background noise depends on the unwanted audio source activities present in the evidential recording. For digital media to be considered as proof in a court its authenticity must be verified. A technique proposed is based on spectral subtraction to estimate the amount of reverberation. Also nonlinear filtering based on particle filtering is used to estimate the background noise. Feature extraction is by using MFCC approach. The feature vector is the addition of features from acoustic reverberation and background noise. SVM classifier is used for classification of the environments. Overall system performance is better than previous.
Keywords: Reverberation, Background noise, particle filters
1. Introduction
Audio forensic investigations are of three types,
authentication, enhancement and interpretation.
Authentication stage verifies the originality by
physical examination. Enhancement stage is for
noise reduction of the recorded audio, to
increase the understanding. In the interpretation,
the environment and the background noises
present in the recording are estimated.
From last three decades use of digital media such
as audio, video, and images as evidence in law
and criminal justice is increasing [1]. The
objectives of audio forensics are 1.To
authenticate the digital evidence 2.To perform
the enhancement of audio recording. To use
digital media as evidence, its originality must be
verified. However, it will be difficult if the
evidence is available in compressed format and
depends on geometry of the room and secondary
audio source activities present if any. The
powerful digital media editing tools has made
authentication of digital media even more
difficult.
The usual steps for forensic audio examination
are [2] -- 1.
Physical Inspection:
checks the
condition and properties of the audio recording
medium. 2.
Critical Listening:
Listen the entire
recording and estimates the editing with the
recording. 3.
Spectrogram
is used to identify
the editing in the original recording.
In the authentication Electric Network
Frequency (ENF) method, The difference
between the measured ENF from the recording
and the known ENF database of electric grid
signal helps to justify the originality of the
recording and find the time and place of the
recording. The enhancement may be in spatial or
frequency domain. In time domain the noise
gates and automatic gain control are used. Gain
adjustment is for normalizing the amplitude
envelope and Noise gate compares level of the
input signal with the set level for threshold, but
it fails if both noise and signal occur
simultaneously. Frequency domain approach
consists of frequency selective filters and
spectral subtraction. In spectral subtraction,
subtract the calculated estimate of short term
noise spectrum from the spectrum of short
frames of input noise signal. However, success is
dependent on reliability of the noise spectrum
estimation.
2. Literature Review
The digital media can be authenticated by various techniques, widely used are ENF analysis, pattern recognition system, and time and frequency domain analysis system.
2.1 ENF Method: This ENF signal is captured
because of lacking of adequate regulation of the mains supply [3]. Fast Fourier Transform (FFT) is used to calculate the periodicity of short time frame. The ENF is
ISSN 2348 – 7968
318 where ∆f is the difference between instantaneous
frequency and set point frequency.
D. Rodriguez and A. Apolinario proposed a method to detect the phase discontinuity of the grid signal [4]. The steps used are first down sample the recording signal around 50 Hz value. Next use a very sharp linear phase FIR filter to bandpass the signal output of first stage. In the third stage divide the filtered output in blocks each having NC cycles of nominal ENF and overlapping the previous block, after this the signal is segmented. In fourth stage estimate the phase of all segmented blocks using DFT or DFT1.
ᆞDFT=arg [X(kpeak)] (2)
The phase of the single tone is calculated by DFT1 method
(3) The disadvantages of ENF discontinuity method is
that this method fails if the recording is done with high quality microphone devices or battery operated devices.
2.2 Statistical Pattern Recognition Method: A.
Oermann, A. Lang and J. Dittmann introduced the idea about Verifier-Tuple approach. In this method a speaker’s environment was estimated by the background noise and the microphones used [5]. It is used especially for audio feature extraction applications. There are four parts: the syntax (S), executive semantics (SEE), functional semantics (SEF) and interpretative semantics (SEI). Each part represents a layer of information which is used to recover the whole content
V = {SY, SEE, SEF, SEI} (4) Formal logic is used to estimate the syntax of a language. Semantics helps us to find the intentions of speaker. It needs more detailed analysis and classification of the information.
R. Malkin and A. Waibel introduced a method for classifying user environments for mobile applications [6].In this method a linear autoencoding neural network was used because of the fact that biological coding systems are influenced by their environments. R. Buchholz, C. Kraetzer and J. Dittmann introduced an idea of extracting Fourier coefficient histogram of near silence frames of the audio recording as the feature vectors [7]. The feature extractor was applied
to only frames that contain noise and all Fourier coefficients summed up to give us the Fourier coefficient histogram. This histogram is used as global feature vector. The classification is done by machine learning tool.
2.3 Acquisition Device Identification Method: D.
Garcia - Romero and C. Espy – Wilson presented an approach on the automatic acquisition device identification (AADI). [8]. Here intrinsic characteristics of the microphone were captured by a template which is designed by using GMM trained on device speech recordings. The intrinsic fingerprint of an acquisition device is defined as the Gaussian Super vector (GSV) θ calculated from speech taken from device and the Universal Background model (UBM). This approach is unsuitable for blind speech detection. Y. Panagakis and C. Kotropoulos developed a method for automatic telephone handset identification by sparse representation of random spectral features (RSF) is considered as the intrinsic fingerprints used for device identification [9]. These speech features are estimated as follows 1. The spectrogram of the speech recording is estimated 2. It is averaged across time axis giving the mean spectrogram. 3. The dimensions of this are reduced with the help of random projections and the output of third step gives us RSFs. The RSFs provide performance improvement for detecting devices over MFCC approach.C. Kraetzer, K. Qian, M. Schott and J. Dittmann proposed a contextual model for microphone forensics [10]. First step is to design a suitable context model for microphone recordings by using five stage recording process pipelines. In second step, the context model is applied to the system to identify the microphone devices using second order derivative based MFCC features. The disadvantages of these AADI methods are they were unable to provide the link between the recording and the microphones.
2.4 Acoustic Reverberation Estimation Method:
ISSN 2348 – 7968
319 modeled as an exponentially damped Gaussian white
noise process. The RT estimate was calculated by maximum likelihood estimation.
G. Soulodre proposed a system to calculate reverberation content of an audio signal [12]. The characteristics of the reverberant system were described by the impulse response (IR). The frequency domain representation of IR is by Fourier transform. The IR which contains the reverberant components was represented into blocks. The aim of using perceptual model was to reduce the hearing of distortions generated from the processing. Masking was used for making the unused part of the reverberant signal inaudible. So only the audible part of the reverberation signal was extracted using FIR filter of sufficient length, further problems created by FIR filter can be removed by using an IIR filter.
2.5 Model Driven Approaches to Estimate Acoustic Reverberation Signature for Acoustic Environment Detection: U. Chaudhary and H.
Malik proposed a mathematical framework for automatic recording environment identification using acoustic signature from audio recording [13]. Reverberation is used to calculate the acoustic environment signature.
For classification purpose clustering method used is Competitive Neural Network (CNN). S. Ikram and H. Malik presented a method based on background noise in the audio [14]. This method depends on two step speech enhancement. The first step consists of background noise estimation by spectral subtraction based on geometric approach. In second step harmonic analysis is used to remove the leakage from speech. A multiband spectral subtraction method is used to discard leakage from background noise. H. Malik and J. Miller proposed a mathematical framework for microphone identification [15]. The microphone response is characterized in terms of physical parameters of a microphone. Here microphone distortions are modeled as a nonlinear function. The higher order statistics based on third order cumulants are used to estimate distortions in the microphones as it reveal amplitude as well as phase information of a process. H. Malik proposed a method to fight replay attack in a speaker identification system [16]. Above technique is modified to find the nonlinearities due to replay attack. For the detection between original and cloned
recording invariant moments of bicoherance spectrum are used. H. Zhao and H. Malik presented a method to find the acoustic environment traces in the recordings [17]. It is a statistical method to distinguish the recording environments. The method uses inverse filtering to calculate RT and particle filter approach is used to calculate background noise. RT is calculated by blind dereverberation (BD) algorithm. However, in BD algorithm not possible to measure FIR filters response. To over this problem a perceptually relevant model is used.
3. Proposed System
3.1 Existing System: As discussed in section two,
the ENF discontinuity method provides a visual aid to detect the phase changes in the original audio recording. The sudden phase changes in the waveform provide us the information about the editing points where the original recording is tempered; however it fails to perform if the recording is done with high quality audio devices.
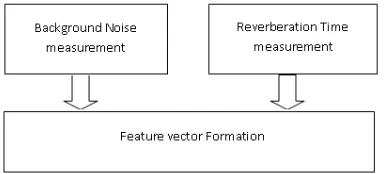
3.2 Proposed System: The proposed system can be
divided into three subsystems: a) Background noise measurement system. b) Reverberation time measurement system. c) Combined feature vector extraction. In proposed system the acoustic environment signature is related to acoustic reverberation and background noise. Reverberation is the extended effect of sound after it is generated from the source. The acoustic reverberation is estimated by BD algorithm. In BD original dry signal is separated from the reverberation signal. The signal y(t) is the addition of dry signal s(t) and reverberation signal r(t). The main aim of dereverberation is to extract r(t) from a enhanced recording.
Fig. 1 General Block Diagram of the Proposed System
ISSN 2348 – 7968
320 (5)
represent the room impulse response. The acoustic environment is considered to be a stationary. Under this assumption the room impulse response is modeled as a finite impulse response (FIR) filter with sufficient length. The background noise is modeled as a dynamic system. As the real world noise is nonstationary in nature so noise is modeled using the particle filter approach. The weights of a particle are the likelihood for each sample j out of J samples and these samples are called as particles. The Sequential Importance Sampling (SIS) particle filter is used for importance sampling purpose. The degeneracy problem in SIS filter is removed by residual resampling method. For feature extraction MFCC approach is used.
Algorithm
Calculation of reverberant signal.
Spectral estimation is done by segmentation followed by temporal smoothing and conversion into frequency domain by MFCC and LMSC. Particle Filter initialization
Particle evolution
The prediction model is updated
The noise is calculated in the form of samples The weights are resampled to remove degeneracy problem.
Steps 2 to 7 are repeated till all frames are completed.
.
4. Summary
In ENF method FFT is used to estimate the
periodicity of a small time frame. In ENF
discontinuity method the discontinuities in the
phase waveform after DFT analysis provide the
editing points in the form of insertion and
deletions in the original recording. If the
threshold is low the large number of samples is
classified by guessing only and on the other
hand if the threshold is high the amount of signal
in the FFT results increases and the amount of
noise decreases. This degrades the performance
of the system in terms of accuracy. To overcome
these difficulties, acquisition device
identification method (ADIM) is used. In ADIM,
idea is to find out the devices used for recording
of the evidence. RSFs can identify acquisition
devices in a better way than MFCC approach.
This helps to increase the accuracy of RSF
method. RSFs provide best performance in
accuracy if given to SVM classifier. It also
provides good accuracy using SRC classifier.
This RT estimation method was used to extend
the use of decay curve to scenarios where there
are no input signals present to conduct a
reverberation experiment, However it requires
the high computational cost for implementation
because of the iterative solution of MLE
equation and suitable for passive sounds only.
In AADI method recording environment
identification accuracy is modeled as a function
of number of iterations and microphone type.
For increasing number of iteration the
identification of locations is less provided that
the number of actual locations is kept constant.
In acoustic environment traces method the blind
estimation of Acoustic Environment
Identification uses five environments need to
increase further. The full blind setting provides
successful identification of the environments for
original recordings.
5. Conclusion
Partial results of proposed algorithm are given
below; still need to apply the algorithm for
various databases to find optimal parameter
setting to generalize it.
Figure 2: (a) GUI of system, (b) result of Blind Dereverberation, (c) Spectral Estimation of signal- amplitude and phase respectively, (d) Result of SVM classification. Due to size feature vector is not shown, also
it is signal dependant.
ISSN 2348 – 7968
321 attacks. The audio recordings are taken from a
database so they are not real time. It is essential to develop an algorithm for real time recording analysis.
References
[1]. H. Zhao and H. Malik “Audio recording location identification using acoustic environment ignature,” IEEE Trans. Inf. Forensics and Security, vol. 8, no. 11, Nov 2013.
[2]. Audio Engineering Society, AES43-2000: AES standard for forensic purposes – Criteria for the authentication of analog audio tape recordings (2000). [3]. C. Grigoras, “Digital audio recording
analysis: The electric network frequency (ENF) criterion,” Int. J. Speech Lang. Law, vol. 12, no. 1, pp. 1350–1771, 2005.
[4]. D. Rodriguez, J. Apolinario, and L. Biscainho, “Audio authenticity: Detecting ENF discontinuity with high precision phase analysis,” IEEE Trans. Inf. Forensics Security,vol 5, no. 3, pp. 534–543, Sep.2010.
[5]. A. Oermann, A. Lang and J. Dittmann, “Verifier Tuple for audio forensic to determine speaker environment” in proc. ACM Multimedia and Security Workshop , New York,NY, USA, pp. 57-62, 2005.
[6]. R. Malkin and A. Waibel, “Classifying user environments for mobile applications using linear autoencoding of ambient audio, ” in Proc. IEEE Int. Conf. on Acoustic., Speech, and Signal Processing, vol. 5, pp. 509-512, 2005. [7]. R. Buchholz, C. Kraetzer and J.
Dittmann, “Microphone Classification using Fourier Coefficients,” in Lecture Notes in Comput. Sci. Berlin/Heidelberg, Germany: Springer vol 5806/2009, pp. 235-246, 2010.
[8]. D. Garcia - Romero and C. Espy – Wilson, “Automatic acquisition device identification from speech recordings,” J. Audio Eng. Soc., vol. 124, no. 4, pp. 2530-2530, 2009.
[9]. Y. Panagakis and C. Kotropoulos, “Automatic telephone handset identification by spares representation of random spectral features,” in Proc. Multimedia and Security, pp. 91-96 2012. [10].C. Kraetzer, K. Qian, M. Schott and J.
Dittmann, “A context model for microphone forensics and its application in evaluation,” Proc. SPIE Media
Watermarking, security, and Forensics III, vol. 7780, pp. 1-15, 2011.
[11].R. Ratnam, D. Jones, B. Wheeler, W. O’Brien, “Blind estimation of reverberation time,”J. Acoust. Soc. Amer., vol. 5, no. 114, pp. 2877-2892, 2003.
[12].G. Soulodre, “About this dereverberation business: A method for extracting reverberation from audio signals,” in Proc. AES 129th convention, San Francisco, CA, USA, 2010.
[13].U. Chaudhary and H. Malik, “Automatic recording environment classification using acoustic features, ” in Proc. AES 129th convention, San Francisco, CA, USA, 2010.
[14].S. Ikram and H. Malik, “Digital audio forensics using background noise,” in
Proc. IEEE Int. Conf. on Multimedia and
Expo, pp. 106–110, 2010.
[15].H. Malik and J. Miller, “Microphone identification using higher order high-order statistics,” in Proc. AES 46th conf. on Audio forensics, Denver, CO, USA, 2012.
[16].H. Malik, “Securing speaker verification system against replay attack,” in Proc. AES 46th conf. on Audio forensics, Denver, CO, USA, 2012.
[17]. H. Zhao and H. Malik, “Audio forensics using acoustic environment traces,” in Proc. IEEE Statistical Signal Processing Workshop (SSP’12), Ann Arbor, MI, USA, pp. 373-376, 2012.
[18]. Audio Engineering Society, “AES recommended practice for forensic purposes – Managing recorded audio materials intended for examination,” AES Standard AES27-1996 (r2007), 2007.
Tejashri R Pathak has completed B. E. Electronics and Telecommunication from North Maharashtra University Jalgaon and pursuing M. E. E&TC (VLSI and Embedded System) from Matoshri College of Engineering and Research Centre, Nasik-105. Her field of interest are signal processing, image processing.