EPJ Web of Conferences 14, 03003 (2011) DOI: 10.1051/epjconf/20111403003
© Owned by the authors, published by EDP Sciences, 2011
“ Fundamentals of Thermodynamic Modelling
of Materials ”
November 15-19, 2010 INSTN – CEA Saclay, France
Organized by
Bo SUNDMAN [email protected]
Constantin MEIS [email protected]
PROFESSOR & TOPIC
Pavel KORZHAVYI
MSE, KTH, SwedenTheorical data for
assesments
11/17 2010
Theoretical data for
assessments
Pavel A. Korzhavyi
Applied Materials Physics
Department of Materials Science and Engineering
School of Industrial Engineering and Management
Royal Institute of Technology (KTH), Stockholm
phase diagrams
Models for the thermodynamic properties of each phase G(T, P, y)
Database for model parameters
Predictive calculation of: thermodynamic properties
equilibrium states
First-principles theories Empirical
relations Experimental
Information
assessment
s E m
j s j s s
j end o
m G y RT n y y G
G ( ) () ()ln ( )
A modern CALPHAD flowchart
What data to feed in:
• Lattice stabilities? • Enthalpies?
• Heat capacities? • Models?
Slide 3
Success example: NIST-JANAF
data for diatomic gases
11/17 2010
Theoretical data for assessments
Internal degrees of freedom taken into account:
• Vibrational (harmonic and anharmonic)
• Rotational
• Rotation-vibration interactions
• Centrifugal stretching
• Electronic (transitions between molecular terms)
H
2
molecule
Stable state: Paired spins, symmetric
Unstable state: Unpaired spins, antisymmetric
H H
H H
Slide 5 Theoretical data for assessments 11/17 2010
Vibrational properties of dimer
molecules
Fit:
Spectrum:
Vibrational properties of dimer
molecules
Zero-point energy:
[1] K. K. Irikura, Experimental vibrational zero-point energies: Diatomic molecules , J. Phys. Chem. Ref. Data 36, 389 (2007).
Dimer Data source r0 (Å) 0 (cm1) x
0 (cm1) ZPE (cm1) 1H
2 This work 0.7517 4330.76 155.14 2126.59 Exp. [1] 0.7414 4401.21 121.34 2179.30 16O
2 This work 1.2294 1560.09 13.22 776.74 Exp. [1] 1.2075 1580.19 11.98 787.38 63Cu
2 This work 2.2149 264.55 1.02 135.14
Exp. [1] 2.2197 270.89 1.21
Slide 7 Theoretical data for assessments 11/17 2010
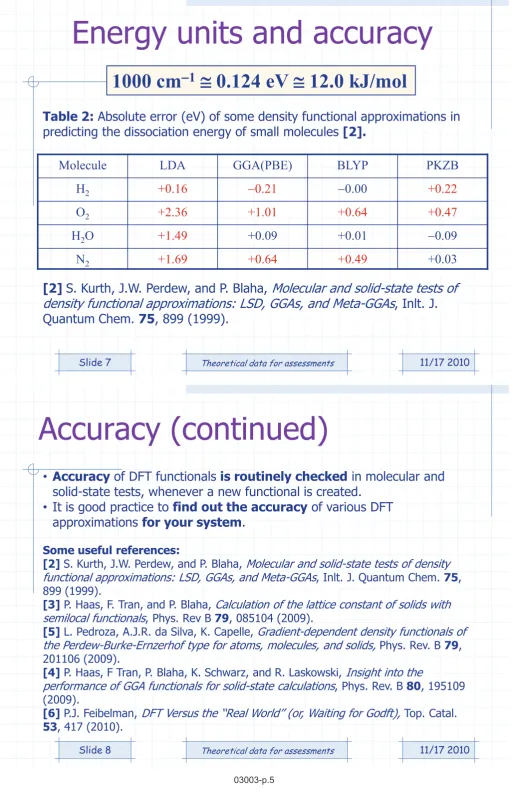
Energy units and accuracy
1000 cm
10.124 eV
12.0 kJ/mol
Molecule LDA GGA(PBE) BLYP PKZB
H2 +0.16 0.21 0.00 +0.22
O2 +2.36 +1.01 +0.64 +0.47
H2O +1.49 +0.09 +0.01 0.09
N2 +1.69 +0.64 +0.49 +0.03
Table 2: Absolute error (eV) of some density functional approximations in
predicting the dissociation energy of small molecules [2].
[2] S. Kurth, J.W. Perdew, and P. Blaha, Molecular and solid-state tests of density functional approximations: LSD, GGAs, and Meta-GGAs, Inlt. J. Quantum Chem. 75, 899 (1999).
Accuracy (continued)
• Accuracy of DFT functionals is routinely checked in molecular and
solid-state tests, whenever a new functional is created.
• It is good practice to find out the accuracy of various DFT approximations for your system.
Some useful references:
[2] S. Kurth, J.W. Perdew, and P. Blaha,Molecular and solid-state tests of density functional approximations: LSD, GGAs, and Meta-GGAs, Inlt. J. Quantum Chem. 75, 899 (1999).
[3] P. Haas, F. Tran, and P. Blaha, Calculation of the lattice constant of solids with semilocal functionals, Phys. Rev B 79, 085104 (2009).
[5] L. Pedroza, A.J.R. da Silva, K. Capelle,Gradient-dependent density functionals of the Perdew-Burke-Ernzerhof type for atoms, molecules, and solids,Phys. Rev. B 79, 201106 (2009).
[4] P. Haas, F Tran, P. Blaha, K. Schwarz, and R. Laskowski,Insight into the
performance of GGA functionals for solid-state calculations, Phys. Rev. B 80, 195109 (2009).
[6] P.J. Feibelman, DFT Versus the ‘‘Real World’’ (or, Waiting for Godft), Top. Catal.
Slide 9 Theoretical data for assessments 11/17 2010
Phonon spectrum of Cu
2
O
P.A. Korzhavyi and B. Johansson, Technical Report TR-10-30, (SKB, Stockholm, 2010).
Slide 11 Theoretical data for assessments 11/17 2010
Thermodynamic properties of Cu
2
O
+0.5 eV
Slide 13
Degrees of freedom to be
taken into account in solids
•
Atomic defects
(non-stoichiometry, high
temperature)
•
Vibrational (harmonic and
anharmonic)
•
Magnetic excitations
•
Electronic excitations
11/17 2010
Theoretical data for assessments
> 10
-6
s
~ 10
-13
s
~ 10
-14
s
~ 10
-15
s
Time scale
Compound energy formalism (CEF)
2-sublattice (Bragg-Williams) model
A B Subl. 1 Subl. 2 AA BA AB BB
(A,B)
1(A,B)
1BA BA BA BA BA BA BA BA BA BA BA BA
G
SRF ) 2 ( B ) 1 ( B 0 BB ) 2 ( A ) 1 ( B 0 BA ) 2 ( B ) 1 ( A 0 AB ) 2 ( A ) 1 ( A 0 AA 0 SRFy
y
G
y
y
G
y
y
G
y
y
G
G
Energy surface of reference
Ideal mixing entropy
) 2 ( B ) 2 ( B ) 2 ( A ) 2 ( A ) 1 ( B ) 1 ( B ) 1 ( A ) 1 ( A conf
ln
ln
ln
ln
y
y
y
y
y
y
y
y
S
M. Hillert, The compound energy formalism, J. Alloys and Compounds 320, 161 (2001).
Slide 15
4-sublattice model, bcc Fe-Ti:
2
4
=16 end members
11/17 2010
Theoretical data for assessments
A2 A2
B2 B32
D03 D03
F F F F (1) F F T T (4) T T T T (1)
F F F T (4) FT FT (2) T T T F (4)
Slide 17 Theoretical data for assessments 11/17 2010
A combined
ab initio
- CALPHAD study
Fe Cr
P.A. Korzhavyi, B. Sundman, M. Selleby, and B. Johansson, Atomic, electronic, and magnetic structure of iron-based sigma-phases, in Integrative and Interdisciplinary Aspects of Intermetallics, MRS Proc., 842, edited by M.J. Mills et al., (Warrendale, 2005), pp. S4.10.1-6.
Icosahedrally coordinated sites
High coordination number (high-CN) sites
M1 (CN=12) M4 (CN=12)
M2 (CN=15) M3 (CN=14) M5 (CN=14)
Slide 19 Theoretical data for assessments 11/17 2010
(Fe,Cr)
2(Fe,Cr)
4(Fe,Cr)
8(Fe,Cr)
8(Fe,Cr)
8“end member compound”: FCCFC=Fe
2Cr
4Cr
8Fe
8Cr
82
5= 32 end member compound energies.
These energies have been calculated from first
principles
-phase model
Energies of the end-member compounds
H at 0 K
H
H – TSconf
Slide 21 Theoretical data for assessments 11/17 2010
Magnetic moments and entropy contribution
• Magnetic moments are
vanishing on Fe atoms occupying icosahedral sites (1,4).
• B, on Fe atoms occupying high-CN sites (2,3,5).
• Disorder of Fe magnetic moments gives an important contribution to the entropy:
Smagn=kBsa(s)cFe(s) MFe(s)+1)
3d
4d
5d
N
d= 1 2 3 4 5 6 7 8
Slide 23 Theoretical data for assessments 11/17 2010
C.-S. Oh, H. Murakami, and H. Harada, J. Alloys Compounds 313, 115 (2000).
O. Grånäs, P.A. Korzhavyi, A.E. Kissavos, and I.A. Abrikosov, CALPHAD 32, 171 (2008).
Mo-Ru sigma phase
• TiCx and TiNx crystallize in the B1 (NaCl) structure.
• Vacancies only on the non-metal sublattice, (Ti)(X,Va).
Non-stoichiometry in titanium
carbides and nitrides
Ti-C
+ +
L+
graphite+
K. Frisk et al., Calphad (2004)
Ti-N
L
GAS
L
: hcp
: bcc
: fcc
: anti-rutile
Slide 25 Theoretical data for assessments 11/17 2010
Vacancy-vacancy interactions
Experiment: T. Priem et al. (1989). Cluster expansion:
Vacancies prefer 3rd nearest
neighbor distance, <1,½,½>.
Theoretical methods:
Connolly-Williams method (CWM) Generalized perturbation method (SGPM)
Short-range order (SRO)
Monte Carlo modeling of vacancy ordering
Calculated phase diagram
Monte Carlo
•
Simulation box: 32x32x32 (32768 carbon sites)•
5000 time steps per siteOrder of vacancies in the (111) layers of Ti3C2and Ti6C5:
Ti3C2 Ti6C5
(111)
Ordering pattern
Stacking between layers
Slide 27 Theoretical data for assessments 11/17 2010
MC simulation of the ground
state structures in TiN
x
• Ground state ordering is slightly different from TiCx.
• Stacking of (011)B1
planes instead of (111)B1.
• All structures can be described within a 24 site unit cell (5
sublattices).
• Calculate the total energy of the structures and compare with the previous model. GUS L. W. HART, VOLKER BLUM, MICHAEL J. WALORSKI
AND ALEX ZUNGER (Nature Materials, 2005)
CEF models for Ti-TiC-TiN
Slide 29 Theoretical data for assessments 11/17 2010
Ti-C phase diagram Calculated and experimental
TiCxstability plot at ~298 K
500 1000 1500 2000 2500 3000 3500 4000 T (K )
0 0.1 0.2 0.3 0.4 0.5 0.6 0.7 0.8 0.9 1.0
x(C) L +graphite + + L+ 1 2 3 4
/+, Wagner
/+, Wagner Isothermally molten, Rudy DTA, Rudy
Incipient melting, Rudy +, Cadoff and Nielsen +, Cadoff and Nielsen , Cadoff and Nielsen , van Loo and Bastin /+, Cadoff and Nielsen Liquidus, Bickerdike and Hughes L
L+
+
+
+graphite
Prediction of phase diagrams
Ti-C phase diagram
Ti-C phase diagram
Calculated and experimental TiCxstability plot at ~298 K
Slide 31 Theoretical data for assessments 11/17 2010