International Journal of Scientific Research in Computer Science, Engineering and Information Technology © 2018 IJSRCSEIT | Volume 3 | Issue 1 | ISSN : 2456-3307
Mgephi : Modified Gephi for Effective Social Network Analysis
Dr. M.Thangaraj
*1, S.Amutha
2*1Department of Computer Science/Madurai Kamaraj University/Madurai, Tamil Nadu, India
2Department of Computer Science/Manonmanian Sundaranar University/Tirunelveli, Tamil Nadu, India
ABSTRACT
One of the most visible trends on the web is the emergence of social web sites, which is help people create and gather knowledge by simplifying user contribution via blogs, tagging and folksonomies, wikis, podcasts and online Social Networks. Social Network Analysis network can be very large containing from thousands to even millions of nodes. The sheer number of nodes and links makes drawing the entire network computationally infeasible. SNA tools are used find the Ranking, Partitions, and Layouts with various algorithms, visualization, Statistics and Filters the nodes and edges in the large type of datasets and done Network Analysis module, Permutation hierarchy and fisheye transformation etc. The feature performed in Modified Gephi framework. In this paper, a new framework is proposed for an effective Social Network Analysis. The framework is implementing for measuring the performance. The performance measures show remarkable improvement over their existing methods.
Keywords: Social Network Analysis, Gephi, Pajek, NodeXL, Partition, Visualization, FishEye Transformation.
I.
INTRODUCTION
Social Network (SN) is entities of any type linked collectively in some way. SNs are people or groups of people linked together through Social interaction. SN is frequently discussed at present in connection with Facebook, MySpace, Whatsapp, twitter and other phenomena recently associated with the Internet. SN like Facebook is connecting the people in the virtual society. Human social relationships were bounded according to time and space, but the evolution of information and communication technologies tools allowed people to inexpensively and reliably share information anytime and anywhere through Social media [3].The basic features of a Social Networking sites are profiling friend’s listings and commenting, often along with other features such as private messaging, discussion forums, blogging and media uploading and sharing. SNA studies individuals and the relations between those individuals. SNA is most effective uses in ego-centered approach, which begins with a single key individual and the connections that has to the people with who has direct relations. Studying and measuring these social media have attracted considerable interest of many researchers in various domains and led them to create a new field is called SNA [4].
SNA methods have been applied to a wide range of areas like trade in business, medicine in healthcare, online education in academia, news update in politics and crime finding in terrorism. In this work, a new framework is proposed to make effective analysis of social network data. The paper is organized like section 2 deals with survey of literatures; section 3 shows the proposed architecture and their features, section 4 explains he implementation issues of the proposed
architecture and section 5 concludes the work.
II.
RELATED WORK
SNA tools is software which
facilitates quantitative or qualitative analysis of social networks, by using network and graph theory to investigate social structures, by describing features of a
network both through numerical or visual
representation. SNA tool produces many features from
Netwatch is used in statistics for entire network adapters; improve in graphing with max-out utilization, auto scaling map views, SNMP and PING. It offers accurate and low-overhead measurement service for more than one user simultaneously and effectively.Net Miner tool is a network firewall to control Internet and network activity. It used in NASA, nursing hospitals and joint task force settings. It is utilized in the conferences is used to measure the distance between two conferences. The tool is having keywords to find the rank and similarity of the conferences [7].
JUNG is a Java Universal Network/Graph Framework tool records that provides a general and extendible language for the representing, analysis, and visualization of data that can be represented as a graph or network. It has directed and undirected graphs, multi-modal graphs with parallel edges and hypergraphs. It provides a mechanism for annotating
graphs, entities and relations with metadata. In
simulation, the ALERT protocol has been carried out with JAVA using JUNG tools and shown that proposed solution is able to avoid the attacks on the network. It is also in energy consumption and packet delivery part as compared to existing ALERT protocol [12].
Relevant SNA tool R is an integrated suite for data manipulation, calculation and graphical display. It provides a wide variety of statistical and graphical techniques, and is highly extensible, data handling and storage facility[31]. There is diversity of tools available in R, socio-metric data, RBGL (Relevant Boost Graph Library), Binding to BGL (Boost Graph Library), and
SocNetV tool is Social Networks Visualizer is a cross- platform, user-friendly, handy and easy to use SNA application it also calculates prestige indices, triad census, cliques, clustering coefficient, etc. It enables to modify the social networks analyze their social and mathematical properties and apply visualization layouts [13]. Inflow tool is a set of proprietary network tools for visualizing and analyzing networks based on user-generated data to determine where gaps and effective network connections exist. It is used for measure that is mapped from one window to other window. GraphML
is a tool is designed with simplicity generality, extensibility, and robustness. It can be used in combination with other XML based formats [8].
III.
PROPOSED SYSTEM
A. MGephi Framework
Modified - Graph Exploration and Manipulation Software framework. It is designed for interactive visualization and exploration platform for all kinds social of networks on complex systems, dynamic and hierarchical graphs. In this framework visualization module user can use in 3D render engine, real time analysis and vary visualization. It uses the computer’s graphic card while leaving CPU free for computing. It is a powerful framework for network analysis, but it can be intimidating. It has many tools for statistical analysis of network data most of which be using at this stage of work. It is highly scalable it can handle 20,000 nodes. It was built on multi-task model to take advantages of multi- core processors. It offers an extensive plug-in library for extending the functionality of the tool [9].
It is a framework for people that have to explore and understand graphs, the user interacts with the representation, manipulate the structures, shapes and colours to reveal hidden properties. It uses a 3D render engine to display large networks in real time and to speed up the exploration. The framework has flexible and multitask architecture brings new possibilities to work with complex data sets and produce valuable visual results [14].
analysis will follows the well-established mantra of visual information seeking, overview first, zoom, filter, and details-on-demand. MGephi framework is written in JAVA with API, PC and Linux. It has an ecosystem of plug-ins and related tools.
MGephi framework is particularly suited for networks with node attributes. Attributes are key value pair associated to each node or each edge. In MGephi any kind of users can interact with the visualization in real-time to position nodes in a two or three dimensional space using layout algorithms or by manually moving nodes [32]. They use node properties to change their colours and sizes, in order to find groups and detect significant nodes. The goal is to study the correlation of node properties and network structure by using visual patterns. The strengths of MGephi are its real-time visual feedback performance code modularity and community of developers and users.
The MGephi user interface is focused on the creation of network visuals in real time. It is suitable for the analysis of all kind of complete networks although it is mostly used for social network analysis [34].
Figure 1. Architecture of MGephi framework
In MGephi framework, any kind of network can be analyzed, like the internet topology, peer-to-peer file sharing networks, biological networks on-line social networks communication and financial networks and also semantic networks, organizational networks etc. It aims at covering the entire process from data importing to aesthetics refinement and interaction. Data can be imported and exported in various file formats and can
be retrieved from databases [35]. There are two types of formats input/output operations. The following file input formats are supports to Gephi CSV (Common Separated Values), GDF, GEXF(Graph Exchange XML Format), GML (Generalized Markup Language), GraphML (Graph Markup Language), Graphviz (Graph Visualization), DOT(Document Template), Pajek, NET, Tulip, TLP,UCINET, XGNNL Older Version of Gephi), and PDF. The spreadsheet importer helps users to model tabular data as a network.
Data can be saved in MGephi framework sessions, but also in other formats like node and edge lists GDF, GEXF, GraphML, Pajek Net, the graphical output of network visuals can be exported in PDF or SVG for printing. Designers can edit it and using as third party tools. Raster graphics such as PNG is also available, as long as the Tikz format for embedding figures in LATex documents. Interactive graphics exporters are available as plug-ins such as Microsoft seadragon graphics. There is a Gexf file developed by Gephi consortium to create the graph exchange XML format (GEXF) which is the standard used in tool to encode network data. This format is an XML language for designing and describing network node and edges attributes hierarchies and their temporal evolution [36].
There are various databases in MGephi framework, it can retrieve data from relational databases such as MYSQL, SQL server, PostgreSQL, SQLite and Teredata. The community creates plug-ins to support graph databases such as Neo4J, orientDB (Orient Database) and infinite graph [21].
NODE+EDGE=GRAPH=MGEPHI framework.
B. Major Features of MGephi
The major features in MGephi framework are Ranking, Partition, Layouts, Visualization, Statistics and Filters.
Ranking
Ranking is a relationship between the node and edge. Its role is to provide numerical value from objects. The values are changed into visual sign. It can be the degree of the node or a numerical value. A degree of node is the number of edges that are adjacent to the node. Degree power law measures how closely the degree distribution of a network follows a power law scale. There is in-degree; degree and out-degree are calculated in ranking [38].
Major Features
Ranking Partition Layout
s
Visualization Statistics Filters
Dynamic Features
Spatializing Filtering Navigating
Manipulating Clustering
Network Analysis Model
Permutation
Hierarchy
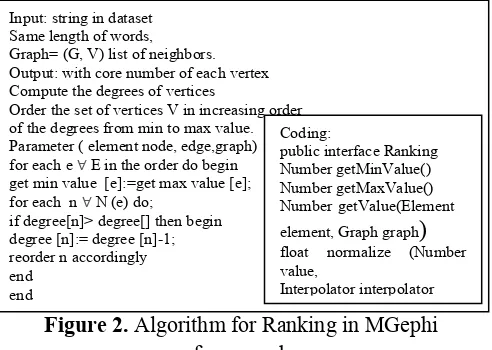
Ranking algorithm is used to find the minimum and maximum number of nodes and edges are connected through the graph. The neighbour of node, distance of node and group of node are accurately calculated through the ranking algorithm [11]. It is popular in efficiency, feasibility, less susceptibility, less query time cost to connect the links etc. The degree distribution of taken nodes in dataset generates the graph in-degree, degree, and out-degree distribution. The value in vertical axis and count of nodes in horizontal axis is shown in experimental graph in section 8.4
Figure 2. Algorithm for Ranking in MGephi framework
Partitions
The processing of network based on modularity class and assigned the colors to the nodes of each of the partition. It is selecting different levels of categorical attributes. In the process run modularity to detect communities [22].
Figure 3. Algorithm for partition in MGephi framework
Layouts
It is applied on the node to repositioning in graph to improve its readability and aesthetics. There are various algorithms to frequently use in ensure the graph with
nodes and edges. Layouts are used to help navigate in the network. Layouts may consider edge weight in calculating forces. They may prevent node to overlap, thus increasing the readability.
First algorithm is Force Atlas, it is a home-blew layout of MGephi. In this algorithm, steel rings represent the nodes and the edges are springs between them. The attractive force is analogous to the spring force and the repulsive force is analogues to the electrical force. The basic idea is to minimize the energy of the system by moving the nodes and changing the forces between. This layout simulates the graph as a system of mass particles. The nodes are the mass particles and the edges are springs between the particles. The algorithms try to minimize the energy of this physical system. It
Figure5. Algorithm for Fruchterman-Reingold Layout
Fruchterman Reingold algorithm the force between two nodes and its represented by steel connection and the edges are springs between them. There is spring force Input: string in dataset
Same length of words, Graph= (G, V) list of neighbors. Output: with core number of each vertex Compute the degrees of vertices
Order the set of vertices V in increasing order of the degrees from min to max value. Parameter ( element node, edge,graph) for each e∀E in the order do begin get min value [e]:=get max value [e]; for each n∀N (e) do;
if degree[n]> degree[] then begin degree [n]:= degree [n]-1;
Input: list of string in dataset S Same length of words, Graph= (G, V) list of neighbors.
Output: S can be partition into more sub groups that have equal elements Compute the degrees of vertices, sorted values,
find percentage in color and size of column
Order the set of vertices V in order of the degrees from value, color, percentage and size
Parameter (element node, edge, column, color, percentage, size graph) Function find_partition(S):
If node setColor= 1 Visible color; Else node Color =0 Invisible color; object getvalue between 0 and 100 percentage valuecount v++;
if partition =column Column =1; else partition ≠ column column = 0;
Input : string in dataset Same length of words, Graph= (G, V) list of neighbors Output: produce kind of layout
Parameter: maximum displacement, gravity
If maximum displacement =10 then gravity=30
graph – directed graph
Graph=G:=(V,E)
Parameters: u,v- edge and vertice, δ K:= √area/v;
Function fa(x):= begin return x2/k end;
Function fr(x):= begin return k2/x end;
and repulsive force is analogous to the complete network. It consumes the energy and fast moving of nodes and edges changing the direction of the network.
Visualization
It is a powerful way to find patterns, which cannot be seen from a table. User can use different layouts to reveal spatial patterns or user can use style mappings to map data to different visual properties like colour, size or shape of nodes and relationships. In MGephi framework visual imagery has been an effective node and edges are connected and calculate the shortest path of circumstances of graph. It integrates different techniques such as the Barnes hut simulation, degree dependent repulsive power and limited and worldwide adaptive temperatures [15].
In this part, the path is finds whether directed or undirected. It provides a powerful workflow for exploring and visualizing graphs. First select graph and parameters for visualization, the graph is converted into .gexf format or .csv format which is sent to layout core for layout, getting the proper layout, some better network algorithm is applied based on selection to determine the colour of node or size of node or size of edges. At end, the visualization is stored in the server and rendered on the web browser.
Statistics
MGephi framework provides a range of metrics for calculating statistics that characterize a graph and its nodes. First run a metric from statistics tab, run average degree produces distribution plot of node in degrees, run average path length produces a report of centrality scores for all nodes.
Figure 6. Algorithm for Statistics
Filters
The filters tab supports complex methods to temporarily highlight or hide the subnets of nodes and edges in the graph. Nodes can be filtered by attribute
value or based on node statistics. Its pruning the graph by keeping only nodes and edges that satisfies filters conditions. They are either predicates or functions that reduce the graph, predicates are easy and return only true or false, whereas functions input a graph and output graph [6].
C. Dynamic Features of MGephi Framework
There are five features in MGephi framework. First Spatialzing is easy to focus on graph very accurately. In visualization portion the using label adjust algorithm the graph is getting a clear text letter in the graph. Second, filtering is done in the graph for finding ego network, k-core and finding the neighbour network.
Third, Navigating is used to view the generated interactive web visualization, navigate to that folder and open the particular supporting file like ex: a.html. Fourth manipulating, it is used to Data Laboratory also provides a variety of ways to manipulate data columns [2]. For instance, can duplicate columns or copy values between them, as well as create new columns by combining existing ones based on certain rules. Fifth Clustering is mingling with various layouts like Frutcherman-Reingold algorithm to find distance between the nodes and calculate the percentage. It can contract and expand the clusters. When running the
Force Atlas 2 algorithm linear attraction and
logarithmic repulsion makes the cluster very tighter.
IV.
NETWORK ANALYSIS MODEL
NodeXL is a tool that makes it easy to explore network
graphs. User can enter a network edge list in a worksheet, click a button easily generate the graph, all in the familiar environment of the Excel window. It is very flexible Import and Export Import and export graphs in GraphML, Pajek, UCINet, and matrix formats. There is better way to Direct Connections to Social Networks and Import social networks directly from Twitter, YouTube, Flickr and email, or use one of several available plug-ins to get networks from Facebook, Exchange, Wikis and WWW hyperlinks. In the NodeXL workflow follows as first import the dataset in text or numeric with the extension file .csv, or stored in database or spreadsheet onset of nodes with relationships [17].
Datasets are containing duplicates, it should be eliminated, and releases noisy data get the original
Input : total number of nodes in count Same length of words,
Graph= (G, V) list of neighbors Output: produce graph density, diameter Parameter: node, edge, diameter, component
If select run node ≠0 Then Node visible
If select graph density ≠ 1
Then generate visible in % If select maximum connected components ≠ 0
edges. A range of measurement in and out degree, betweeness, closeness, centrality are calculated the graph metrics, with number of nodes create a group and map nodes to display distinctive shape or graph [1]. Due to the original graph, individual nodes or clusters generate sub-graph for each node and prepare edge list laid out in the whole graph visualization. There is adjust layout include Fruchterman- Reingold used to find the close relationships of the nodes, Harel-koren Fast Multiscale layout is made for to find closeness centrality, betweeness centrality and similar group called clusters in node, circle, spiral, Horizontal sine wave, vertical sine wave, grid, polar, sugiyama and random [30]. In Network Analysis model calculate the graph metrics, generating the sub graph of nodes and find the clusters or groups [18].
Figure 7. Algorithm for Network Analysis
V.
PERMUTATION
Pajek is non-commercial free software. Its functionality has been improved to make sure it is state-of-the art and aesthetically pleasing. It generates 2D and pseudo 3D graph for viewing. This is a powerful software tool since it allows the input of large datasets. Besides, it provides a variety of layout algorithm patterns such as circular, Fruchterman- reingold, Lanczos, kamada-kawai and so on [19].
Pajek processes network interactions based on six data types namely Network, partition, cluster, vector, Permutation, and Hierarchy. Apart from its own flat file format it also supports UCINET, DL and GED format, Those graphic formats include Encapsulated Postscript VRML, MDJMOL,chime and Kinemages. As for the tool itself, the fruchterman Reingold layout algorithm provides 3D view for the graph and enables users to zoom around the network [29].
Pajek does not integrate with any database and it only supports a flat file format, which is not compatible to most of the XML formats nowadays. The data need to be converted into pajek file format to visualize. These limitations have restricted the usage of Pajek by end users [28]. The strength of the pajek tool is a common, public data format, free software, designed for medium to large networks and it has good graphic options. It has obscure interface, poor documentation, limited options exporting graphics and limited support for statistics and modelling.
The main motivation for development of pajek is used in several forms that represent large networks. Pajek should provide tools for analysis and visualization of such networks, collaboration networks, and organic molecules like proteins in receptor interaction networks genealogies, internet networks the spread (AIDS) network etc [27]. The design of pajek is based on knowledge made in the growth graph data structures and algorithms libraries graph graphics and X-graph and visualization program such as Stran, Recalc, draw, energy and sgml based NetML. It support in abstraction by decomposition of a huge network into numerous smaller networks that can be treated further using more complicated methods. The powerful visualization tools are used to implement the efficient graph for analysis of huge networks [26].
Figure 8. Algorithm for Permutation
Permutation is identify the dimension of network and create a random permutation whether it’s in random 2-mode select the size of the network and number of vertices, make into inverse or opposite direction to create the mirror image. In Transpose of nodes (56) using layout circular algorithm the permutation is generate a graph with node relationship and calculate the distance between nodes [25].
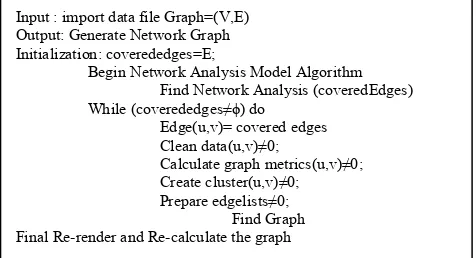
Input : import data file Graph=(V,E) Output: Generate Network Graph Initialization: coverededges=E;
Begin Network Analysis Model Algorithm Find Network Analysis (coveredEdges) Final Re-render and Re-calculate the graph
Figure 8. Algorithm for Permutation
VI.
HIERARCHY
In Pajek, nodes are arranged in a particular way to generate the accurate graph to find the cluster and extract cluster. There are different type of networks allows to perform in system by using the set of rules to find the structure of graph to make partition and make permutation. Moreover, find the dissimilarities in the graph must be stored in name of nodes. By the hierarchy processing the importance of the nodes and closeness, betweeness, centrality are calculated and it taken to the account of Network [24].
Ease of Us
Figure.8. Algorithm for Hierarchy
VII.
FISHEYE TRANSFORMATION
It is one of the transformations done in the pajek network. The arcs and nodes connected in the graph to generate the enormous network through the particular angle, shape and size are varying translate and rotate x-axis or y-x-axis, rotate 2D in xy plane. If the node is selected easily to draw the picture, otherwise select the middle of the picture point is used to focus and rotate the picture in x-axis or y-axis.
Figure 9. Algorithm for FishEye transformation
The different programs allows the performance of several bibliometric analyses, co-word, co-author, author bibliographic coupling and author co-citation.the results can be visualized using external software Pajek. Science mapping analysis can be performed using generic SNA tool Pajek.
VIII.
IMPLEMENTATION
Hero-social-network.gephi graph file with nodes-10469, edges-178115 and the size of the file is 2304
Kilo bytes, webatlas_Eurosis.gexf graph file with
nodes- 1285, edges-7524 and the size of the file is
2199Kilo Bytes, WRITE.NET file with 56 nodes and
size of the file is 2KB. weight=nodes-80- 100% visible, edges 246-24.65% visible edge weight setting is 474303.105 to 3059235.0. In Layout various algorithm like force atlas have stronger gravity law and scaling 2.0.In Statistics the specific node u and neighborhood v is used to find Input : import data file Graph=(V,E)
Output: Generate Network Graph
Hierarchical clustering according to dissimilarity matrix Create cluster
Complete cluster operations, Dissimilarity parameter p Count diagonal
Input : Graph G=(V,E), where pixel p shift using the xscale, yscale Output : Fisheye view graph
Initialization: x =0, y=0, xscale, yscale,xshift,yshift, Begin Fisheye transformation algorithm
Find Cartesian coordinate (covered edges) { While (coveredEdges ≠ ϕ) do
float getRadialX(float x,float y,float cx,float cy,float k){ x = (x*xscale+xshift); y = (y*yscale+yshift); float res = x+((x-cx)*k*((x-cx)*(x-cx)+(y-cy)*(y-cy))); return res; }
Fisheye
cluster coefficient, average degree, average path length, shortest path, and network diameter.
C. Performance metrics
The performance, real-time visualization, code modularity and community development also better than other tool. Node and edge ranking is accurate than other tools. It is easy to find diameter and density, creating the cohesive subgroups and analyzing comparisons in good and bad communities. It is easy to generate powerful visualization graphs. In networks partially doing the variations of different networks like two mode, temporal, signed, multi-relational and acyclic networks.
D. Experiments
Ranking
Figure 10. shows a. Degree distribution b. In-Degree distribution c. Out –degree distribution
The dataset holds 80 nodes and 998 edges. In Ranking, average degree distribution is 24.95 and average weighted degree is 822019.925. Page rank is an interactive algorithm that measures the importance of each node within the network. The metric assigns each node a probability that is the probability of being at that page after many clicks. The page rank values are the values in the eigenvector that has the highest corresponding Eigen value of a normalized adjacency matrix A, the standard adjacency matrix is normalize so that the columns of the matrix sum to 1.The page rank report is Epsilon = 0.001and Probability = 0.85
Partition
In the partition cluster, coefficient distribution is calculated the average clustering coefficient is 0.540, average Clustering Coefficient is the mean value of individual coefficients. Randomize: On, Use edge weights: On, Resolution: 1.0, Modularity: 0.360, Modularity with resolution: 0.360 and Number of Communities: 3, the Connected Components Report is shows number of Weakly Connected Components is 1
and the number of Strongly Connected Components are 31.
Figure 11. Partition in nodes and edges in different color to find clustering coefficient
Layouts
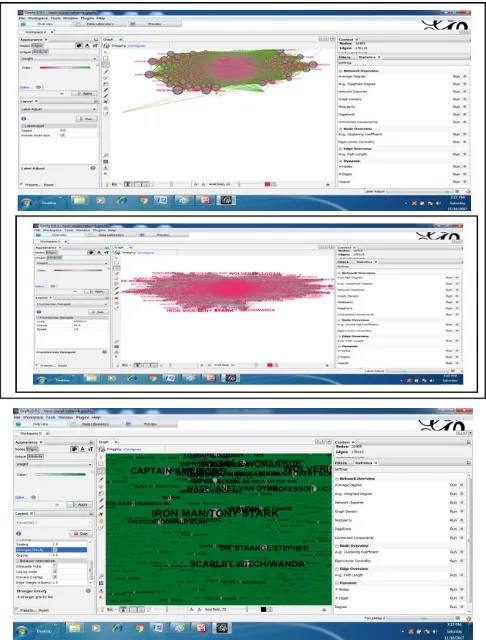
It has stronger gravity law and the scaling value is 2.0. Fruchterman Reingold algorithm is used to find the weight of graph nearest node and edge. The area is 1000.0, gravity is 10.0 speeds is 1.0 and attribute is weight. Label adjust algorithm speed is 4.0 and it includes node size.
Figure 12. Layout of Force Atlas, Fruchterman Reingold and Label Adjust Algorithm
the Screenshot of the graph easily done in the visualization [23].
Statistics
The average degree of the graph is 24.95. average of weighted degree is 822019.925. network diameter is 12, graph density is 0.158, modularity is 0.36, Network Interpretation is directed graph, Number of iterations is 100, Sum change is 0.00321 page rank parameters epsilon is 0.001 and probability is 0.85, Connected components is 1, average clustering coefficient is 0.54, average path length is 2.938. This is the complete statistics of the graph, which had 80 nodes and 998 edges.
Figure 13. Shows various graph of Statistics in MGephi Framework
Filters
The edges weight nodes 80(100%) visible, edges 246(24.65%) visible, edge weight setting range is 474303.105 to 3059235.0.there are lot of attributes in filters equal, partition, Range, dynamic, edges, topology, degree range, k-core and neighbour network.
Figure 14. Filtering in ego-network
Figure 15. Complete Data Table for Graph
Figure 16. Network Analysis Model by using different algorithms
Figure 17. Permutation, Hierarchy
Main window of Pajek Transpose-Cluster-using permutation
Hierarchy – transform –make cluster Transpose-Circular-using permutation
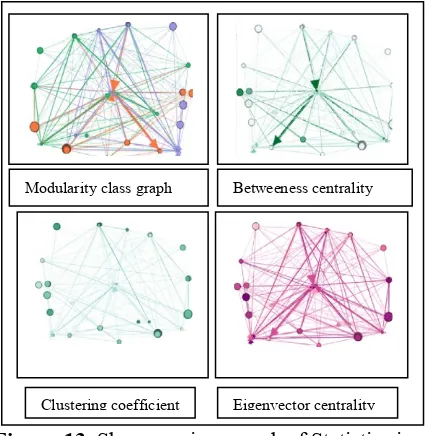
Modularity class graph Betweeness centrality
Clustering coefficient Eigenvector centrality
Fruchterman- Reingold Harel-koren Fast Multiscale
Betweeness centrality
Betweeness
centrality
Clusters- Harel-koren Fast multiscale
Random inClusters
Figure 18. shows Cartesian and polar graph in FishEye transformation
IX.
CONCLUSION
MGephi framework is used to integrate as a part of workflow visualizing the output providing more information, showing the node label, id, edge, weight, etc. In Filtering, small part of graph visualized very clearly. Totally graph organization by applying
multiple algorithms, ForceAtlas, Fruchterman-
Reingold, Harel-koren Fast Multiscale, Kamada-kawai algorithms are used to find the clusters and nearest node, distance node, measure the centerality, betweeness, etc. In permutation, read the network purely make the partition and Vector to the graph. In fisheye transformation rotate the graph in Cartesian or in polar coordinates with the amount of movement.
X.
REFERENCES
[1]. Amina Amara; Rihem Ben Romdhane; Mohamed
Ali Hadj Taieb; Mohamed Ben Aouicha, Simulating the merger between user-centered graphs of social networks, 2016 IEEE/ACS 13th International Conference of Computer Systems and Applications (AICCSA) Pages: 1-6
[2]. Anne Solli, Thomas Hillman, Åsa Mäkitalo,
Navigating the Complexity of Socio-scientific Controversies How Students Make Multiple Voices Present in Discourse, International journal of Research in Science Education 19 October 2017
[3]. Anuradha Goswami, Ajey Kumar-A survey of
event detection techniques in online social networks-Social Network Analysis and Mining-December 2016, 6:107
[4]. Cherry Ahmed, Abeer ElKorany, Reem Bahgat-
A supervised learning approach to link prediction in Twitter- Social Network Analysis and Mining. (2016) 6:24
[5]. David Hrabˇcak, Martin Matis, L’ubomír Doboš,
Jan Papaj, Tools for evaluation of social relations
in mobility models, Journal of Tele
communication,31 october 2017
[6]. Deepa Balagopal; X. Agnise Kala Rani,
NetWatch: Empowering software-defined
network switches for packet filtering, IEEE computer society 21 April 2016
[7]. Ekta, Reputation based technique to distinguish
posts in Facebook social network, 5th International Conference on Reliability, Infocom
Technologies and Optimization
(ICRITO),2016,Pages: 307-311
[8]. Heymann, S. Le Grand, B. Visual Analysis of
Complex Networks for Business Intelligence with Gephi, Information Visualisation (IV), 17th International Conference on IEEE, 2013 , Page(s): 307-312
[9]. Jae Hwa Park, Young Bin Kwon, Extract
Research Trend of Computer Networks via Analysis of the Keywords Contained in Related Conference Proceedings, IEEE Computer society : 16 August 2013
[10]. Jianxin Wang, Jiancheng Zhong, Gang Chen,
Min Li, Fang-xiang Wu, Yi Pan, ClusterViz: A Cytoscape APP for Cluster Analysis of Biological Network, IEEE/ACM Transactions on Computational Biology and Bioinformatics ( Volume:12, Issue:4,July-Aug 1 2015 ), Pages: 815-822
[11]. Jiaqiang Liu; Yong Li; Haoyu Song ; Depeng
Jin, NetWatch: End-to-end Network
Performance Measurement as a Service for Cloud, 14 November 2016 ,IEEE Computer Society
[12]. Joshua O’Madadhain,Danyel Fisher, Padhraic
Smyth, Scott White, an-Biao Boey, Analysis and Visualization of Network Data using JUNG, Journal of Statistical Software, Volume VV, Issue II 2011
[13]. Junling Deng1, Kaweng Sitou1, Yongping Zhang
, Ru Yan and Yuanjia Hu, Analyzing the Chinese landscape in anti-diabetic drug research: leading knowledge production institutions and thematic communities, Journal of Chinese medicine 16 march 2016
[14]. Jyoti Sunil More; Chelpa Lingam, Reality mining
based on Social Network Analysis, 2015 International Conference on Communication,
Information & Computing Technology 2015,Pages: 1-6
[15]. Kambale Vanty Muhongya; Manoj Sewak
Maharaj, Visualising and analysing online social networks, 2015 International Conference on Computing, Communication and Security, Pages: 1-6
[16]. Mamta Madan; Meenu Chopra; Meenu Dave,
Predictions and recommendations for the higher education institutions from Facebook social networks, 2016 3rd International Conference on Computing for Sustainable Global Development (INDIACom),Year: 2016,Pages: 3882-3891
[17]. Marc A. Smith, Identifying and shifting social
media network patterns with NodeXL, 2014 International Conference on Collaboration
Technologies and Systems (CTS),Year:
2014,Pages: 3-8
[18]. Marc A. Smith, NodeXL: Simple network
analysis for social media, 2013 International Conference on Collaboration Technologies and Systems (CTS),Year: 2013,Pages: 89-93
[19]. Meriem Adraoui, Asmaâ Retbi, Mohammed
Khalidi Idrissi, Samir Bennani, Social learning analytics to describe the learners' interaction in online discussion forum in Moodle, 16th
International Conference Information
Technology Based Higher Education and Training, July 2017
[20]. Nadeem Akhtar, Social Network Analysis Tools,
2014 Fourth International Conference on
Communication Systems and Network
Technologies, Year: 2014,Pages: 388-392
[21]. Natarajan Meghanathan, Maximal assortative
matching for real-world network graphs, random network graphs and scale-free network graphs, Journal of Computer science, 30 march 2016
[22]. Na Zhang, Yu Yang, Yujie Zheng, A module
partition method base on complex network theory, International Conference on Industrial Engineering and Engineering Management (IEEM), Dec 2016
[23]. Niyati Aggrawal; Anuja Arora, Visualization,
analysis and structural pattern infusion of DBLP co-authorship network using Gephi, 2016 2nd International Conference on Next Generation Computing Technologies (NGCT), Pages: 494 - 500
[24]. Priyanka Patil; Nilesh Marathe; Vimla Jethani,
Improved ALERT protocol in MANET with
strategies to prevent DOS & MITM attacks Automatic Control and Dynamic Optimization
Techniques (ICACDOT), International
Conference on 9-10 Sept. 2016
[25]. Puja Munjal; Nidhi Arora; Hema Banati,
Dynamics of online social network based on parametric variation of relationship,, 2016 Second International Conference on Research in Computational Intelligence and Communication Networks (ICRCICN)Year: 2016, Pages: 241 - 246
[26]. Ran Li; Han Li; Bo-Wen Liu, Decipher the
Hidden Secrets Behind Networks: Analyze the Influence Based on the Co-author Network, 2015 International Conference on Computer Science and Applications (CSA),Pages: 323-328
[27]. Rinta Kridalukmana, Generic social network
data crawler using attributed graph,2015 2nd
International Conference on Information
Technology, Computer, and Electrical
Engineering (ICITACEE),Pages: 138 - 142
[28]. Rouhollah Nabati, Ali Ghaffari Nejad, Ali
Yousefi, EDSS: An extended deterministic
scale-free small world network,2016 Eighth
International Conference on Information and Knowledge Technology ,Pages: 78-83
[29]. Sandra Meza-Fernandez , Agustín
Sepúlveda-Sariego, Representational model on Moodle’s activity: learning styles and navigation strategies, International Journal of Educational Technology in Higher Education June 2017
[30]. Sebastien Heymann; Benedicte Le Grand, Visual
Analysis of Complex Networks for Business Intelligence with Gephi, 2013 17th International Conference on Information Visualization, Pages: 307-312
[31]. Shraddha Dwivedi; Paridhi Kasliwal; Suryakant
Soni, Comprehensive study of data analytics tools (RapidMiner, Weka, R tool, Knime) ed in: Colossal Data Analysis and Networking (CDAN), Symposium on: 18-19 March 2016
[32]. O. A. Tsukanova; E. P. Vishnyakova; S. V.
Maltseva, Model-Based Monitoring and Analysis of the Network Community Dynamics in a Textured State Space, 2014 IEEE 16th Conference on Business Informatics 2014, Volume: 2, Pages: 44 - 49
[33]. P. R. Visali Lakshmi; G. Shwetha; N. Sri
using r-tool, Biosignals, Images and
Instrumentation (ICBSII), 2017 Third
International Conference on 16-18 March 2017
[34]. Wael F. Al Sarraj, Khalid M. Kahloot , Ashraf
Y. Maghari, Mahmoud M. Abu-Ghosh, A Social Network Analysis of Tweets during the Gaza War, Summer 2014, Future Internet of Things and Cloud Workshops (FiCloudW), IEEE International Conference 22-24 Aug. 2016
[35]. Wael F. Al Sarraj, Khalid M. Kahloot , Ashraf Y.
Maghari; Mahmoud M. Abu-Ghosh Keyword based searching in social networks, SAI Computing Conference (SAI), 2016, 13-15 July 2016
[36]. Wissam Tawileh, Evaluating Virtual
Collaborative Learning platforms using Social Network Analysis 2016 Sixth International Conference on Digital Information Processing and Communications (ICDIPC) Sepetember 2016: pages 80 - 86
[37]. Zainab Nayyar; Nousheen Hashmi; Nazish
Rafique; Khurram Mahmood, Keyword based searching in social networks, 2016 SAI Computing Conference (SAI),Year: 2016,Pages: 701 - 705