Medical Image Improvement using Different Fusion
Methods
Israa Jameel Muhsin, Yasser Fakhry Sabry
Department of Physics, College of Science, University of Baghdad, Baghdad, Iraq
Abstract
Data fusion is a process that deals with data and information originated from multiple sources to achieve refined improved information for decision making. In this research fused techniques between CT image with MRI image at the same position section and dimension, Where CT image consider to be low resolution rather than MRI. Many fusion techniques have been used such as HSV, gram-schmidt spectral, wavelet and PCA. As well as different criteria like MSE, RMSE, CC, ERGAS and RASE were applied to perform the comparison between the fused and original image.
Keywards: image fusion, HSV,wavelet, PCA, Gram Schmidt.
1. Introduction
Data fusion is a process that deals with data and information originated from multiple sources to achieve refined improved information for decision making. A general definition of image fusion is given us "the combination of two or more different images to form a new image by using certain algorithm" [1].
In this research fused techniques between CT image with MRI image at the same position section and dimension, Where CT image consider to be low resolution rather than MRI, To help physician in diagnosis of the disease come to application the fusion methods that fused between CT image and MRI image to enhance CT image. MRI is an imaging technique used primarily in medical settings to produce high quality images inside the human brain. It is based on the principles of nuclear magnetic resonance (NMR), a spectroscopic technique used by scientists to obtain microscopic chemical and physical information about molecules[2,3] . CT scanning is a medical test that combines x-ray with computerized technology. While this painless and noninvasive procedure greatly assists radiologists in diagnosing cardiovascular diseases, musculoskeletal problems, infectious diseases, trauma and certain types of cancer, the CT scan also carries radiation-induced risks [4]. This research is attempt to enhance the resolution and the clarity of medical CT image by fusing it with MRI image to get high resolution medical image. This process have been performed by using many fusion techniques such as HSV, gram-schmidt spectral, wavelet and PCA.
2. Fusion Techniques
In this research four fusion methods have been used, the details of these methods can be listed below:
2.1 Perceptual Color Models
The basic process behind the perceptual color model and the transformation from an RGB coordinate system to a hue, saturation and brightness coordinate system is as follows. For 24-bit deep input image (RGB), we define the achromatic axis in RGB space as the line joining (0,0,0) and (255,255,255) and the chromatic plane as a plane which is perpendicular to the achromatic axis and intersects it at the origin. We then choose a function L(C) which calculates the brightness or intensity of the color C =(R,G,B). The projection of L(C) onto the chromatic plane defines the hue and saturation of C, where the hue corresponds to the angular coordinate around the achromatic axis and the saturation corresponds to a distance from the achromatic axis. The hue corresponds to an angular coordinate and is therefore measured in radians or degrees [5]. Figure (1) illustrates the construction of a perceptual color model.
Figure (1) Shows the perceptual color spaces. It has a cone shape where the central axis represents the intensity. Along this axis are all grey colors, with black at the pointed end of the cone and white at its base. The greater the distance along this axis the higher the intensity [ 5].
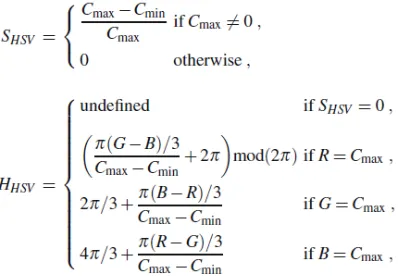
The brightness function used in the HSV model is LHSV = max(R,G,B) ,
and the corresponding HSV saturation and hue expressions are:
2.2Fusion image based on The Gram–Schmidt process.
The Gram Schmidt fusion simulates a panchromatic band from the lower spatial resolution spectral bands. In general, this is achieved by averaging the multispectral bands. As the next step, a Gram Schmidt transformation is performed for the simulated panchromatic band and the multispectral bands with the emulated panchromatic band employed as the first band. Then the high spatial resolution panchromatic band replaces the first Gram Schmidt band. Finally, an inverse Gram Schmidt transform is applied to create the pan sharpened multispectral bands [6,7,8].
2.3 wavelet
The wavelet fusion method is based on the wavelet decomposition of images into different components based on their local frequency content. We perform the Wavelet Transforms on the color CT and MRI images to extract the low frequency data from the color CT image and the high frequency data from the MRI image. These components are combined to create the Fused Wavelet Coefficient Map. The inverse wavelet transformation is performed on the fused map to create the fused image. Figure (2) is a visual representation of the wavelet method [9,10].
Figure (2) show Block Diagram of the DWT Image Fusion.
2.4 PCA Fusion
Most of the information in the input images Ak,k ∈ {1,2, . . . ,K}, is present in the first eigenvector w1. The first eigenvector w1 (also known as the first principal component image) may therefore be regarded as the optimal fusion of the Ak into a single image. In general the fused image will be of less quality than any of the originals because we are only selecting the highest eigen value and therefore some of the structural patterns in the original images are lost. In order for PCA to be used effectively there needs to be a strong correlation between the original image data and the fused image data. An important PCA fusion technique is PCA pan-sharpening. Pan-sharpening is concerned with fusing a panchromatic image with a high spatial resolution with a multi-spectral image with a low spatial resolution. In the traditional PCA pan-sharpening algorithm, we replace the first principal component image with the panchromatic image. The reason for this choice of component is that, by definition, the first principal component has the largest variance and therefore contains the most information. Before the first principal component is replaced by the panchromatic image, the panchromatic image is histogram matched to the first principal component image. The remaining principal components (eigenvectors) are considered to have band-specific information and are left unaltered. The inverse PCA is performed on the modified PAN image and the principal components to obtain a high-resolution pan-sharpened image. An improved PCA pan-sharpened image may be obtained by optimally choosing which principal component to replace[5].
3. Methodology
Image fusion provides an efficient way to merge the visual information from different images. The fused medical image contains complete information for better human or doctor perception and computer-processing tasks, such as segmentation, feature extraction, and object recognition. In this research four techniques have been adopted to fuse the CT and MRI image as follow steps:
U
Step one:U convert gray CT image to color image using density slice.
U
Step two:U Register the low resolution color CT image to the same size as the high resolution
MRI image in order to be superimposed. The resize process have been performed using nearest interpolation method.
U
Step three:U apply the adaptive techniques as:
HSV: Three components of the original image R, G and B are transformed into the HSV color space. Then the low-resolution Intensity component of HSV is replaced by the MRI band with higher spatial resolution. transform the image back to RGB color space with the original values of H and S.
Gram Schmidt transformation: is performed for the simulated MRI band and the CT bands with the emulated MRI band replaces the first Gram Schmidt band. Finally, an inverse Gram Schmidt transform is applied to create the fused image.
Wavelet: The MRI image are decomposed into wavelet transformed images, The transformed images include low- low frequency portion and three high frequency portions. the color CT images are re-sampled, so as to have the same geometric size as the low frequency portion of the high-resolution MRI image. the low frequency portions of the wavelet transformed images are replaced by the re-sampled CT image. inverse wavelet transformations are carried out for the replaced image. The fused image retains the spectral information of the original CT images and also the high spatial resolution of MRI image.
PCA: Implement PCA transforms on CT image to product PC1, PC2, and PC3. Then replace PC1 of CT image by MRI band, after that Inverse PCA transform to obtain fused image.
4. Results and discussion
There are many different ways to analysis the results of fused images and to compare between the adaptive fusing techniques. These ways include spatial and spectral quality, for spatial one it's easy to notice or to see the different between the edges of the result fusing image and multispectral. But when judging spectral quality, it seems to be more difficult to match the color of the result fusing image to the original image.
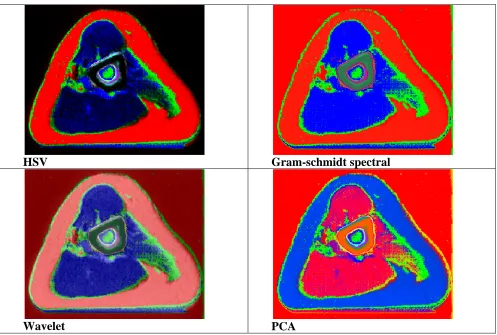
In this research four fusion techniques have been achieved on medical images, these image represent by CT and MRI. For subjective criteria or spatial quality PCA technique give good fusing image for all adaptive images. but when the spectral quality metric has been computed between the result and the original multispectral image, the results in table (2) show that Schmidt- gram technique give the best result compare with the other techniques where this technique achieve less root mean square error, high correlation coefficient as well as accepted value of Relative Dimensionless Global Error in Synthesis (ERGAS) and Relative Average Spectral Error (RASE).
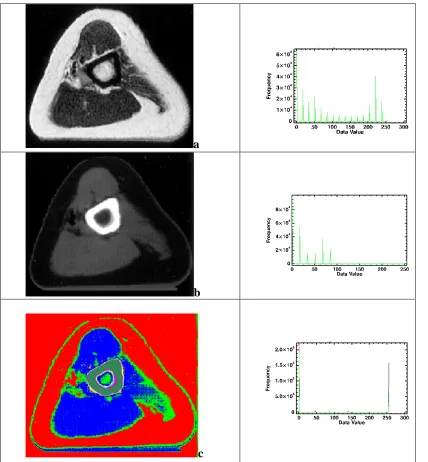
Figure (3): show the original images a) MRI, b)CT, c) Color CT using density slice.
Table (1) show the statistical properties of the original images.
Medical Images bands Min. Max. mean Stdv.
MRI
Band1 0 255 96.090273 91.849465
Band2 0 255 96.090273 91.849465
Band3 0 255 96.090273 91.849465
CT Band1 0 255 33.890121 47.134681
Band2 0 255 33.890121 47.134681
Band3 0 255 33.890121 47.134681
Color CT Band1 0 255 159.17803 122.4769
Band2 0 255 36.94433 87.59177
Band3 0 255 62.58331 108.0553
a
b
c
HSV Gram-schmidt spectral
Wavelet PCA
Figure (4) the fusing image using different fusion methods.
Table (2): the fidelity criteria between fusing and original image.
Methods MSE RMSE PSNR Cc ERGAS RASE
PCA 52.6349 7.2550 30.9181 0.1299 1.9300 10.3676
Gram 4.8295 2.1976 41.2918 0.9999 1.0645 7.0925
HSV 66.2514 8.1395 29.9189 0.5094 6.0410 1.0250
wavelet 21.2603 4.6109 34.8551 0.9493 0.8288 12.2427
1. References
1. POHL C, VAN GENDEREN J.L., ' Review Article: "Multi sensor Image Fusion in Remote Sensing: Concepts, Methods and Applications", Remote sensing, 1998, Vol.19, No.5,pp. 823-854.
2. Kesavamurthy T., Subha Rani S.,“Pattern Classification using Imaging Techniques for Infarct and Hemorrhage Identification in the Human Brain”,Calicut Medical Journal Vol.4,No.3, 2006.
3. Peter A. R. “An introduction to Magnetic Resonance in Medicine” Edited by, Oxford Blackwell scientific publications, Third edition, 1993.
4. Deserno T. M., "Biomedical Image Processing", Springer-Verlag Berlin Heidelberg, 2011.
5. H.B. Mitchell, “Image Fusion Theories, Techniques and applications” , ISBN 978-3-642-11215-7, _c 2010 Springer-Verlag Berlin Heidelberg.
6. Sascha Klonus, Manfred Ehlers,” Manfred Ehlers “Performance of evaluation methods in image fusion “12th International Conference on Information Fusion Seattle, WA, USA, July 6-9, 2009.
7. C.A. Laben, V. Bernard, and W. Brower, Process for enhancing the spatial resolution of multispectral imagery using pan-sharpening, US Patent 6,011,875, 2000.
8. Israa J. Muhsin, Foud,K. Mashee, “Improving Spatial Resolution of Satellite Image Using Data Fusion Method”, Iraqi Journal of Science, December 2012, Vol. 53, No .4, Pp. 943-949.
9. Dumitru. B.2012.'' Advances in Wavelet Theory and Their Applications in Engineering, Physics and Technology''. Publisher: InTech. ISBN 978-953-51-0494-0, pp.646 .
10.Mitchell .H.B.2010.''Image Fusion Theories, Techniques and Applications''. Springer-Verlag Berlin Heidelberg .
![Figure (1) [ 5]. Shows the perceptual color spaces. It has a cone shape where the central axis represents the intensity](https://thumb-us.123doks.com/thumbv2/123dok_us/7839516.1299336/2.612.251.392.325.451/figure-shows-perceptual-color-spaces-central-represents-intensity.webp)