Generating Placement Intelligence in Higher
Education Using Data Mining
Praveen
Rani
#1 , Dr. Rajan Vohra*2# 1
Students, Computer Science & Engineering Deptt., P.D.M College Of Engineering, Bhadurgarh, Haryana(India) *2
Head of Deptt., Computer Science & Engineering Deptt., P.D.M College Of Engineering, Bhadurgarh , Haryana(India)
Abstract— This paper presents a comprehensive statistical experiment to identify the number of students those are ready for placements and students those are not fulfilling the basic criteria for placement from a large database of all computer engineering students of a college containing their academic record. The design of experiments software named Weka Tool is used for making three clusters of whole database which will categorise the students according to their qualifications. A variety of important parameters for measuring student’s performance including academic performance, technical skills, soft skills, training and projects are considered to capture the desirability and ability of a student for placement. With the simulation and analysis results, it conclude that how many students in the college are ready and fulfil all basic requirements for sitting in a placement drive, how many students need to improve their performance and how many students will face difficulty in completing his/her degree. After getting the results in form of three clusters, then a system is trained that predicts the category of the student from a new database for next session. This system will validate the results and classify that which student should comes under which cluster.
Key Words: Placement, Data mining, Clustering,
Segregation, Classification validation, Weka tool.
1. INTRODUCTION
A university is an institution of higher education and research which grants academic degrees in a variety of subjects and provides both undergraduate education and postgraduate education. University perform various activities like enrolling the students, conducting classes, conducting special workshops of different subjects, conducting placement etc. This paper is going to describe the activity related to placement, its two important problems and their solutions.
Placement:
Placement means arranging or positioning in a specified location or level. Objects, individuals, or activities are usually placed according to a design or plan. The action of putting someone or something in a particular place or the fact of being placed [1].
Placement Cell:
The goal of the Placement Cell of the Institute is to provide employment Opportunities and world class training to students of the Institute in leading
organizations/Industry. The Placement Cell further provides ample opportunities to the students to develop their personality by conducting programs regularly on communication skills and other soft skills. The Placement Cell makes the students Industry friendly and Industry ready candidates. The Cell is well equipped with ample infrastructure in terms of Seminar Halls, Meeting/Consultancy Hall for Pre Placement Talk, Presentations, etc. It also arranges training for students in Industries for two to four weeks at the end of the session.
Institute – Industry Collaboration:
All the reputed organizations including MNCs come to the Institute for Campus Recruitment. To achieve its goal, the Placement Cell works towards recognizing the core competencies of students. It works through a close knot organization and has a structure which conveys information to the students at the fastestpossible rate. A common placement brochure for all the branches is published. The Placement Cell firmly believes in ‘Industry-Institute Interaction’. In order to accomplish ‘Industry-Institute Interaction’, it organizes technical talks and seminars to provide a platform for the budding students to interact with professionals from various industries. It encourages visits to the industries by the Institute students. It arranges for industrial problems to be worked on by students as part of their projects. It also takes suggestions from members of industry organizations and industrial chambers.
1.1. SIGNIFICANCE OF THE PROBLEM
The questions this work can provide the solutions to, can be given as follows:
1. What type of students the college have according to their academic scoring?
2. How many students will eligible to attend placement process and having chances to get campus placement?
3. Predict in advance, the same for pre - final year students?
2. RESEARCH BACKGROUND
relatively low computational requirements. This study classifies student cluster/ segmentation methods for detecting three groups of students.
In 2011, V.Ramesh, P.Parkavi, P.Yasodha used different classification techniques like NaïveBayes Simple, Multilayer Perception, SMO, J48, REPTree are used as predictive tools in the data mining domain and after comparing their performances. From the results it is proven that which algorithm is most appropriate for predicting student performance [4].
In 2012, Bhusry Mamta provides knowledge management and data mining applications to transform institutional knowledge to institutional intelligence in order to achieve their educational goals and objectives [5].
Data mining - also known as knowledge-discovery in databases (KDD) is process of extracting potentially useful information from raw data [6]. The primary goals of Data Mining in practice tend to be Prediction and Description [7] and [8]. Modelling of student performance at various levels is discussed in [9], [10], and [11]. Finally (Henrik, 2001) concluded that clustering was effective in finding hidden relationships and associations between different categories of students. Clustering is a typical unsupervised learning technique for grouping similar data points. A clustering algorithm assigns a large number of data points to a smaller number of groups such that data points in the same group share the same properties while, in different groups, they are dissimilar.
However the segregation of students according to their educational qualifications and a trained system for prediction is not generated till now in higher education to increase the number of students ready for placement y increasing their services. this study will provide a method to segregate the students as well as trained system that predict the student’s category and provide information about how many students will ready for campus placement, how many students will need to work hard for sitting in campus placement drive and how many students will face even in completing their degree.
3. RESEARCH METHODOLOGY
For solving above described problems some research techniques and methodologies are used for obtaining the desired result. Some tools and algorithms are required for obtaining the result. Main steps under the research methodologies
are:-Review literature or research papers – first of all
literatures and research papers were reviewed for getting more information about the problem and knowing which type of work was done by others on this topic and by which method.
Identify tools – then tools required for solving the
problem were identified and the best tool – “WEKA” was selected from all.
Study database attributes and data structure –
attributes and structure of the database was thoroughly studied for finding out useful attributes from the passport. For critical attributes used in the database a data set of
placement cell of a reputed engineering college was studied.
Determine nature and definition of research problem
and work flow of the problem for getting accurate and desired result.
Organize the database [10] with useful attributes and
populate it then perform data analysis using suitable tool e.g., WEKA in order to generate the result.
4. CONCEPTUAL FRAME WORK
Clustering has many applications, including part family formation for group technology, image segmentation, information retrieval, web pages grouping, market segmentation, and scientific and engineering analysis [12].
Classification algorithms are widely used in various medical applications. Data classification is a two phase process in which first step is the training phase where the classifier algorithm builds classifier with the training set of tuples and the second phase is classification phase where the model is used for classification and its performance is analysed with the testing set of tuples [13].
Overview of the techniques employed
The following techniques are applied to profiling and classify the student database:
1. K-Means Clustering:
K-Means [14] is one of the simplest unsupervised non-hierarchical learning methods among all partitioning based clustering methods. It classifies [15] a given set of n data objects in k clusters, where k is the number of desired clusters and it is required in advance.
2. J-48 Algorithm
C4.5 is an algorithm used to generate a decision tree developed by Ross Quinlan. C4.5 is an extension of Quinlan's earlier ID3 algorithm. The decision trees generated by C4.5 can be used for classification, and for this reason, C4.5 is often referred to as a classifier [16] [17]. It induces decision trees and rules from datasets, which could contain categorical and numerical attributes. The rules could be used to predict categorical values of attributes from new records.C4.5 builds decision trees from a set of training data in the same way as ID3, using the concept of information entropy.
This paper presents solution to two main problems related to segregation and prediction. These problems are:
4.1 Segregation of students into 3 groups
Significance of A, B, C Groups
The whole database is divided into three groups. Significance for performing segregation are:
To know how many students having good performance in academics.
To know how many students need some hard work to become eligible for placement.
To know how many students are not able to even completing their degree with in course duration. The students are segregated into 3 groups on basis of their score.
Group 1 having students in between the score range 0.55 - 0.6. These students are below average students and face difficulty in completing their degree because of having so many back logs.
Group 2 having students in between the score range 0.7 – 0.8. These students are above average as they have no backlogs and having high performance in academics. They are also eligible for campus placement just because they already had done hard work in their academics. Group 3 having students in between the score 0.625 – 0.675. These students are average in academics and need some improvement to become eligible for placement.
Figure 1 Segregation of Students
In fig. 1 c1, c2, c3 are various clusters refer different groups/ categories of students according to their academic scoring.
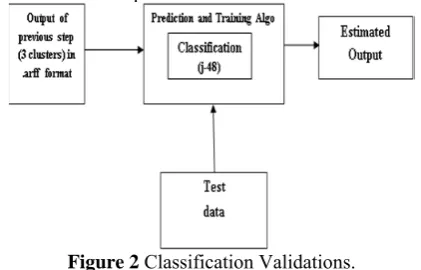
4.2 Classification validation
In this problem we estimate in advance that how many students will get campus placement next year according to their academic qualification. In this problem we have to train a system that can predict that which student should come under which group according to their educational qualifications. Above average student’s group will be assumed to place.
Figure 2 Classification Validations.
We trained a system (refer figure 2), able to predict that which student comes under which category according to their marks in academic carrier. Again same database is
used to train the system and then a test data set is generated. Then J48 decision tree algorithm is chosen to make prediction of groups or categories for the students of a particular range of marks.
For solving these problems a database is prepared as:
Preparing the Database [10] - For obtaining the result, a
database of 600 records/entries is a primary data collected by random sampling, is used to solve the problems. Various attribute are selected from placement cell database and prepared 5 excel sheets having performance record of students in different fields. Sheet 1 contain the combined and average data of Academic, Technical skill, Soft skill and Training & Project. While sheet 2, sheet 3, and sheet 4 having detailed record of student performance in Academics, Technical skill and Soft skill. At last the 5th sheet contains only the roll no. and final result (which is the average of all fields/ sheets). The whole values in dataset are in between 0 and 1 range so that it becomes easy to compute and calculate the final result This datasets input to Weka tool and keep only one attribute i.e. Final Result to obtain pure and accurate clusters.
5. RESULTS AND DISCUSSION
Segregation of students into 3 groups
In this part, the whole data of placement intelligence is refined and input to Weka tool for clustering. Then students are segregated into different groups according to their overall performance.
Figure 3: Segregation of Students
The information retrieved from figure 3 is as follows:
1. Cluster 0 students comes under category A having
170 students scoring between 0.55 and 0.6 and analysed that they never be ready for placement. They facing problem even in completing their degree.
2. Cluster 1 students comes under category B having
230 students scoring between 0.7 and 0.8 and can be considered as ready for placement as they scored above average marks.
3. Cluster 2 students come under category C having
Here the above said results represent in tabular form in Table 1.
Table 1 Profiling of Students and Companies Classification Validation
Save the output i.e. three clusters (cluster number 0-2) in .arff format. Then input this output directly to Weka tool, select classification, then input test data (record of pre final year students including random cluster number between 0-2). Then analyse the results. we feed record of 9 students including their final result and cluster number (any random cluster number between 0 and 2) then Weka generate its predicted output as:
Figure 4 Confusion matrix of Prediction
Cluster 0: contain 2 entries; one is in class A which is
correct because cluster 0 indicate class A and one entry is in class B which is wrong. As this entry comes under class B so it should be moved to cluster 1.
Cluster 1: contain 3 entries from which 2 are correct as
they comes under class B which represent cluster 1 but 1 entry comes under class A which represent cluster 0 so this student is of cluster 0 and we need to correct this record by moving this student from cluster 1 to 0.
Cluster 2: contain 4 record in which only 1 is correct
which is under class C and 2 records of class A need to move in cluster 0 and 1 record which is under class B need to move in cluster 1.
The above description is shown in Table 2, in a nutshell.
Table 2 Classification Validation
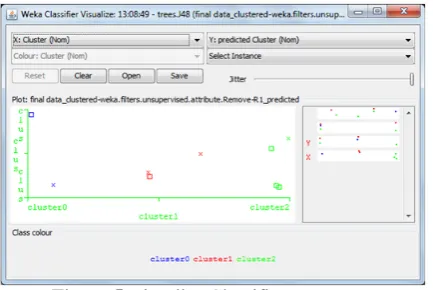
Figure 5 Visualize Classifier Error
Figure 5 represents the classifier error or output of prediction in visualization form. Here square box denote that the student actually belongs to a different cluster but we mentioned the different cluster in record of that student.
Figure 6 Decision tree
Figure 6 describe the distribution of scores in three clusters. First the decision tree divide the whole database in two parts one is having range greater than 0.675 named as cluster 1(right side of tree) having 230 entries and the other part having range less than or equal to 0.675 (left side of tree) which is further bifurcate in two parts one is cluster 0 (left side) having 170 entries of <= 0.6 value and the second is cluster 2 (right side) having 200 entries of > 0.6.
6. CONCLUSION
Identification of range of students according to their academic performance via the data mining technique - The data is taken from an engineering institute for this study. This study uses simple K-Mean clustering and j-48 classification algorithm for student’s segregation. The final results demonstrate that the proposed approach revealed the quantitative analysis of students according to their educational performance. Ready for placement, being ready for placement and never become ready due to very poor academic record. From the results, cluster 2 has average students, and represents about 200 students out of 600 students in final year of the college, 33 percent of the students those need some improvement in academic carrier to sit in placement drive. The cluster 1 has above average students, and represents about 230 students and
Cluster No./ Class
Performance of students
No. of Students in each category
Cluster 0 / A 0.55 - 0.6 170
Cluster 1 / B 0.7 – 0.8 230
Cluster 2 / C 0.625 – 0.675 200
CLUSTER 0 1 2
TOTAL RECORDS 2 3 4
CORRECTELY
CLASSIFIED 1 2 1
WRONGLY
CLASSIFIED 1 1 3
PREDICTED
CLUSTER Cluster 1 Cluster 0
38 percent of the students those are ready for sit in placement drive. The cluster 0 has below average students and represents about 170 students and yet only by 28 percent of the students those facing problem even in completing their degrees on time. Also trained a system that predicts the expected class or category of student by analysing the previous clustering record.
7. FUTURE WORK
Based on the results the university or college can decide to conducting workshops and make more efforts to improve student’s performance by mainly focuses on A and C category students. The further work on segregation (clustering) using more detailed behavioural data and by considering teachers point of view about student’s extra curriculum activities and by other existing performance indicators [10]. Other possible future works are predicting company name i.e. which company may hire what type of student. For this purpose association of companies’ basic requirement and student’s qualification is to be done. A data ware house can develop to track academic performance and placement team over a long period of time.
ACKNOWLEDGEMENTS
Author would like to thanks to her head Dr. Rajan Vohra, HOD of CSE & I.T department, PDMCE, Bahadurgarh his valuable support and help.
REFERENCES
[1] http://www.allaboutcareers.com/careers-advice/work-placements/what-is-a-placement.
[2] http://mckinseyonsociety.com/education -to-employment/report
[3] http://www.naukrihub.com/recruitment/ importance-of-recruitment.html
[4] V.Ramesh, P.Parkavi, P.Yasodha, “ Performance Analysis of Data Mining Techniques for Placement Chance Prediction”, International Journal of Scientific & Engineering Research Volume 2, Issue 8, August-2011.
[5] Bhusry Mamta, “Institutional Knowledge to Institutional Intelligence: A Data Mining Enabled Knowledge Management Approach, International Journal Of Computational Engineering Research (ijceronline.com) Vol. 2 Issue. 5
[6] David Hand, Heikki Mannila, Padhraic Smyth ,Principles of Data Mining.
[7] Dr. Sankar Rajagopal, “CUSTOMER DATA CLUSTERING USING DATA MINING TECHNIQUE” International Journal of Database Management Systems ( IJDMS ) Vol.3, No.4, November 2011
[8] Y. Ma, B. Liu, C.K. Wong, P.S. Yu, and S.M. Lee, ―Targeting the Right Students Using Data Mining, Proceedings of KDD, International Conference on Knowledge discovery and Data Mining, Boston, USA, 2000, pp. 457-464.
[9] S. Kotsiantis, C. Pierrakeas, and P. Pintelas, ―Prediction of Student’s Performance in Distance Learning Using Machine Learning Techniquesǁ, Applied Artificial Intelligence, Vol. 18, No. 5, 2004, pp. 411-426.
[10] Database -“Placement Intelligence”
[11] P. Cortez, and A. Silva, ―Using Data Mining To Predict Secondary School Student Performance, In EUROSIS, A. Brito and J. Teixeira (Eds.), 2008, pp.5-12.
[12] Pham, D.T. and Afify, A.A. (2006) “Clustering techniques and their applications in engineering”. Proceedings of the Institution of Mechanical Engineers, Part C: Journal of Mechanical Engineering Science
[13] Mitchell TM. Machine learning. Boston, MA: McGraw-Hill, 1997.
[14] Hartigan, J., A. and Wong, M., A. 1979, “A K-Means Clustering Algorithm”, Applied Statistics, Vol. 28, No. 1, pp. 100-108. [15] Selim, S., Z. and Ismail, M., A. 1984, “K-Means Type
Algorithms: A Generalized Convergence Theorem and Characterization of Local Optimality”, IEEE Trans. Pattern Anal. Mach. Intel., Vol. 6, No. 1, pp. 81–87.
[16] Veronica S. Moertini,” Towards the Use of C4.5 Algorithm For Classifying Banking Dataset”,Integral, Vol.8 No.2,October2003.
[17] J. R. Quinlan, “C4.5: Programs for Machine Learning”, Morgan Kaufmann Publishers, 1993.
[18] Ashish, Arun, 2006, “IT Based KM in Indian Higher Education System: Addressing Quality Concerns and Setting, the Priorities Right”, Journal of Knowledge Management Practice, vol.7, No.3 [19] Weka – Data Mining Machine Learning Software,
http://www.cs.waikato.ac.nz/ml/
[20] Osmar R. Zaïane,” Principles of Knowledge Discovery in Databases - Introduction to Data Mining”, CMPUT690, 1999. [21] PankajSaxena,Vineeta Singh and SushmaLehri,” Evolving
Efficient Clustering Patterns in Liver Patient Data through Data Mining Techniques”, International Journal of Computer Applications (0975 – 8887), Volume 66– No.16, March 2013.
[22] Pham, D.T. and Afify, A.A. (2006) “Clustering techniques and their applications in engineering”. Proceedings of the Institution of Mechanical Engineers, Part C: Journal of Mechanical Engineering Science.
[23] Er. Arpit Gupta, Er.Ankit Gupta,Er. Amit Mishra,” Research Paper on Cluster Techniques of Data Variations”, International Journal of Advance Technology & Engineering Research (IJATER).
[24] Hartigan, J., A. and Wong, M., A. 1979, “A K-Means Clustering Algorithm”, Applied Statistics, Vol. 28, No. 1, pp. 100-108. [25] Selim, S., Z. and Ismail, M., A. 1984, “K-Means Type Algorithms:
A Generalized Convergence Theorem and Characterization of Local Optimality”, IEEE Trans. Pattern Anal. Mach. Intel., Vol. 6, No. 1, pp. 81–87.