Journal of
RANGE MANAGEMENT Vozume~
dYmber4
Limits on Western Range Forage Production-Water or Man ________ Wesley Keller 243 Costs and Returns in
ImprovementsRE
a Study of Common Property Range
James R. Simpson 248 Why Some Cattlemen Overgraze-and Some Don’tRE
M. C. Shoop and E. H. McIlvain 252 Tall Larkspur: Some Reasons for Its Continuing Preeminence
as a Poisonous Plant __ .______.__ ______________________________.____._______.__ ____._..._.___._ __ E. H. Cronin 258 Ranching in East Africa: A Case Study __________________________________________________ Jon M. Skovlin 263 Moving and Mixing Range Steers ______________________-____- E. H. McIlvain and M. C. Shoop 270 Native Forage Response to Clearing Low Quality
Ponderosa Pine ________________________-___ Wesley W. Thompson and F. Robert Gartner 272 Why Squirreltail Is More Tolerant to Burning
than Needle-and-Thread _______________________________________________.__..._________ Henry A. Wright 277 Woody Phreatophyte Infestation of the Middle Brazos
River Flood Plain ______________..______________ Frank E. Busby, Jr. and Joseph L. Schuster 285 Seedling Morphology and Seeding Failures with
Blue Grama ____________________________---- D. N. Hyder, A. C. Everson, and R. E. Bement 287 Germination Responses of Three Desert Grasses to Moisture
Stress and Light ________________________________----__ Carlos R. Tapia and Ervin M. Schmutz 292 Response of Honey Mesquite Seedlings to Top Removal
C.
J*
Scifres and R. R. Hahn 296 Phenology of Salt Desert Plants near Contour FurrowsRoss W. Wein and Neil E. West 299 Mineral Composition of Native and Introduced Clovers
John W. Hamilton and Carl S. Gilbert 304 Technical Notes
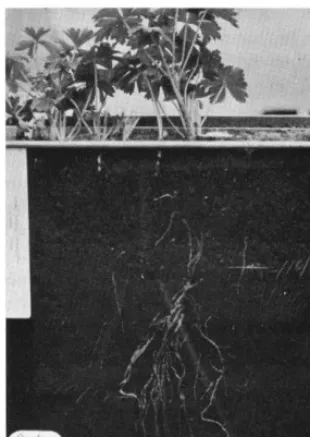
A Rapid Method for Washing Roots
William K. Lauenroth and Warren C. Whitman 308 Bow and Arrow Brush Transects __________._____________--______________________ Larry L. Walker 309 Testing for Outlying Observations in a Sample Group .______ Charles D. Bonham 310 Ocular Point Quadrat Method ___________________________-________-_--_--______ Kamal M. Ibrahim 3 12 Vertical Fire Guards to Control Burning in Small Plots __._ J. L. Launchbaugh 313 Management Notes
Cattle Dips Are Used as a Tool for Range Management
in Masailand, Tanzania ____________________-_______________________ E. G. Van Voorthuizen 3 14 Viewpoints
The Seventies: Challenge and Opportunity ____________________---_-_-_--__ Donald R. Dietz 3 16 The Profession Versus the Population _____________________-___________________ Patrick I. Coyne 3 18 Proper Use: Old Concept-New Ideas ______________________---__ Henry C. Lawson, Jr. 319 Why Not Say It the Way It Is! ______________________--______--___-_--_____---_-____-__ C. Wayne Cook 320
Book Reviews ______________________________-_---_._____._________________-__-___..________----___________________________-__________-- 322 RE = Con Resumen en Espaiiol
cover Photo-The
Brood
COW.
Limits on Western Range Forage Production-
Water or Man1
Water is generally regarded as the limiting factor in forage production on arid rangeland. If 800 lb. is taken as the water requirement for a pound of range forage, 12 inches as the average precipitation, and 400 lb. as the average forage production/acre, only 12.5% of the precipitation, or 1.5 inches, is used in producing the forage crop. If we estimate that in addition, 1%~ inch is lost to deep percolation, 1 inch to over-the-surface runoff, and 1 inch to undesirable vegetation, we account for 4 inches. Thus, the remainder, two-thirds of the total precipitation, is lost by evaporation, without benefit to man. The importance of the resource lost bv evanoration is discussed in relation to the potential pro- ductivity of arid land;. A
U. S. history during the 19th century was one of westward move- ment, characterized by buffalo hunts, Indian wars, cattle kingdoms on the plains, the sod busters, the pony express, the transcontinental railroad and telegraph, barbed wire, and range wars. In the westward migration, largely by people of European descent, there was no background experience to alert them to the low per-acre productiv- ity of the arid West as compared to the humid East. In those days the range was thought of as an inex- haustible resource. That it was not, had to be learned the hard way, and by the time it was learned, much of the range had been seriously damaged.
The concept of water as the limit- ing factor in range forage produc- tion developed naturally, once the limits of arid land productivity were realized. All one had to do was note the limited precipitation, com- pared to the higher precipitation in the Eastern States. Western soils were generally regarded as more productive than those in the East (less leached), and the western cli- mate was less inclined to foster plant diseases. Certainly if the soils and climate were favorable, water had to be the limiting factor.
The interesting, if tragic, story of the western range has been written by many and is common knowledge to all range-oriented people. Inter- ested “outsiders” will get an account of range deterioration in central Texas from Bentley (1898). Barnes (1926) gives a comprehensive and fascinating treatment of the entire western range.
A written statement cannot alter the facts, and water is the limiting factor in the sense that if more water is provided, production is in- creased. This is amply borne out by the superior production of crops under irrigation in the West as compared with production under natural precipitation. But it may be profitable to take a fresh look at the water resource in the West and consider it in relation to the plant’s need for water.
1 Cooperative investigation by the Plant Science Research Divison, Agricultural Research Service, U. S. Department of Agriculture, and the Utah Agricul- tural Experiment Station. Utah Agri- cultural Experiment Station Paper 1051. Received July 13, 1970; ac- cepted for publication January 16, 1971.
The intent is not to offer a pre- cise analysis. The available infor- mation is too scanty-there are too many gaps. But, on the basis of the information we have, reasonable generalizations can be made. They sum up to a fairly startling picture, and suggest that the limiting factor is not so much water as it is man’s WESLEY KELLER
Agronomist, Plant Science Research Division, Agricultural Research Seroice, U. S. Department of Agriculture, Logan, Utah
Highlight
243
ability to intelligently manage the water received.
The Water Requirement of Plants A considerable body of informa- tion has been accumulated on the water needs of plants. For the arid West, Briggs and Shantz (1914) and Shantz and Piemeisel (1927) con- ducted some classic work at Akron, Colorado early this century. They found that different species of plants transpired from less than 300 lb. to over 1000 lb. of water/lb. of dry matter produced. Those with relatively high water needs included smooth brome (Bromus inermis), western wheatgrass (Agropyron smithii), and alfalfa (Medicago satiua). Those with a low water re- quirement included sudangrass (Sor- ghum sudanense), blue grama (Bou- teloua gracilis), and buffalograss (Buchloe dactyloides). Crested wheatgrass (Agropyron desertorum) was in an intermediate position. Dillman (1931) verified the water needs of the above species in studies conducted at Newell, South Dakota and Mandan, North Dakota. McGinnies and Arnold (1939) re- ported the water requirement of many Arizona range plants. They also obtained values from less than 300 to over 1000. Water require- ment studies have generally been conducted for short periods only, when growth is rapid. But some in- formation is available for extended periods. McGinnies and Arnold (1939-Table 22) report for 12 warm season grasses a mean summer water requirement of 489, and a mean yearlong requirement of 567. On a yearlong basis these grasses used 16% more water/unit of dry matter produced than they did dur- ing the summer growing season.
244
KELLER
would be greater than for the warm the western range (U. S. Forest Ser- competing vegetation from an aver- season grasses. It might well be less. vice, 1936) and assume an animal age acre of western range. This also For the purpose of this study, 800 unit need of 20 lb. dry matter/day, is an extravagance we cannot afford. lb. will be used as the average water the grazed forage crop would aver- Corrective measures can be highly requirement for forage species on age 200 lb./acre. A policy of take profitable to the operator as evi- the western range. half and leave half would indicate dented by many examples from all
a total production of about 400 lb./ parts of the western range.
Water Received Per Acre acre. If we assume the average acre of arid western range receives 12 inches annual precipitation, some allowance will be made for the small part of the total range that is at high enough elevation to receive ap- preciably higher precipitation, and also that this high altitude range generally shares the water with tim- ber and has a short growing season. Annual precipitation of 12 inches amounts to 2,613,600 lb./acre. Tak- ing the plant’s water requirement at 800 lb., this 12 inches would pro- duce about 3200 lb. dry matter. What is the actual yield?
Forage Yield Per Acre
Average range depletion in 1936 (U. S. Forest Service, 1936) was esti- mated to be 52%. Thus, the western range was producing about half the forage it did in the virgin condition before occupation by the white man. Many excellent range improvement practices have improved the produc- tivity of parts of the arid range since 1936 but the total area is so large that the response to improvement practices has not changed the over- all productivity greatly. The areas where improvements have been ef- fected are small, and largely offset by other areas where continued brush encroachment, erosion, and mismanagement have either low- ered productivity or prevented im- provement.
One of the present glaring defi- ciencies in our agricultural census is that it is almost totally lacking in meaningful statistics on the western range. But we know with reason- able accuracy the numbers of domes- tic and game animals in the West and the percentage of their total feed provided by the range. From these data we estimate 20 million animal units fed yearlong. If we take 728 million acres as the area of
Water Used to Produce the Forage Crop
An average production of 400 lb./ acre is one-eighth of the potential of 3200 lb./ acre arrived at earlier. This means that only about 121/s of the precipitation received, 1% inches, is transpired o’r otherwise used to produce the forage crop. What happens to the remaining 87%%?
Avenues of Water Loss
Water is lost from the range by four obvious avenues: (1) that tran- spired by undesirable vegetation; (2) that lost by over-the-surface run- off; (3) that lost by deep percola- tion; and (4) that lost by evapora- tion from the soil or vegetation.
Undesirable Vegetation Even with widespread herbicide use, the total amount of brush or other unwanted vegetation on western rangelands is probably in- creasing. The dramatic spread of mesquite in the arid Southwest (Buffington and Herbel, 1965) dur- ing the last 100 years is only one indication of the deterioration of the range resource and usurpation of the available water by unproduc- tive vegetation. As much as 2 to 3 hundred million acres of arid range lose more water to unwanted vege- tation than is transpired by the for- age crop. On possibly a hundred million of these acres grass has been crowded out, and unwanted vegetation uses all the water. These hundred million acres must be cleared of the existing vegetation and seeded if they are again to be- come productive.
A reasonable estimate is that somewhere between % inch and 1 inch of water is lost to unwanted
Over-the-Surface Runoff Runoff occurs where the rate of precipitation or snowmelt is greater than the rate of water intake by the soil. It is thus the high intensity storms or rapid rates of snowmelt, that are responsible for most of the runoff. Runoff is generally intensi- fied as slope of land increases. That runoff from rangeland occurs has been abundantly demonstrated. The amount of runoff is not easily determined.
Committee Print No. 21 (1960) of the Select Committee on National Water Resources, U. S. Senate, con- tains information on water yield from various vegetation types. Semi- arid grass and shrub, comprising 330 million acres, is estimated to yield .1 to 1.0 inch/year to streamflow, averaging .4 inch. Pinyon juniper, with 61.4 million acres yields a range from 0 to 3 inches, averaging .5 inch. These types are in rainfall ranges of 5 to 20 and 10 to 20 inches, respectively. Langbein et al. (1949) calculated that the Great Basin (137 million acres) had an average run- off of slightly over 1 inch. Most of this originates on high elevation watersheds. Many runoff studies have been conducted on watersheds ranging in size from small plots to several square miles, and they also contribute substantially to our awareness of the impo,rtance of run- off. They indicate runoff from less than .l inch to over 1 inch/year. Projection of these data to larger areas is hazardous because of the heterogeneity of the range and the tremendous influence of local con- ditions on the fate of the water. The size of the watershed alone has a severalfold effect on measured runoff. This is strikingly illustrated by research in Israel (Evenari et al.,
WATER
OR MAN
245
been in use as early as the 8th to 10th centuries B. C., has been re- constructed. Watersheds as small as l/a acre yielded 15 to 20% of total precipitation (there only 4 to 6 inches annually) while large catch- ment areas yielded only 1 to 5% of the precipitation. The Israeli studies suggest that we might look more closely at some of our desert areas to determine their potential for water harvesting for intensive production on selected adjacent sites. Waterspreading, practiced on many range sites (Monson and Quesenberry, 1958) is a crude form of water harvesting as practiced in Israel. A consideration of the avail- able information leads us to the conclusion that a conservative esti- mate of loss of water from arid rangeland by runoff would be 1/2 inch annually and a more liberal estimate, 1 inch.
Deep Percolation
For much of the arid range, pre- cipitation doesn’t penetrate the soil below the reach of roots. Where it does, this water eventually contrib- utes to stream flow or springs and is important downstream to man. Deep percolation occurs mainly on the higher elevation-higher precip- itation rangelands where the value of the land may be greater as water- shed than as range for forage pro- duction. On these watershed lands a healthy vegetative cover may be highly important for erosion con- trol, and may contribute signifi- cantly during a very short summer season to the feed of game and domestic animals.
Although there are significant percolation losses at higher eleva- tions, we estimate an average of not more than l/2 inch a year lost to on-site productivity by deep perco- lation on an average acre of the western range.
Evaporation
Loss of water by evaporation is taken as the remainder, after the parts required to produce the forage crop, and those lost by the other avenues enumerated above are ac-
counted for. We have the follow- ing:
Source of loss Estimated Percent or use inches of Total Forage production 1.5 12.5 Undesirable
vegetation 1.0 8.3
Runoff 1.0 8.3
Deep percolation .5 4.2 Total accounted for 4.0
Remainder (evaporation)
33.3
8.0 66.7
Total 12.0 100.0
Since our estimations for losses to deep percolation and brush and weeds are generous, it is a reason- able assumption that the remainder, 8 inches, or 66.7% of the estimated 12-inch precipitation is lost by evap- oration, primarily from the soil. Some percentage of the precipita- tion will be intercepted by the vege- tation and never reach the ground, and another fraction will only wet the soil surface. These are not be- lieved to be a very large part of the total precipitation. In winter- rainfall regions these fractions will be very small, but on the plains and other areas of summer precipitation, loss by evaporation of water that never reached the soil or penetrated it may be considerable. The poten- tial for increased plant production by water now lost by evaporation primarily from the soil is so great that we cannot continue to permit it to go unexploited. If we are ever to realize the true productive capa- bility of arid lands, we must learn to prevent, or sharply limit this loss.
Preventing Loss of Water by Evaporation
Experience up to the present time in reducing evaporation from the soil surface has not proven sensa- tional, to say the least. Wheat farm- ers in many parts of the arid West practice alternate cropping and fal- low. The water saved during the year of fallow is very important, but is a relatively small percent of the precipitation received. Bracken and Cardon (1935) from studies at Nephi, Utah, concluded that 30% of the precipitation was conserved
by summer fallow. Mathews and Army (1960), from a survey of many locations in the summer rainfall region of the Great Plains, report less than 20% of the annual precipi- tation saved by fallow. Judging from wheat fallow, it is not likely that clean cultivation between rows of grass would appreciably lower loss of water by evaporation.
A thick vegetative mulch would lower loss of water by evaporation, but would also intercept precipita- tion that would otherwise enter the soil. Some vegetative mulch is highly desirable, but one thick enough to severely restrict evapora- tive loss is not likely to greatly in- crease water available to transpira- tion.
Sheets of plastic might conceiv- ably cover the ground between rows of grass, and these would constitute a highly effective barrier to evapo- rative loss, but none are known that could be laid at a tolerable cost and that might withstand the hooves of grazing animals or the wheels of harvesting machinery. Unless light- proof, weed growth under the plas- tic would be difficult to control.
246 KELLER
In a greenhouse study, Keller (1954) found that a pea gravel
mulch at the rate of 500 g/6-inch- diameter container (120 tons/acre) reduced evaporation by 66% com- pared to a bare soil surface. This was under conditions where bare soil lost only 23% less than a free water surface. The outside atmo- sphere in the West is probably drier than the greenhouse atmosphere but with drier soil beneath the gravel the saving should be greater (van Bavel et al., 1963).
There is insufficient evidence at present to recommend spreading
120 tons pea gravel on each acre of range, but some range soils contain sufficient gravel to provide an ade- quate mulch if that in the top 6 or 8 inches were brought to the sur- face. This might be accomplished with some modified version of a potato digger. Paltridge (19855) has shown that for some forage species cultivated rows 3.5 feet apart have some advantages over closer spac- ings. How would finer or coarser gravel, such as might be available, affect evaporative loss? How long would any evaporation retardant hold up under grazing by livestock or mechanical harvesting? What other substances might be more ef- fective mulches or even cheaper, than gravel? Many questions arise which cannot now be answered. Much research is needed.
We can estimate what the conse- quences of a gravel mulch might be. If two-thirds of the water lost by evaporation could be diverted to transpiration, and if loss from run- off and by unwanted vegetation were stopped, production on our average acre would be increased nearly 4.9 times, or 1950 lb. addi- tional forage, for a total of 2350 lb./ acre. Under such conditions, rather than take half and leave half, we might well leave only about 800 lb. Thus we would harvest nearly 1600 lb. as compared with 200 or almost an eight-fold increase. In an en- vironment providing moisture for such a level of production, use of fertilizer would be highly profitable and would further increase the ef-
ficiency of water use. The species used for range seeding would need to be reexamined.
Once the problem is recognized, and the potential benefits from its solution realized, industry would become seriously involved. Fabrica- tion chemists may ultimately solve the problem by developing a sub- stance which works like a one-way window. In cooperation with grav- ity when mixed into the surface soil it would let moisture move down- ward, but wouldn’t let it come back. In addition to increasing forage for livestock on our arid rangeland, such a substance would greatly enhance the value o,f arid lands throughout the world, and would increase manyfold their contribu- tion toward properly feeding the expanding world population.
Immediate Goals
Until some such revolutionary de- velopment, which may be one of the most significant scientific achieve- ments of the next 100 years, every presently known range improve- ment practice needs to be put to work. Of particular immediate im- portance are measures which restrict or prevent erosion, so that we do not further undermine the inherent productive capability of arid soils. Erosion control is good range man- agement. Brush control is good range management if there is an understory of grass or if grass can be established. Range seeding is good range management on potentially productive sites that cannot reason- ably be restored to productivity by methods short of seeding. Regu- lating grazing, both time and inten- sity, with the welfare of the forage plants in mind, as well as the live- stock, is good range management. Research has contributed greatly to our understanding of these and other good range management prac- tices, and will continue to enhance the productivity of our arid lands. The opportunity for improvement remains great. Much additional re- search is needed to lower the cost of range improvement practices and to increase the likelihood of their suc-
cess. For example with presently known methods we can control most brush and runoff-though if these processes were less expensive they would be greatly extended. By controlling brush and other un- wanted vegetation and runoff, we could more than double per-acre production without doing anything about loss of water by evaporation. In the future years, breeders will provide better forage plants and these will be introduced in range seeding programs. There is no reason to consider this potential any less than with corn, rice, wheat, sor- ghum and other major food crops. Up to now, the impact of plant breeding has hardly been felt on arid rangeland.
Long Range Goals An average acre of western range having some brush infestation, suf- fering also from average loss of water by runoff, produces, in round numbers, 1 to 2 lb. beef/100 tons precipitation received.2 Research has shown that as little as 6 lb. of grass will produce 1 lb. of beef. If 800 lb. of water will produce 1 lb. of grass, 100 tons precipitation/lb. or 2 of beef is an efficiency of only about 2.5 to 5%. (Bonner, 1961, points out that 2% is the approxi- mate efficiency with which plants utilize the energy of the sun-an- other fertile field for investigation.) Thus, in round numbers, and real- izing some assumptions have been made, we have the potential to in- crease the production of our arid rangeland as much as 20 to 40 times. We have already determined that the water provided, if all were used by the plants, would increase pro- duction eight-fold (from 400 to 3200 lb./acre). To reach a 20 to 40-fold increase would thus require an in- crease of two and a half to five times the efficiency with which the forage was utilized. This may be unrealis- tic in practice because
must eat yearlong, but
livestock since our
WATER
OR MAN
247
theoretical ideal was 6 lb. grass/lb. of gain, we may assume that at present, on the average, somewhere between two and a half and five times this amount, or 15 to1 30 lb. grass are consumed per lb. gain. Based on a need of 20 lb./day per animal unit, this would amount to % to 1% lb. g ain /day, yearlo#ng. This appears to be a reasonable spread. Hyder and Sneva (1963) and Sneva (1967) have shown that forage can be managed sol that live- stock use it more efficiently. Their studies are only a beginning.
With the potential productivity of the arid range conservatively placed at several times the present level, perhaps it is time to quit rationalizing that water is the limit- ing factor and turn the spotlight on man.
Literature Cited
ANDERSON, HENRY W., ALLAN J. WEST, ROBERT R. ZIEMER, AND FRANKLIN R. ADAMS. 1963. Evaporative loss from soil, native vegetation, and snow as affected by hexadecanol. Extract of Publ. No. 62 of the I.A. S.H. Comm. for Evaporation. p. 7-12.
BARNES, WILL C. 1926. The story of the range. 69th Congress, 1st Session, Part 6, Senate Hearings, Resolution 347. 60 p.
BENTLEY, H. L. 1898. Cattle ranges of the Southwest. U. S. Dep. Agr. Farmers Bull. No. 72. 32 p.
BONNER, JAMES. 1961. The biology of plant growth. Chapter 22, p. 239- 452, in growth in living systems. Proc. of an Int. Symp. on Growth
BRACKEN, A. F., AND P. V. CARDON. held at Purdue Univ., June 16-18,
1935. Relation of precipitation to moisture storage and crop yield. J. Amer. Sot. Agron. 27:8-20.
1960. Basic Books, Inc., New York.
BRIGGS, L. J., AND H. L. SHANTZ. Edited by M. X. Zarrow, et al.
1914. Relative water requirement of plants. J. Agr. Res. 3(l): 64 p. and 7 plates. BUFFINGTON, LEE C., AND CARLTON
H. HERBEL. 1965. Vegetational changes on a semidesert grassland range. Ecol. Monog. 35: 139-l 64. DILLMAN, ARTHUR C. 193 1. The water
requirement of certain crop plants and weeds in the northern Great Plains. J. Agr. Res. 42:187-238. EVENARI, M., L. SHANAN, N. TADMOR,
AND Y. AHARONI. 1961. Ancient agriculture in the Negev. Science 133(3457) : 979-996.
HYDER, D. N., AND FORREST A. SNEVA. 1963. Morphological and physio- logical factors affecting the grazing management of crested wheatgrass. Crop Sci. 3:267-271.
KELLER, WESLEY. 1954. Water re- quirement of Dactylis ,gZomeruta L. in the greenhouse -as influenced by I variations in technique and their in- teractions. Agron. J. 46:495499. LANGBEIN, WALTER B., ET AL. 1949.
Annual runoff in the United States. U. S. Dep. of the Interior, Geol. Surv. Circ. 52: 14 p. and map.
MATHEWS, 0. R., AND T. J. ARMY. 1960. Moisture storage on fallowed
wheatland in the Great Plains. Soil Sci. Sot. Amer. Proc. 24:414418.
MONSON, 0. W., AND J. R. QUESENBERRY. MCGINNIES, W. G., AND JOSEPH F.
1958. Putting flood waters to work on rangelands.
ARNOLD. 1939. Relative water re-
Montana Agr. Exp. Sta. Bull. 543. 39 p.
quirement of Arizona range plants. Univ. of Arizona, Agr. Exp. Sta. Tech. Bull. No. 80. 167-246.
OLSEN, S. R., F. S. WATANABE, F. E. CLARK, AND W. D. KEMPER. 1964. Effects of hexadecanol on evapora- tion of water from soil. Soil Sci. 97: 13-18.
PALTRIDGE, T. B. 1955. Sown pas- tures for southeastern Queensland. CSIRO. Melbourne, Australia, Bull. No. 274. 108 p. and 6 plates.
SELECT COMMITTEE ON NATIONAL WATER RESOURCES, U. S. SENATE. 1960. Water resources activities in the United States. Evapo-transpira- tion reduction. Committee Print No. 21, 86th Congress 2nd Session. 42 p.
SHANTZ, H. L., AND LYDIA N. PIEMEISEL. 1927. The water requirement of plants at Akron, Colorado. J. Agr. Res. 34: 1093-l 190.
SNEVA, FORREST A. 1967. Chemical curing of range grasses with paraquat. J. Range Manage. 20:389-394. UNITED STATES FOREST SERVICE. 1936.
The western range. 74th Congress, 2nd Session, Document 199. 619 p. VAN BABEL, C. H. M., L. J. FRITSCHEN,
AND R. J. REGINATO. 1963. Surface energy balance in arid lands agricul- ture 1960-61. U. S. Dep. Agr., Agr. Res. Ser. Prod. Rep. No. 76. 46 p.
SpeciaMs
in Qualify N AT I V E G
R
A S S E S
Wheatgrasses l Bluestems l Gramas l Switchgrasses l Lovegrasses l Buffalo l and Many Others We g-row, harvest, process these seeds Native Grasses Harvested in ten States
Your Inquiries
Costs and Returns in a Study of
Common Property Range Improvements1
JAMES R. SIMPSON2
Graduate Assistant, Department of Agriculturul Economics, University of Arizona, Tucson, Arizona.
Highlight
The clearing and reseeding of mesquite-covered alluvial flood plains on the Papago reservation in the southwestern United States to blue panic-grass was determined to be economically feasible. This improved range must, however, be used at full carrying capacity and livestock numbers restricted so the increased forage will be reflected as an increase in calves sold. A benefit-cost analyses was performed to determine what effect different methods of management would have on returns for a common property resource.
La Ventaja Economica de un Manejo Adecuado-un Estudio Sobre Los Costos e Inpesos en
Mejoramiento de Pastizales en Propiedad Comunal.
Resumen3
El estudio fud llevado a cabo en la reservacidn de 10s indios Papagos en el Estado de Arizona, E.U.A. En el pas- toreo comunal en esta reservacihn ha habido un sobrepastoreo que ha causado que 10s pastizales se encuentren en malas condiciones y de que haya baja producci6n de ganado y came.
Debido a que es dificil corregir el sobrepastoreo por razones sociales, 10s tbcnicos pensaron que seria mejor au- mentar el coeficiente de agostadero uti- lizando ciertas prhcticas tales coma con- trol de arbustos, siembras, bandas de dispersi6n de escurrimiento y construc- ci6n de facilidades tales coma aguajes, corrales y potreros.
Sin embargo, habia dudas si este m&odo era econ6mico o no. Se en- contr6 que 10s m&odos de mejorar el coeficiente de agostadero resultaban econ6micos solo con una carga animal adecuada. El sobrepastoreo a6n en 10s pastizales mejorados no era econ6mico y no cubri6 10s costos de1 mejoramiento.
The Papago Indian Reservation consists of arid valleys and plains
l Journal Paper No. 1657 of the Arizona Agricultural Experiment. Station. Based on Master’s Thesis, Department of Agricultural Economics, University of Arizona, Tucson, Arizona, 1968. 2 Present address is Research Assistant,
Department of Agricultural Econom- ics, Texas A and M University, Col- lege Station, Texas.
3 Por Sergio Chhzare L. y Donald L. HUSS, Organization de las Naciones Unidas para la Agricultura y la Ali- mentacion (FAO), Dep. de Zootecnia, ITESM, Monterrey, N.L., MCxico.
with high temperatures and low rainfall characteristic of the Sono- ran Desert Region. Drought and overgrazing have resulted in a range where annual plants provide much of the forage.
The Papago cattlemen have tradi- tionally derived their income from a cow-calf operation which is poorly suited to this type of range. This inflexible method of operating has resulted in periodic starvation con- ditions and a range that yearly be- comes more depleted. Private and Federal funds were solicited during the spring and early summer of
1969 to feed starving cattle.
To prevent resentment caused by forced reduction of cattle numbers, Bureau of Indian Affairs (BIA) range personnel have searched for a method to prevent seasonal starva- tion and weight losses, at the same time assisting conservation and re- juvenation of the denuded range land. Complementary pastures uti- lizing floodwater from the moun- tains to provide much needed pe- rennial grasses appears to be a partial answer (Simpson, 1968).
About 2,025 hectares (5000 acres) of mesquite-covered alluvial fans have been cleared and seeded on the reservation over the last five years. Although the improvements provide a striking contrast to the surrounding rang-eland, economi- cally they might not be paying for themselves, principally because of lack of proper management. (This is defined here as fullest pos- sible use to maximize profits over a
248
long term period.) In light of this situation, a feasibility study was initiated prior to developing the re- maining 10,125 hectares (25,000 acres) thought to be suitable. The method of benefit-cost was used as an indicator of potential returns under various pasture-management assumptions.
In this study, two systems of man- agement were considered, one which evaluates management training as- suming no restrictions on herd num- bers (Plan “A”), and one in which herd build up in response to addi- tional available forage is curtailed (Plan “B”). To compare the two plans, the benefits are divided by their respective costs to determine benefit-cost ratios.
Communal Grazing System Traditionalism, group rather than individual decision making, antiquated methods, little formal education, and a communal grazing system are the social constraints en- countered in evaluating the dollar return from pasture improvement. The name “communal grazing sys- tem” is employed because the land in and around each village is thought of as belonging to that community and is apportioned by the village or district council.
The majority of the Papago stock- men own only a few animals. Woodbury and Woodbury (1962) cite references which suggest that the largest Papago herd is over 1,000 head, that there are three herds of over 500 head, five of over
100 head, 36 herds of 10 to 99, and about 400 families have herds of 9 head or less. Because it is not gener- ally feasible for each owner to fence a portion of range for his own use (stocking rates are about 5 to 10 head per section) there are definite unwritten “property rights” which serve well, as long as they are fol- lowed.
COMMON PROPERTY ECONOMICS 249
would then use the extra forage available. Thus, to the individual Papago stockman, overgrazing is rational and may be expected to continue until curtailed by outside pressure. Although the communal grazing system is often criticized as the main contributor to overgrazing, it becomes apparent that what is needed is not a radical change to a new system but a more careful gov- erning of the common property re- source, i.e. land. The overuse of this common property resource (known as the commonality problem; other instances are groundwater basins and ocean fisheries) paradoxically has also been aggravated by BIA water development on the reserva- tion.
During the 1930’s an active cam- paign of building dirt water tanks and wells was carried out to “im- prove livestock distribution.” In the 1950’s an additional $l,OOO,OOO was spent. Lack of adequate regu- lation of stock numbers resulted in additional range which is over- grazed as cattle are better able to utilize the land area.
Methods for Estimating Range Improvement Cost and Production
The actual range development re- quires clearing the mesquite-covered alluvial bottomland by pushing the trees with the blade of a large crawler type tractor. In the same operation a “root knife” attached to the drawbar dislodges the roots, plowing the land. Because the trees are usually less than 3 m in height, they are left to rot and no further land preparation operations are re- quired. The area is then fenced, and corrals, water spreaders, and “charcos” (dirt tanks) are built. The cleared area is seeded by air- craft just prior to summer rains. Grazing is deferred for one year to allow fo,r stand establishment.
In the analysis of reservation po- tential, about 9,315 hectares (23,000 acres) were delineated on aerial photos as suitable for pasture de- velopment. Clearing cost calcula- tions were determined by plotting mesquite areas designated as heavy
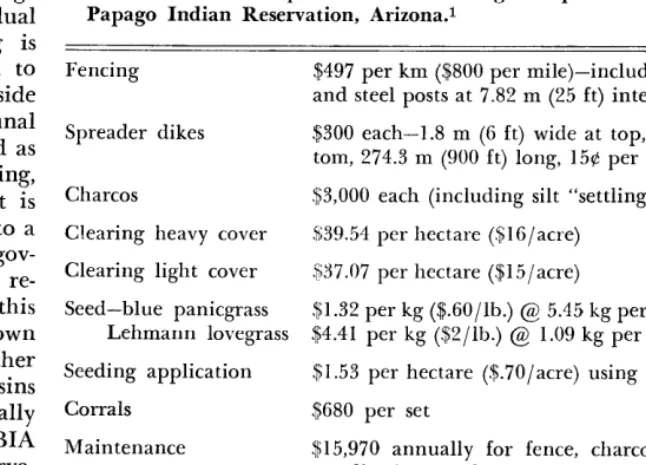
Table 1. Cost assumptions for renovating Papago Indian Reservation, Arizona.1
mesquite-covered alluvial fans,
Fencing
Spreader dikes
Charcos
Clearing heavy cover Clearing light cover Seed-blue panicgrass
Lehmann lovegrass Seeding application Corrals
Maintenance
$497 per km ($800 per mile)-includes 4 strands of wire and steel posts at 7.82 m (25 ft) intervals.
$300 each-l.8 m (6 ft) wide at top, 1.8 m wide at bot- tom, 274.3 m (900 ft) long, 15$ per m3 pushing charge.
$3,000 each (including silt “settling tank”)
$39.54 per hectare ($16/acre)
$37.07 per hectare ($15/acre)
$1.32 per kg ($.60/lb.) @ 5.45 kg per hectare (5 lb./acre) $4.41 per kg @Z/lb.) @ 1.09 kg per hectare (1 lb./acre)
$1.53 per hectare ($.70/ acre) using fixed wing aircraft.
$680 per set
$15,970 annually for fence, charco, dike, corral and erradicating woody growth using .36 kg (l/3 lb.) 2,4,5-T in a 1:7 mixture of diesel fuel and water once every 5 years of $1.23 per hectare ($.50/acre) per year.
1 1967 price.
or light cover. The mesquite densi- ties were easily recognized on the photos and, when combined with field checks, resulted in fairly accu- rate estimates of total clearing cost (Table 1). The aerial photos were also invaluable for estimating fenc- ing costs as well as determining the number of charcos, corrals, and spreaders needed.
Visual evaluation of reseeded species on a seven-year-old pasture indicated that blue panicgrass (Pun- icum antidotale) was dominant on well flooded areas (10.16 to 45.72 cm of water each flooding) and that Lehmann lolvegrass (Eragrastis Zeh- manniana) was best on areas of light inundation (less than 10.16 cm of water per inundation). The studies were done in November, at the end of the growing season but prior to grazing. Clippings from blue panic- cgrass plots, on what was judged to be maximum cover, yielded 4,360 kg per hectare (4,000 lb./acre) oven dry weight (O.D.W.). There seemed to be two very definite classes of cover. One class which averaged 75% of maximum blue panicgrass cover and which occurred on well flooded areas was designated as “heavy production.” This level, with a 70% use factor (average amount grazed of each plant) im-
plies a net yield of 2,290 kg of use- able O.D.W. forage per hectare (2100 lb./acre). The areas of light blue panicgrass production were estimated to be about 10% of maxi- mum cover which again with a 70% use factor, yields 305 kg of useable O.D.W. forage per hectare (280 lb./ acre). An average of 60 plots in areas sown to Lehmann lovegrass yielded 196 kg of useable O.D.W. per hectare (180 lb./acre) when com- puted at an 80% use factor.
250
SIMPSON
mother’s sides will consume what is considered to be a negligible quan- tity, but which in any event is more than offset by the “occasional use” of pastures for fattening weanling calves prior to1 shipment to market. From these assumptions, the areas of heavy production may be expected to provide 259.5 cow grazing days per hectare (105 cow days/acre), the areas of light blue panicgrass pro- duction 34.6 days (14 days/acre) and Lehmann lovegrass 22.2 days per hectare (9 days/acre). All potential pastures delineated on aerial photo- graphs could be expected to carry about 2,160 cows per year (reduced from 2,609 by a factor of about 83% to account for bulls and replace- ment heifers). It must be kept in mind, however, that the pastures are designed for use only four months a year rather than on a year long basis.
To compute returns, heifer calves were assumed to average 164 kg (364 lb.) each and sell at $.53/kg ($24/cwt) steer calves to average 175 kg (388 lb.) each and sell at $.57/kg ($26/cwt) and cull cows to average 360 kg (800 lb.) each and sell for $.33/kg ($15/cwt) (Dickerman and Martin, 1967). Reservation-wide, current average death loss is about 7% (Whitfield, 1967).
Plan “A”
In this case, which is typical of the present operation on the five established pastures, the pastures would be developed with no restric- tions placed on livestock numbers grazing on the open range. The pastures thus assume a supple- mentary rather than the intended complementary role. The stockmen could be expected to increase their herd size by some percentage of the full capacity of the pastures so that the open range would still be over- grazed and the calf crop could not be expected to, rise above the pres- ent 45%. Experience with the five experimental pastures also indicates that on an average, 60% of pasture potential (proper use) has been uti- lized. With a 70% use factor, this means that 42% of total forage
(.60 x .70) is consumed. If no man- agement training or restrictions were placed on the proposed pas- tures, annual direct benefits4 from the sale of cull cows and calves (less replacement heifers) would be $50,025. (Secondary benefits5 will be considered as negligible.) Total annual cost would be $85,570. This includes a 50-year period of analysis at 8% interest, $15,970 maintenance cost, $20,570 with interest at 8% on additional cows, minus $2,625 an- nual cost of corrals and charcos which could be allocated to other open range use. The benefit-cost ratio of .60: 1 indicates that $.40 is being lost on every dollar invested.
It is often asserted that adding management training in a situation such as this will reap large benefits. Hypothesizing that 90% of pasture potential could be obtained with guidance by a full time range con- servationist and a Papago counter- part fo’r a two-year period suggests direct benefits of $75,030 from the sale of calves and cull cows. This return assumes that calf crop does not change. Annual costs would be the same as before except that $2,630 must be added as an annual training program charge for a total of $88,200. (The training colst, al- though only for a two-year period, is spread over the 50-year time stream.) The benefit-cost ratio’ of .85:1 indicates that even though training is added there will be a negative net return when no restric- tions are placed on herd increase.
Plan “B”
In this plan, total reservation cow numbers will be assumed to{ remain constant by addition of growth re- strictions concomitant with pasture development which also gives a nearly 0,ptimal open range carrying
* Direct Benefits-The value of the im- mediate products or services resulting from the measures for which project costs and associated measures were in- curred.
5 Secondary Benefits-The value added over and above the value of the im- mediate products or services of the project as a result of activities stem- ming from or induced by the project.
capacity. Direct benefits would ac- crue in the form of reservation-wide increased calf crop and reduced death loss.
The benefits of Plan “B” must be calculated somewhat differently from Plan “A” where return to the pastures was computed as an annual return to added investment (cows). When cow numbers are assumed to be constant, a marginal basis, i.e. the added calf crop and reduced death loss of the cows which are grazed on these pastures, is the cor- rect procedure to be used. Utilizing the pastures four months of the year would provide 5,850 cows with for- age for four months (90% of proper utilizatioa). Critical to the analysis is the validity of counting all calves of the additional calf crop (25%) as being sold, whereas in Plan “A” the additional cows had to have replace- ment heifers deducted. Total bene- fit is $172,650 compared to a cost of $71,780 ($51,650 amortized invest- ment, $15,970 maintenance, and $4,160 management training). The ratio is 2.44:1. It is also probable that the rest of the cows on the open range (7,425 head), while not di- rectly utilizing the pastures, could also be expected to have an in- creased calf crop. It seems logical that the calf crop will be somewhat less than those cows, on proposed pastures however. Speculating a
15% increase (to a total of 60%) yields additional calves worth up to $150,000.
COMMON
PROPERTY
ECONOMICS
251
support to the conclusion that investment in pastures would be de- sirable under appropriate manage- men t conditions.
Summary and Conclusions Two alternative development plans for potential flood irrigated pasture were considered in light of special cultural problems affecting range utilization practices. A bene- fit-cost analysis was performed to determine what effect different methods of management had on returns for this common property range resource. In one plan (A), in which herd numbers were assumed to be unrestricted, the annual bene- fits were found to be less than an- nual costs, principally because of continued low expected calf crop. In the second plan (B), herd num- bers were assumed to be held con- stant so that calf crop could be ex- pected to increase, thus increasing returns. It was concluded that the investment would be desirable only under this latter plan. The positive ratios obtained indicate that the im- provements will yield a positive re- turn over costs. The conclusions are, however, valid only for an op- portunity cost of 8%. It should also be pointed out that the use of bene- fit-cost ratios is maximized when ratios are available for comparison between alternative investment projects.
The results of this analysis fur- ther suggest that unregulated com- mon property resources are special
cases. In this instance the reason is that calf crop, the all important factor for computing returns, is con- sistently low. This very definite management problem is aggravated by undisciplined group porlicy- making.
Experimental pasture production studies indicated the hardiness, via- bility and high yields of blue panic- grass. The fairly low cost of $2.16 for each animal unit month of grazing attests to the potential value of this grass in the southwest, given full utilization.
The method selected to compute the returns is, as has been demon- strated, also vital. It is not sufficient to state simply that calves are being sold, the question is, are additional cows to be bought for stocking the pastures or are predevelopment herd numbers to be maintained, i.e. are the pastures supplementary or complementary? The rule of thumb for the former is: compute benefits as an annual return to added invest- ment (cows). When pastures are complementary, however, so that numbers remain constant, the bene- fits are derived as additional calves, or as additional weight gains. It be- comes obvious that simple calcula- tion of forage yields will nolt suffice under questionable management situations and that this holds for individual owner as well as group owner situations. The critical meth- odology is that of actual pounds of beef sold, not optimal or “paper” computations.
Literature Cited
DICKERMAN, A. R., AND W. E. MARTIN. 1967. Organization, costs and re- turns for Arizona cattle ranches. Un- published File Reports 67-7, Dep. of Agr. Econ. The Univ. of Arizona, Tucson, Arizona.
GARDNER, B. D. 1962. Transfer re- strictions and misallocation in graz- ing public range. J. Farm Econ. 44: 50-63.
JEFFERIES, G. L. 1964. The marginal value of public grazing permits to Arizona ranchers. Unpublished Mas- ter’s Thesis, The Univ. of Arizona, Tucson, Arizona.
MORRISON, F. B. 1948. Feeds and feeding. Zlst Edition, The Morrison Publishing Co. Binghamston, New York.
SIMPSON, J. R. 1968. An economic evaluation of selected range improve- ment practices on the Papago Indian reservation. Unpublished Master’s Thesis, The Univ. of Arizona, Tucson, Arizona.
WHITFIELD, C. 1967. Personal inter- view, September 28, 1967.
WOODBURY, R., AND N. WOODBURY. 1962. A study of land use on the Papago Indian reservation, Arizona. Unpublished manuscript from the files of the Bureau of Ethnic Re- search, The Univ. of Arizona, Tucson, Arizona.
Longmont Seed Co.
We Buy & Sell Western Range Grass8 Legume Seeds
CONFRONT US with your RANGE PROBLEMS: phone: 303 + 776-1320
LONGMONT, COLORADO 80501
INSTITUTIONAL SUSTAINING MEMBERS
Sincere appreciation is due the following organizations for their support of the Society for Range Management for the membership year 1971.
State Bank & Trust Co. British Columbia Beef Cattle Growers’ Association
Why Some Cattlemen Overgraze-
and Some Don’t’
M. C. SHOOP AND E. H. McILVAIN
Range Scientist and Agronomist, Crops Research Division, Agricultural Research Service, U. S. Department of Agriculture, U. S. Southern
Great Plains Field Station, Woodward, Oklahoma.
Highlight.
Cattle can make high gains on over- grazed range for a few years-if they are fed enough hay, grain, or protein. The supplements mask the low and de- clining production of overgrazed range. This combination of overgrazing and extra supplements can be profitable until the plant and soil resources are badly damaged, or until a series of drouth years combined with low or dropping cattle prices “terminate” the business or put it on a subsistence level. Over the long term, moderate grazing ,is more profitable than overgrazing, and in the short term, is much more stable financially.
Por que Algunos Ganaderos Practican el Sobrepastoreo y
Otros No Resume&J
Los bovinos pueden producir mucho en pastizales sobrepastoreados si estan suplementados con bastante heno, grano o proteinas. Pero un bajo nivel de producci6n puede estar escondido por la suplementacibn. La combina- ci6n de sobrepastoreo y suplementaci6n puede ser aprovechable hasta que 10s recursos naturales tales corn0 las plantas y el suelo est&n dafiados seriamente o cuando hay una sequia combinada con precios bajos y que pueden perjudicar seriamente el negocio de la ganaderia. El pastoreo moderado es rn& aprovecha- ble que el sobrepastoreo si lo consid- eramos a large, plazo y se refleja en una situaci6n m&s estable en el corto plazo. Why do so’me ranchers continue to overgraze even though the dis- advantages of overgrazing have been
l Cooperative investigations of the Crops Research Division, Agricultural Research Service, U. S. Department of Agriculture, and the Oklahoma Agri- cultural Experiment Station, Still- water. Received July 30, 1970; ac- cepted for publication January 2, 197 1.
2 Por Sergio Chhzaro L. y Donald L. HUSS, Organization de las Naciones Unidas para la Agricultura y la Ali- mentacion (FAO), Dep. de Zootecnia, ITFSM, Monterrey, N.L., Mbxico.
well publicized for more than 30
years? We recently found one an- swer to this perplexing question while conducting an experiment which included overgrazing and moderate grazing with and without extra supplements (Shoop and McIlvain, 197 1).
In brief, steers given extra supple- ments while on a range overgrazed for 3 years gained 60 lb. per head annually more than steers on mod- erately grazed range that were given only standard supplements-but the overgrazed range was severely dam- aged! This and the results from our ZO-year stocking rate studies brought the answer into clear focus.
We have also observed that many ranchers whoI overgrazed feed con- siderably hay, grain, and protein supplements. They do this in spite of the fact that their neighbosrs who moderately graze produce highly ac- ceptable gains and profits merely by feeding a low level of protein (1 to 2 lb. of high-protein supplement per head/day).
Our purpose in writing this paper is to help cattlemen and range tech- nicians understand how feeding extra hay, grain, and protein masks the harmful effects of overgrazing: low forage production, 101~ “grass gains,” disastroas financial losses during drouths, and excessive ero- sion. Understanding this relation- ship will help them to analyze a ranch operation and, where appro- priate, to modify it to withstand several successive years of drouth and falling cattle prices.
Area and Cattle
The grazing studies were con- ducte:d on the Southern Plains Ex- perimental Range in northwestern Oklahoma near Woodward. The
252
average annual precipitation over 85 years is 23 inches, varying from 10 to 43 inches. About 1 year in 3 is a drouth year. Temperature ex- tremes have varied from -27 to 113F. Temperatures in January usually range from 10 to 50F, and in July from 65 to 105F.
The predominant soil type on the rolling, stabilized sand dunes is Pratt loamy fine sand. All of the soils have a single-grain structure that makes them highly susceptible to erosion when not protected by vegetation.
The native vegetation is domi- nated by an overstory of sand sage- brush (Artemisia filifolia Torr.) with an average canopy of 40%. The understory vegetation consists of a mixture of short, mid, and tall grasses, and a few forbs (Shoop and McIlvain, 1963). The annual pro- ductio,n of forage averages 1,050 lb. of dry matter per acre.
The steers used were high quality Herefords from a single ranch. They were received in October as calves directly off the co~ws, and were weaned and handled in a single herd until allotment. The cows were also high quality Here- fords from a single herd. Their average fall weight was about 1,100 lb. All cattle were allotted to treat- ments at random within weight classes and within conformation grades and condition scores.
Methods
SOME OVERGRAZE-SOME
DON’T
253
Overgrazing occurred on the heavily grazed pastures which were always stocked with about 50% more cattle than were the moder- ately grazed pastures. An average of 225 lb. of forage/acre was left on the heavily grazed pastures about April 20.
No additional roughages were fed during the experiments. All cattle were fed 41% protein cotton- seed pellets (cake) during winter at the rate of 1.5 lb./head daily, ex- cept to the steers in Study 1 that were fed additional supplements as a treatment. Salt was the only other supplement fed except those listed as treatments.
Prices used in economic analyses were market prices during 1967-69. Profit to1 labor and management is income left after all costs except labor are paid. Net profit is in- come left after all costs are paid.
Forage production was measured from 1953 through 1961. Measure- ments were made at the end of the growing season, about October 15, and at the end of the forage year, about April 20. Production was de- termined by the micro-unit forage inventory method and included all portions of grasses and forbs above ground level (Shoop and McIlvain,
1963).
Changes in vegetation were de- termined fro’m forage inventories and from line-intercept measure- ments of vegetation cover made at the beginning and end elf the experi- ments and periodically during inter- vening years (Parker and Savage,
1944).
Erosion was determined by criti- cally examining the pastures, and from photographs made periodi- cally on many permanent photo sites.
In the presentation of results, drouth years (1947, 1952-54, and 1956) were those in which precipita- tion was short enough for 2 or more months to’ drastically reduce yearly forage production below average. Nondrouth years were those in which forage production was not seriously reduced by lack of rainfall. Some years (1942, 1946, and 1957)
Table 1. Average gain of steers, economics, and range conditions on overgrazed and moderately grazed range with and without extra supplements, 1964-66.
Item
Overgrazed range Moderately grazed range Standard2 Ex tra2 Standard2 Extra2 supplement supplements supplement supplements Experimental procedure
Acres/steer (no.) 6
Total steers (no.) 72
Steer wt. Nov. 1 (lb.)1 456 Gain/steer (lb.)3
Winter 43 a
Summer 292 a
Yearlong 335 a
Economics ($)4
Selling price (/cwt) 28
Steer sales value Oct. 1 222 Steer cost Nov. 1 @ $33/cwt 150 Operating costs/steers 58 Total costs/ steer 208 Profit to labor & management
Per steer ($) 13
Per acre ($) 2.20
Range conditions, Oct. 1966
Plant vigor Low
Death loss of plants High
Soil erosion Medium
6 9 9
72 72 72
456 456 456
95 c 314 b 409 b
54 b 295 a 349 a
106d 319 b 425 b
27.50 28 27.50
238 225 242
150 150 150
72 67 81
222 217 231
16 8 11
2.70 .90 1.20
Low Medium Medium
High Low Low
Medium Low Low
l All weights shrunk 3%.
a Standard supplement was 1.5 lb. cake/steer daily during winter. Extra supplement was 3.0 lb. cake in winter, plus stilbestrol, plus cake in late summer.
s Means on a line followed by the same letter are not significantly different at 5% level by the Duncan multiple range test.
4 Economics based on 1967-69 prices.
6Costs include pasture $3/acre; drugs & vet. $1; salt & insecticides $1; cake $10; death & injury at 1.5% of sales value $3; buying, selling, trucking $6; taxes $1; interest $15; and miscellaneous $3. Labor is not included.
were not classified because they were not clearly drouth years.
Study 1, Extra Supplements The effect of giving extra supple- ments to steers on range was studied with three replications for 3 years as part of a larger grazing experi- ment (Shoop and McIlvain, 1971). Weaner Hereford steers were grazed yearlong on overgrazed and moder- ately grazed range, with and with- out extra supplements (four treat-
12-mg pellet per steer on November 1 and another on May 1). In com- parison, the steers that did not re- ceive the extra supplements received only the standard supplement of 1.5 lb. of cake/head daily.
All the pastures used were moder- ately grazed for at least 7 years be- fore the start of the experiment, and were very similar within each replication. The pastures had been sprayed for brush control and were stocked accordingly.
ments).
ceived a combination bf additional Steers given extra supplements re- winter cake (3.0 lb./steer daily as compared with 1.5 lb.), plus late- summer cake (1 lb./steer daily from July 20 through September), plus diethylstilbestrol (stilbestrol) (one
A stocking-rate study with steers Study 2, Stocking Rates with Steers
254
SHOOP
AND McILVAIN
(McIlvain and Shoop, 1965). The pastures were fenced to be quite uniform in topography, soil, and vegetation. All the pastures were severely depleted when the study started, and were deferred from grazing in 1940-41.
Study 3, Stocking Rates with Cows and Calves
Experimental procedure Acres/steer (no.) Years of data (no.) Total steers (no.) Steer wt. Nov. 1 (lb.)
6 9 6 9
12 12 5 5
285 285 100 100
446 446 427 427
Heavy, moderate, and light year- long grazing of native range with Hereford cows and calves were studied with two replications for 9 years, 1953-6 1. The pastures used had been grazed with stocker cattle at heavy, moderate, and light inten- sities for the previous 11 years. Only the first two treatments are discussed here (McIlvain and Shoop,
1962).
The cows were placed on the treatments as weaner calves and were not removed during the ex- periment. They were bred as year- lings to calve as Z-year-olds in 1953. Average date of calving was March
15.
Gain/steer (lb.) Winter Summer
Yearlong
57 70 46 81
292 304 212 257
349 374 258 338
Economics ($)2 Selling price / cwt Steer sales value Oct. 1 Calf buying price / cwt Calf cost Nov. 1
Operating costs per steer3 Total costs per steer
28 28 25 24.50
223 230 171 187
33 33 30 30
147 147 128 128
58 67 58 67
205 214 186 195
Profit to labor and management Per steer ($)
Per acre ($) 18 16
-15 -8
3.00 1.80 -2.50 -.90
Results
Study 1, Extra Supplements
Range conditions Forage: *
Production (lb./acre) Stubble after grazing
(lb./acre)
1260 Steers given the extra supple-
ments (cake + stilbestrol + late- summer cake) while pastured on overgrazed range made excellent gains. In fact, they gained only 16 lb. /head less than similarly treated steers on moderately grazed range. They also gained
74
and 60 lb. more, respectively, than steers on overgrazed and moderately grazed range that received only the stan- dard supplement, 1.5 lb. of cake (Table 1).280 Grazable forage,
(lb./acre) Grazable / steer
(lb. x acres) Death loss of plants Soil erosion
980
5900 Low High
Overgrazing combined with extra supplements was the most profit- able of the four systems of produc- ing steers during the 3 years of the study. It returned $.50 per acre more profit than overgrazing with standard supplements, $1.80 per acre more than moderate grazing without extra supplements, and $1.50 more than moderate grazing with extra supplements (Table 1).
1 Drouth years were 1947, 1952-54, and 1956. Data for 1942, 1946, and 1957 excluded. All weights shrunk 3%.
a Economics based on 1967-69 prices, with adjustments in buying and selling prices of steers to reflect prices during drouths.
3 Costs include pasture $S/acre; drugs & vet. $1; salt & insecticides $1; cake $10; death & injury at 1.5% of sales value $3; buying, selling, trucking $6; taxes $1; interest $15; and miscellaneous $3. Labor is not included.
4 Data for 1953-61.
However, overgrazing both with and without extra supplements greatly reduced the vigor of the range plants and killed many of
those growing on the least favorable sites and many of the taller grasses. Moderate-intensity drouths oc- curred during the growing seasons of the 3 years in which the study was conducted. Soil disturbance be- cause of grazing, trailing, rubbing, and fighting was much greater on the overgrazed pastures than on the moderately grazed pastures. Also, soil was moved more by wind and water (Tabde 1).
1310 530 810
430 90 130
880 440 680
7900 2600 6100
Trace High rvloderate
Trace High Low