Efficient Streaming Algorithm for Large Volume of Data
Sharmishta Desai1, Dr. S.T.Patil2 1
Sharmishta Desai, Research Student, Pune University, India 2
Dr.S.T.Patil, Professor, VIT, Pune
Abstract
The volume of data is growing rapidly due to the usage of social sites like twitter, facebook etc.This data can be customer information data or ATM logs or Credit card data or telecom logs or any twitter or facebook data. This massive data is useful for business analyst for getting feedback about any product or service. The use of machine learning algorithms for analyzing market data will add more knowledge into the knowledge of investor.Traditional machine learning algorithms like C4.5 or CART have a limitation of memory size because they store all data on memory for building a model. So,these algorithms arenot suitable for large volume of data. These algorithms performs best if the size of data is small but if size of data increases the same algorithms shows poor results. In this paper,we have used Hoeffding tree for large volume of data and proved with results that Hoeffding tree performs best against other Machine learning algorithms.To increase accuracy we have used different classifiers at leaft level. We have collected dataset from twitter social site. Different phases of social media data mining are also explained in detail.
Keywords: Decision Trees;Random Decision Trees;Heoffding Trees;Social Media Data
1.Introduction
As the popularity of social media is increasing, the volume of data generated through it is also increasing. Need of analysis of this large volume of data required to gain knowledge from this. The ability of extract and interpret the knowledge from high volume of data is important today. Different machine learning algorithms are available for doing analysis of data. These algorithms outperforms when the size of data set increases. So, there is need of algorithm which will analyze large volume of data quickly by consuming less memory. C4.5,CART, SVM are traditional machine learning algorithms which performs best if the size of data is small but if size of data increases the same algorithms shows poor results. We have used Hoeffding tree for large volume of data and showed that it performs better than other algorithms. In paper below, Section-II provides literature review. In Section III, proposed methodology is explained. Algorithms are explained in detail in section IV. Section-V gives information about twitter dataset and the method for extracting data. Section-VI gives experimental results.
2.Literature Review
maximize the outcomes of SMM through Word-of-Mouth (WOM) marketing by identifying the core group of users.
3. Research Methodology
As social media data is unstructured, it contains large amount of noisy data[9,2]. So for applying machine learning techniques accurately, our research proposal is using efficient pre-processing and cleaning.
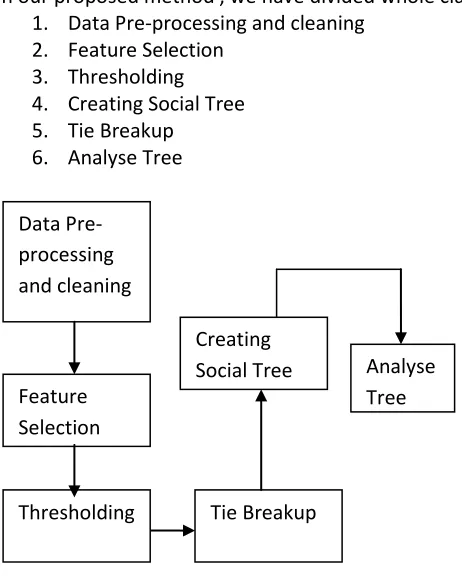
In our proposed method , we have divided whole classification process into different following parts. 1. Data Pre-processing and cleaning
2. Feature Selection 3. Thresholding 4. Creating Social Tree 5. Tie Breakup
6. Analyse Tree
Figure 1: Proposed Architecture for classification
A. Data Pre-processing and Cleaning
There are some missing attributes available. There are some users active for whole duration, while some users are active for small duration. This information is used for data clean-up.
Sometimes there are some unobserved links available. All this data is used for data cleaning so that it would not waste our training time.
B. Feature Selection
Proper selection and construction of features is a critical task. It affects the result of machine learning algorithm execution. Features are evaluated based on their information gain. If several features are representing same information then some other features are combined or some are deleted from this. Every feature is ranked according to its information gain. Features are selected in a subset. The number of attributes in one subset is defined by thresholding.
The thresholding method is explained below. Data
Pre-processing and cleaning
Feature Selection
Tie Breakup Creating
Social Tree Analyse Tree
C. Thresholding
Thresholding is required to limit features into subset. Thrsholding will set the number of features in a data set which are sufficient for finding information gain on that set.
D. Tie Breakup
There are some attributes for which there is no difference in information gain in two attributes. Such attributes are called as tie attributes. When such attributes occur then one out of two is selected.
E. Creating Social Tree
Convert the social media data into social graphs.
Pre-process raw data and social graphs so that they become suitable for applying ML algorithms Read social media data into leaf node
Calculate information gain on attributes
Select the attribute with highest gain using Hoeffding bound criteria Split the node and add two leaf nodes.
Repeat above steps till data remains.
System is proposed for analysing social media data using Decision tree algorithm. The algorithm is given below.
F. Decision Tree Algorithm
Decision tree is very useful classification and regression technique. Decision Trees are very flexible, easy to understand, and easy to debug. They will work with classification problems and regression problems [19]. So if you are trying to predict a categorical value like (red, green, up, down) or if you are trying to predict a continuous value like 2.9, 3.4 etc., decision Trees will handle both problems. one of the good things about Decision Trees is they only need a table of data and they will build a classifier directly from that data without needing any up front design work to take place. Decision tree algorithm as a whole is explained below [16].
Decision node: specifies a test on a single attribute Leaf node: indicates the value of the target attribute Arc/edge: split of one attribute
Path: a disjunction of test to make the final decision
Decision trees classify instances or examples by starting at the root of the tree and moving through it until a leaf node.
The tree can grow huge. These trees are hard to understand. Larger trees are typically less accurate than smaller trees.
Following measures are used for selection of an attribute to test at each node for classifying examples.
Information Gain-It measures how well a given attribute separates the training examples according to their target classification
This measure is used to select among the candidate attributes at each step while growing the tree Entropy-A measure of homogeneity of the set of examples. Given a set S of positive and negative examples of some target concept (a 2-class problem), the entropy of set S relative to this binary classification is
The entropy is 0 if the outcome is ``certain’’.
The entropy is maximum if we have no knowledge of the system (or any outcome is equally possible). Knowing the ``when’’ attribute values provides larger information gain than ``where’’.
Therefore the ``when’’ attribute should be chosen for testing prior to the ``where’’ attribute. Similarly, we can compute the information gain for other attributes.
At each node, choose the attribute with the largest information gain. Stopping rule
Every attribute has already been included along this path through the tree, or
The training examples associated with this leaf node all have the same target attribute value (i.e., their entropy is zero).
G. Hoeffding Trees
Decision tree algorithms outperforms when the data is in large volume or continuous stream because these algorithms store data on memory. So, Hoeffding trees are used to handle this data. Hoeffding trees are decision trees based on hoeffding bound concept. Hoeffding bound concept is used to delete the leaf nodes which are not active. So, the memory can be freed and used for other nodes.
The Hoeffding tree algorithm is given below. Algorithm HoeffdingTreeInduction(E, HT) Input: E is a training instance
Input: HT is the current state of the decision tree 1: Use HT to sort E into a leaf l
2: Update sufficient statistic in l
3: Increment the number of instances seen at l (which is nl)
4: if nl mod nmin = 0 and not all instances seen at l belong to the same class then 5: For each attribute, compute Gl(Xi)
6: Find Xa, which is the attribute with highest Gl
7: Find Xb, which is the attribute with second highest Gl 8: Compute Hoeffding bound £ =
9: if Xa ≠ Xband Gl(Xa)- Gl(Xb)> £ or £ < ζ then 10: Replace l with a split-node on Xa
11: for all branches of the split do
12: Add a new leaf with derived sufficient statistic from the split node 13: end for14: end if 15: end if
4. Social Network Datasets
There are many social network datasets are available like Brightkite,Gowalla,twitter etc. We have used twitter dataset for our experimental work because it is the one of the commonly used social site. Its information is given below.
Twitter:-
Twitter is a social news website. It can be viewed as a hybrid of email, instant messaging and SMS messaging all rolled into one neat and simple package. It's a new and easy way to discover the latest news related to subjects you care about.
our requirement like we want only specific product related comments, time data as well as location data.
5. EXPERIMENTAL RESULTS
Experimental results are generated using Weka 3.7.11 Java library and Eclipse Europa on Windows platform. The market dataset extracted from twitter is used for experimentation.For market data set decision tree, NaïvesBayes and SVM algorithms are evaluated.
Following steps are followed to extract twitter data.
1. Create a script having a unique id or twitter account to extract data.
2. Use twitter API to extract the tweets, the extracted tweets are the tweets of the current day. We can also narrow our search down to extract tweets related to a particular domain.
3. Once the data has been extracted, it is organized based on required functions in a database. 4. Social parameters tell us about the closeness between two users, i.e., user affinity and the influence of one user over other, i.e., user Influence. Social parameters are instantiated by creating a graph of social network and observing the interactions between nodes.
5. Location parameters are based on the current location of the user which is narrowed down by time zones and the places where the user checks-in.
6. Time parameters are just the regency of a mention.
7. Machine learning algorithm is executed on above created dataset. 11. Once the classification is achieved its trained offline as well as online.
12. The complete classification would be able to suggest mentions to a publisher for targeted advertising.
The result of different machine learning algorithms on market data is shown below. Table-I: Comparison of Different Machine Learning Algorithms Performance
Algorithm Name Correctly Classified Incorrectly Classified F-measure ROC Time in seconds
Decision Tree C4.5 2948 1679 0.496 0.499 0.03
Decision Tree CART 2948 1679 0.496 0.499 0.49
Random Forest 2948 1679 0.496 0.5 0.45
NaiveBayes 2948 1679 0.499 0.496 0.02
SVM 2948 1679 0.496 0.5 0.19
Hoeffding Tree 2962 1665 0.596 0.582 0.09
Figure 2: Comparison of Performance of ML Algorithms
In above graph we can observe Hoeffding tree classify data more accurately. In above we can see ROC and F-measure for Hoeffding Tree is greater than other algorithms. More is the ROC and F-measure, more accurate is the algorithm. Time required for Hoeffding Tree is less in comparison with other decision tree algorithm but it is more in comparison with NaiveBayes and SVM(Support Vector Machines).
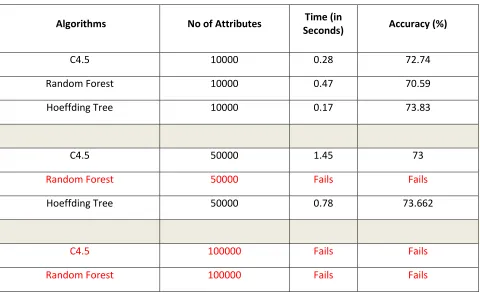
Next all decision tree algorithms are applied on large data set. It is shown in Table 1.These results show that C.4.5 works well till 50000 attributes. Hoeffding tree works well though number of attributes are beyond 50000.Though data increases, accuracy of hoeffding tree remains linear that is 74% while other algorithms fails due to their memory requirement.
Table 1: Comparison of Different Decision Tree Algorithms
Algorithms No of Attributes Time (in
Seconds) Accuracy (%)
C4.5 10000 0.28 72.74
Random Forest 10000 0.47 70.59
Hoeffding Tree 10000 0.17 73.83
C4.5 50000 1.45 73
Random Forest 50000 Fails Fails
Hoeffding Tree 50000 0.78 73.662
C4.5 100000 Fails Fails
Random Forest 100000 Fails Fails
0 0.1 0.2 0.3 0.4 0.5 0.6 0.7
F-measure
ROC
Hoeffding Tree 100000 1.56 73.9
C4.5 1000000(1GB) Fails Fails
Random Forest 1000000(1GB) Fails Fails
Hoeffding Tree 1000000(1GB) 74.78 74
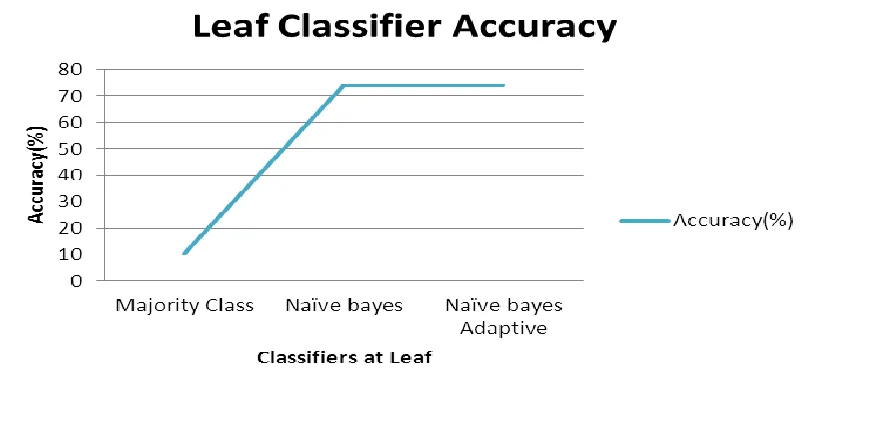
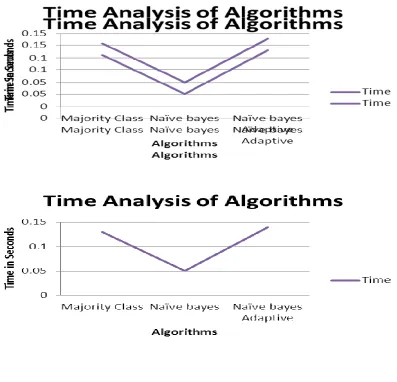
Accuracy of hoeffding tree is more improved by using different classifiers at leaf level. It is used to remove uneven classification at leaf. We have used Naïve Bayes,Adaptive Naïve Bayes and Majority class classifiers as leaf level.
It is shown in Table 2.
Table 2: Comparison of Classifiers Used at Leaf Level
Algorithms Used at leaf level
No of attributes
Correctly Classified
Incorrectly Classified
Time in
Seconds Accuracy(%)
Majority Class 10000 1050 8950 0.13 10.5
Naïve bayes 10000 7383 2617 0.05 73.83
Naïve bayes Adaptive 10000 7383 2617 0.14 73.83
Figure 3: Comparison of Accuracy of Leaf Classifier
Figure 4: Comparison of Learning Time of Leaf Classifier
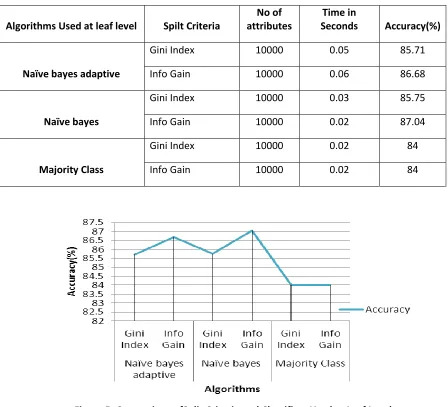
Table 3: Comparison of Split Criteria and Classifiers Used at Leaf Level
Algorithms Used at leaf level Spilt Criteria
No of attributes
Time in
Seconds Accuracy(%)
Naïve bayes adaptive
Gini Index 10000 0.05 85.71
Info Gain 10000 0.06 86.68
Naïve bayes
Gini Index 10000 0.03 85.75
Info Gain 10000 0.02 87.04
Majority Class
Gini Index 10000 0.02 84
Info Gain 10000 0.02 84
Figure 5: Comparison ofSplit Criteria and Classifiers Used at Leaf Level
6.Conclusion
References
1. Predicting Customer Behavious using Artificial Neural Network, BichenZheng,KeithThompson,SLam,Proceeding of 2013 Industrial and Systems Engineering Research conference,2013.
2. Will We Connect Again? Machine Learning for Link,Prediction in Mobile Social Networks, Ole J. Mengshoel, Raj Desai, Andrew Chen, Brian Tran, EleventhWorkshop on Mining and Learning with Graphs. Chicago, Illinois,USA 2013
3. Algorithm and approaches to handle large Data-A Survey, ChanchalYadav, Shuliang Wang , Manoj Kumar, IJCSN International Journal of Computer Science and Network, Vol 2, Issue 3, 2013
4. KapilBakshi, “Considerations for Big Data: Architecture and Approach”, IEEE, 2012 5. “Big Data for Development: Challenges and Opportunities”, Global Pulse, May 2012
6. M. Zaharia, M. Chowdhury, T. Das, A. Dave, J. Ma, M. McCauley, M. Franklin,S. Shenker, and I. Stoica, \Resilient Distributed Datasets: A Fault-Tolerant Abstraction for In-Memory Cluster Computing," in Proceedings of the 9th USENIX conference on Networked Systems Design and Implementation, pp. 2{2, 2012.
7. Bawa-Cavia, A., 2011, “Sensing the urban : Using Location –based Social Network Data in Urban Analysis,” Proc. of The First Workshop on Pervasive Urban Applications, June 12-15,San Francisco, California,1-7
8. Cho, E ,Myers, S.,and Leskovec,J.,2011, “Friendship and Mobility: User Movement in Location – based Social Networks ” Proc. of the 17th ACm SIGKDD International Conference on Knowledge Discovery and Data Mining , August 21-14,San Diego,California , 1082-1090,2011
9. Leveraging social media networks for classification, Lei Tang · Huan Liu, Data Min Knowl Discovery,2011
10. F. Ozgur CATAK, M. ErdalBALABAN,CloudSVM : Training an SVM Classifier in Cloud Computing Systems, Jan 2013
11. ConsensusW. Fan, H. Wang, P.S. Yu, and S. Ma, “Is Random Model Better? On Its Accuracy and Efficiency,” Proc. Third IEEE Int’l Conf. Data Mining (ICDM ’03), pp. 51-58, 2003.
12. The Turkish Lira ,Cyprus ,the implementation of a single NN to classify objects
13. Chi-Yuan Yeh, Wen-Pin Su, Shie-Jue Lee, Employing multiple-kernel support vector machines for counterfeit banknote recognition, Applied Soft Computing,2010
14. K.I. Kim, K. Jung, S.H. Park, H.J. Kim, Support vector machines for texture classification,IEEE Transactions on Pattern Analysis and Machine Intelligence 24(11) (2002) 1542–1550
16. SharmishtaDesai,Dr.S.T.Patil,”Differential Evolution Algorithm with Support Vector Machine to Classify Objects Efficiently”,IJARCSMS,Volume No2,Issue No.3 March 2014
17. SharmishtaDesai,Dr.S.T.Patil,“Automatic Detection And Classification Of Objects With Optimized Search Space”,IJARSE, Vol. No.3, Issue No.3, March 2014
18. Sharmishta Desai,AlabhyaFakaria,PrashantSaini,ShubhamSinha,”Analyzing Trends in Social Media Marketing”,IJCA,December 2014
19. Decision Tree Learning by Tom Mitchell
20. Locating targets through mention in Twitter by LiyangTang·ZhiweiNi·HuiXiong·Hengshu Zhu(2014)
21. Java, A., Song, X., Finin, T., Tseng, B. New York, NY, USA (2007)
22. Naaman, M., Boase, J., Lai, C.: Is it really about me?: message content in social awareness streams (2010)
23. Davidov, D., Tsur, O., Rappoport, A.: Enhanced sentiment learning using twitter hashtags and smileys (2010)
24. Hannon, J., Bennett, M., Smyth, B.: Recommending twitter users to follow using content and collabora- tive filtering approaches (2010)
25. Kwak, H., Lee, C., Park, H., Moon, S.: What is twitter, a social network or a news media? (2010) 26. Burton, S., Soboleva, A.: Interactive or reactive? marketing with twitter. J. Consum. Mark. 28(7),
491– 499 (2011)
27. Kim, Y.S.: Tran. V.: Selecting core target users for online social networking marketing with target marketing: A preliminary report (2011)