V+jets production at the CMS
Bugra Bilin1,a, on behalf of the CMS collaboration
1Middle East Technical University
Abstract. Measurements of Vector Boson production in association with jets are pre-sented, using p-p collision data at √s=7 TeV. The measurements presented include Z
+jets azimuthal correlations, event shapes, vector boson+jets differential cross section measurements, hard double-parton scattering using W+jets events and electroweak Z+ forward - backward jet production.
1 Introduction
Vector boson production is one of the best understood processes at hadron colliders. Events of W and Z bosons decaying into electrons and muons are among the cleanest experimental final states. Mea-surements of jet production associated with vector bosons provide a stringent test of perturbative QCD
(pQCD). These processes are sensitive to new physics effects, and are backgrounds for new physics
and Higgs boson searches. These measurements can also provide constraints on Parton Distribution
Functions (PDFs) and are used to improve the Monte Carlo generators. In this paper, various V+jets
measurements carried out by the CMS experiment [1] are summarised.
2 Z + jets azimuthal correlations and event shape measurement
Measurement of azimuthal correlations and event shapes of Z+jets process is carried out by the CMS
experiment [2]. The measurement is made in two phase space regions; inclusive (transverse
momen-tum, PT(Z) > 0 GeV) and boosted regimes (PT(Z) > 150 GeV). Boosted regime is of particular
interest since it is important for new physics searches.
Figure 1 and 2 show thePTdistribution of di-muon candidates and the jet multiplicity associated
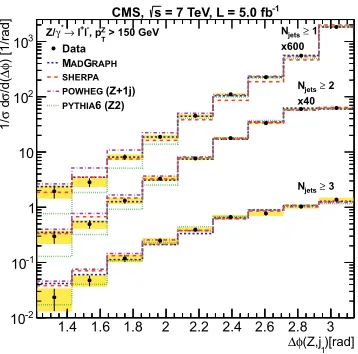
with these events respectively. In Figures 3 and 4, the azimuthal angle difference between the leading
jet and the Z boson are presented for inclusive and boosted regimes respectively. It is seen that the data is well described by the Monte Carlo.
3 Measurement of Z + 1 jet and photon + 1 jet rapidity distributions
Presence of the electroweak vertex makes the perturbative QCD calculations stable. Precise
mea-surement of the rapidity in Z+jet events is required for Higgs boson measurements. Measurement
of rapidities in events with a vector boson (γ, Z) and a jet is performed [3]. The measurement of
ae-mail: [email protected]
C
[GeV] μ μ
T
p 0 50 100 150 200 250 300 350 400
Events / 8.0 GeV
10 2 10 3 10 4 10 Data DY+jets t t EW -1
= 7 TeV, L = 5.0 fb s CMS, 1 ≥ jets N
0 50 100 150 200 250 300 350 400 Ratio data/MC 0.60.8
1 1.2 1.4
Figure 1. Detector level di-muon transverse mo-mentum, after detector efficiency corrections ap-plied.
jets
N 1
≥ ≥2 ≥3 ≥4 ≥5 ≥6 ≥7
Events / bin
1 10 2 10 3 10 4 10 5 10 Data DY+jets t t EW -1
= 7 TeV, L = 5.0 fb s
CMS,
> 50 GeV
T jet
p
1
≥ ≥2 ≥3 ≥4 ≥5 ≥6 ≥7
Ratio data/MC 0.60.8 1 1.2 1.4
Figure 2. Detector level exclusive jet multiplic-ity for the di-muon events, after detector efficiency corrections applied. )[rad] 1 (Z,j φ Δ
0 0.5 1 1.5 2 2.5 3
) [1/rad] φΔ /d( σ d σ 1/ -1 10 1 10 2 10 3 10 x300 1 ≥ jets N x10 2 ≥ jets N 3 ≥ jets N -1
= 7 TeV, L = 5.0 fb s
CMS,
> 0 GeV Z T , p -l + l → * γ Z/ Data RAPH G AD M SHERPA (Z+1j) POWHEG 6 (Z2) PYTHIA
Figure 3.Azimuthal angle difference between the Z boson and the leading jet in the inclusive 3 jet multiplicityΔφ(Z,j1) without any requirements on
PT(Z)
)[rad]
1
(Z,j φ Δ
1.4 1.6 1.8 2 2.2 2.4 2.6 2.8 3
) [1/rad] φΔ /d( σ d σ 1/ -2 10 -1 10 1 10 2 10 3 10 x600 1 ≥ jets N x40 2 ≥ jets N 3 ≥ jets N -1
= 7 TeV, L = 5.0 fb s
CMS,
> 150 GeV Z T , p -l + l → * γ Z/ Data RAPH G AD M SHERPA (Z+1j) POWHEG 6 (Z2) PYTHIA
/dy
σ
d
σ
1/
0.00 0.05 0.10 0.15
Z + 1 jet CMS Data
SHERPA (NLO PDF) MADGRAPH (NLO PDF) MCFM (NLO)
-1
= 7 TeV, L = 5 fb s
CMS, (a)
|
Z
|y
0.0 0.5 1.0 1.5 2.0
Ratio to MCFM
0.8 0.9 1.0 1.1 1.2
SHERPA with stat. uncert. MADGRAPH with stat. uncert. MADGRAPH (LO PDF)
uncert.
F
μ
and
R
μ
MCFM
MCFM PDF uncert.
Figure 5.Absolute value of Z boson rapidity, nor-malised to the total cross section. Data is shown after efficiency corrections. Statistical and system-atic uncertainties are added in quadrature.
/dy
σ
d
σ
1/
0.00 0.05 0.10
Z + 1 jet CMS Data
SHERPA (NLO PDF) MADGRAPH (NLO PDF) MCFM (NLO)
-1
= 7 TeV, L = 5 fb s
CMS, (b)
|
jet
|y
0.0 0.5 1.0 1.5 2.0
Ratio to MCFM
0.8 0.9 1.0 1.1 1.2
SHERPA with stat. uncert. MADGRAPH with stat. uncert. MADGRAPH (LO PDF)
uncert.
F
μ
and
R
μ
MCFM
MCFM PDF uncert.
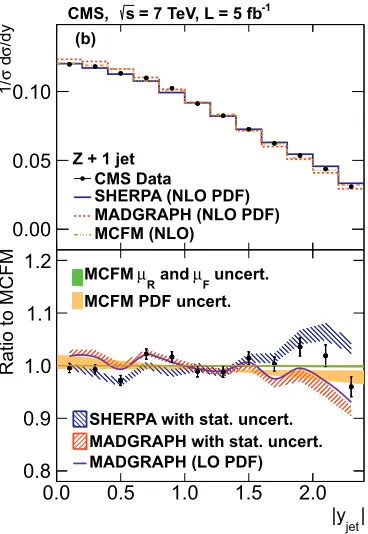
Figure 6. Absolute value of the jet rapidity, nor-malised to the total cross section. Data is shown after efficiency corrections. Statistical and system-atic uncertainties added in quadrature.
vector boson and the jet rapidities, the rapidity difference (ydi f =|yV−yjet|/2), and the rapidity sum
(ysum = |yV +yjet|/2) is carried out. Hereysumis related to the boost from laboratory frame to the
centre of mass frame of the V+jet system. The quantitiesysumandydi f f are uncorrelated observables,
whereasyZandyjet are highly correlated. The rapidity sum,ysumis mainly dependent on the PDFs,
whereasydi f f is sensitive to Leading Order (LO) partonic differential cross sections. Figures 5 - 6
showyZandyjet distributions for Z+jet events.
Vector boson and jet rapidity distributions are shown to be consistent with the perturbative QCD
predictions, whileysumandydi f fdistributions show discrepancies between QCD predictions and data.
The calculations at the Next to Leading Order (NLO) QCD, and simulations using two different Matrix
Element to Parton Shower matching methods fail to describe data and are inconsistent among each other.
4 Photon+jets differential cross section measurement
Measurements of photon production with one or more jets (γ+jets) provide a stringent test of pQCD.
The production cross sections ofγ+jets for various angular configurations are strongly dependent on
(GeV) γ
T p
40 50 60 70 80 102 2×10² 3×10²
(pb/GeV) jetη d γη d γ T /dp σ 3d -3 10 -2 10 -1 10 1 10 2 10 3 10 4 10 5 10 6 10 7 10
| < 1.5
jet η
|
-1
CMS L = 2.14 fb = 7 TeV s
JETPHOX SHERPA
| < 0.9 (X8000)
γ
η |
| < 1.4442 (X400)
γ
η 0.9 < |
| < 2.1 (X20)
γ
η 1.566 < |
| < 2.5
γ
η 2.1 < |
Total uncertainty
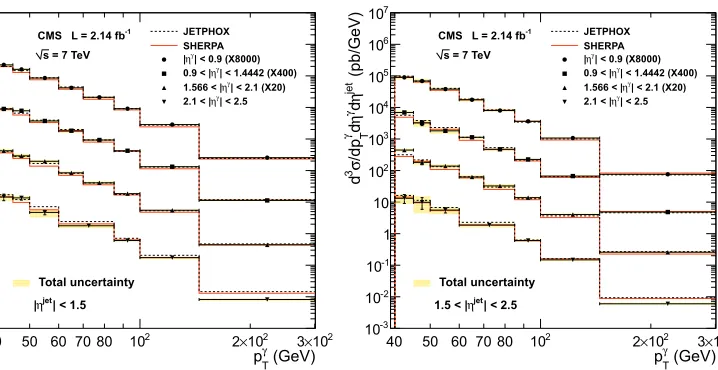
Figure 7. Cross-sections for |η| < 1.5. Error bars are statistical uncertainties and yellow bands are the total uncertainties obtained by adding in quadrature statistical and systematic uncertainties.
(GeV) γ
T p
40 50 60 70 80 102 2×10² 3×10²
(pb/GeV) jet η d γ η d γ T /dp σ 3 d -3 10 -2 10 -1 10 1 10 2 10 3 10 4 10 5 10 6 10 7 10
| < 2.5
jet η
1.5 < |
-1
CMS L = 2.14 fb = 7 TeV s
JETPHOX SHERPA
| < 0.9 (X8000)
γ
η |
| < 1.4442 (X400)
γ
η 0.9 < |
| < 2.1 (X20)
γ
η 1.566 < |
| < 2.5
γ
η 2.1 < |
Total uncertainty
Figure 8. Cross-sections for 1.5<|η|<2.5. Error bars are statistical uncertainties and yellow bands are the total uncertainties obtained by adding in quadrature statistical and systematic uncertainties.
the proton, hence may provide constraints on the PDFs. These measurements provide tests of fixed order pQCD calculations in a wide range of kinematic phase space.
Triple differential cross section ofγ+jet processes,d3σ/dpγ
Tdηγdηjet, is measured [4] as well as
ratios of the cross sections with respect to different jet-photon orientations are measured, where some
of the main uncertainties cancel. The cross section distributions are displayed in Figures 7 and 8. The results show that the NLO predictions describes the data well, whereas LO predictions underestimate the data.
5 Di-jet mass spectrum measurement in W + 2 jets
CDF Collaboration reported an excess in invariant mass (MJJ) constructed from the two highest
trans-verse momentum jets in events with W boson and two jets in the mass range 120 - 160 GeV [5]. The cross section of excess is determined to be 4 pb. A similar search is carried out by the D0 collaboration and an upper limit of 1.9 pb is set on the cross section at 95 % CL [6]. An updated analysis is reported by the CDF collaboration [7] using full statistics available. With improved calibrations of the detec-tor response and a better understanding of the instrumental backgrounds, the standard measurements were found to be in agreement with the standard model monte carlo predictions.
Motivated by the former "CDF bump", search for a di-jet resonance is carried out in W+jet events
by CMS for W+2 jet and 3 jet final states [8]. The contributions of standard model processes to di-jet
invariant mass is determined using an unbinned maximum-likelihood fit in the invariant mass range
40 - 400 GeV, excluding the signal region, 123 - 186 GeV. The difference of data from the fit, divided
Figure 9. Pull distribution ([data - fit]/fit uncertainty) vs. Mj j. The dashed line represent the searched signal region which is excluded from the fits.
6 Measurement of double parton scattering in W+jets
Small momentum fractions (x) carried by the incoming partons are accesible via proton-proton colli-sions at the LHC energies. The large number of partons having small momentum fractions increase the probability of two parton-parton scattering occuring at the same time and producing 2 identifiable hard scattering in proton-proton interactions. Double Parton Scattering (DPS) studies might provide information on spatial structure of hadrons, and provide improved understanding of backgrounds to new physics and higgs boson searches.
DPS is investigated in events with leptonically decaying W boson and 2 jet final states [9]. DPS
events differ from the Single Parton Scattering (SPS) events due to the fact that the di-jet system
from one parton interaction is independent from the W coming from the other parton interaction. In
this study, variables sensitive to discriminate DPS from SPS events; the azimuthal angle difference
between jets (Δφ(j1,j2)), the ratio of the magnitude of vectorial sum of the pT of jets to the scalar
sum ofpTof jets (ΔrelpT), and the azimuthal angle between W and dijet system (ΔS) are measured.
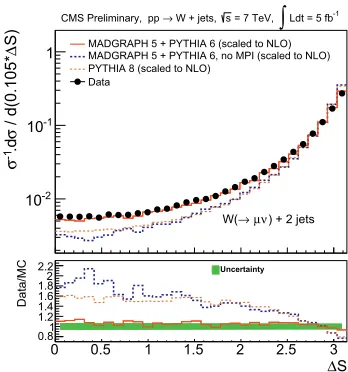
In Figures 10 and 11, fully corrected differential cross sections are shown for theΔS variable for
events with exactly two jets accompanying the W boson. Monte Carlo predictions including DPS simulation describe the data well, whereas the simulations without DPS fails to describe the cross section and the shape of the distribution. This study is the first step towards extracting the underlying DPS fraction at LHC energies.
7 Electroweak Z + forward-backward jets production measurement
Pure electroweak production of W and Z bosons with two well separated jets is quite sizeable at the LHC [10]. Study of these process is important especially for Higgs production from Vector Boson Fusion. Measurements of the pure electroweak production of Z boson with two forward backward
S
Δ
0 0.5 1 1.5 2 2.5 3
Data/MC
0.5 1 1.5 2
2.5 Uncertainty
S) [pb]
Δ
/ d(0.105*
σ
d
-1
10 1 10
2
10 MADGRAPH 5 + PYTHIA 6 (scaled to NLO) MADGRAPH 5 + PYTHIA 6, no MPI (scaled to NLO) PYTHIA 8 (scaled to NLO)
Data
-1 Ldt = 5 fb
∫
= 7 TeV, s W + jets,→
CMS Preliminary, pp
) + 2 jets ν μ → W(
Figure 10. Fully-corrected differential cross sec-tions forΔS.
S
Δ
0 0.5 1 1.5 2 2.5 3
Data/MC
0.81 1.2 1.4 1.6 1.82
2.2 Uncertainty
S)
Δ
/ d(0.105*
σ
.d
-1
σ
-2
10
-1
10
1 MADGRAPH 5 + PYTHIA 6 (scaled to NLO)MADGRAPH 5 + PYTHIA 6, no MPI (scaled to NLO) PYTHIA 8 (scaled to NLO)
Data
-1 Ldt = 5 fb
∫
= 7 TeV, s W + jets,→
CMS Preliminary, pp
) + 2 jets ν μ → W(
Figure 11. Fully-corrected differential cross sec-tions forΔS, normalised to the total cross section.
background, two different methods have been carried out. Firstly, the signal is extracted from a fit to
themj1j2 distribution. As a cross check, a multivariate analysis technique is used, where a boosted
decision tree with decorrelation (BDTD) is trained using various observables. The signal is hence
confirmed by two different approaches. The cross section is measured asσ = 154±24(stat.) ±46
(exp. syst.)±27 (th. syst.) ±3 (lum.) fb, which is consistent with the theoretical prediction at NLO,
166 fb.
8 Conclusions
Measurements of various V+jet processes with CMS detector are presented in this paper. These
mea-surements provide a detailed description of the topological structure of V+jets events. The
measure-ments test the validity of QCD, and provide confidence for existing Monte Carlo models in describing standard model processes.
Some other important V+jet measurements are carried out by CMS experiment which are not
cov-ered in the talk, such as Heavy Flavour production with Vector bosons (V+HF) [11–14] that provide
constraints to the heavy quark PDFs.
In all measurements, good agreement is observed between data and standard model Monte Carlo predictions.
References
[1] Chatrchyan, S. et al. (CMS Collaboration),JINST3S08004 (2008)
[2] Chatrchyan, S. et al. (CMS Collaboration), Phys. Lett. B722, 238-261 (2013).
[3] Chatrchyan, S. et al. (CMS Collaboration), arXiv:1310.3082 (2013). [4] Chatrchyan, S. et al. (CMS Collaboration), arXiv:1311.6141 (2013).
[6] V. M. Abazov et al. (D0 Collaboration), Phys. Rev. Lett.107, 011804 (2011).
[7] T. Aaltonen et al. (CDF Collaboration), http://www-cdf.fnal.gov/physics/new/hdg/Results_files
/results/w2jet_130222/DijetMassSpectra.pdf (2013)
[8] Chatrchyan, S. et al. (CMS Collaboration), Phys. Rev. Lett.109, 251801 (2012).
[9] Chatrchyan, S. et al. (CMS Collaboration), CMS-PAS-FSQ-12-022 (2012).
[10] Chatrchyan, S. et al. (CMS Collaboration), J. High Energy Phys.10, 101 (2013).
[11] Chatrchyan, S. et al. (CMS Collaboration), J. High Energy Phys.06, 126 (2012)
[12] Chatrchyan, S. et al. (CMS Collaboration),CMS-PAS-SMP-12-026 (2012) [13] Chatrchyan, S. et al. (CMS Collaboration), arXiv:1310.1138 (2013)
![Figure 9. Pull distribution ([data - fit] / fit uncertainty) vs. M jj. The dashed line represent the searched signalregion which is excluded from the fits.](https://thumb-us.123doks.com/thumbv2/123dok_us/8198339.1369373/5.482.142.336.83.271/figure-distribution-uncertainty-dashed-represent-searched-signalregion-excluded.webp)