First
π
K
atom lifetime measurement and recent results from the
DIRAC experiment
Mikhail Zhabitsky1,afor the DIRAC Collaboration
1Joint Institute for Nuclear Research, Joliot-Curie 6, 141980 Dubna, Russia
Abstract.We report evidence forπKatoms production, using 24 GeV/cproton beam from CERN PS interacting with a thin Ni target. We have identified (178±49)πKpairs, which were produced in a bound state —πK atom, which was subsequently broken-up (ionized) in the Ni target. Our analysis yields a first measurement of theπK atom lifetime2.5+3.0
−1.8
fs [1]. This lifetime is connected in a model-independent way to the S-wave isospin-oddπKscattering length|a−0| =
1
3|a1/2−a3/2| =
0.11+0.09 −0.04
M−1
π (aI for isospinI).
1 Introduction
Low-energy QCD and specifically Chiral Perturbation Theory (ChPT) [2] predictππandπKscattering lengths with high precision [3, 4]. For processes involvingu- andd-quarks theoretical predictions have been experimentally checked byπ+π− atom lifetime measurement [5] and by analysis of K -decays [6, 7]. Detection and lifetime measurement ofπK atom cast a look into processes which involves-quark as well.
AπK(πKatom) is an exotic atom — a hydrogen-like bound system of oppositely chargedπandK
mesons. Its ground state binding energy is 2.9 keV, Bohr radiusaB=249 fm and Bohr momentum is
0.79 MeV/c. Lifetime ofπK atoms is limited by strong interaction through the decay into a pair of neutral pion and kaon,π0K0orπ0K0, other decay channels contribution is of the order 10−3. TheA
πK
decay widthΓπK in the ground state (1S) is directly related to the S-wave isospin-oddπKscattering
lengtha−0 =1
3(a1/2−a3/2)[8, 9]:
ΓπK =
1
τ Γ
AπK→π0K0orπ0K0
=8α3μ2p∗(a0−)2(1+δK). (1)
Hereτis the lifetime in the ground state,aIis the scattering length for isospinI,αis the fine structure
constant,μis the reduced mass ofπ±K∓ pair, p∗ is the outgoingπ0 momentum in the atomic rest frame, andδKsummarizes corrections due to isospin breaking.
Inserting in (1) the valueMπa−0 =0.090±0.005 calculated with the dispersion analysis [10] and usingδK=0.040±0.022 [9] predicts theπKatom lifetime
τ=(3.5±0.4)·10−15s. (2)
DIRAC experiment aims to measure theπKatom lifetime, thus checking the ChPT prediction. ae-mail: [email protected]
DOI: 10.1051/
C
Owned by the authors, published by EDP Sciences, 2014
/201
2 Experimental method
The method ofAπKlifetime measurement [11] used by DIRAC experiment is as follows.AπKoriginate
from collisions of 24 GeV/cprotons with Ni atoms. Atoms are produced in nS-states, depending on the principal quantum number asn−3[11]:
dσA
dpA =
(2π)3EA MA
d2σ0
s
dpKdpπ pK
MK≈Mpππ
· |ψn(0)|2 =(2π)3EA
MA
1
πa3
Bn3
d2σ0
s
dpKdpπ pK
MK≈Mpππ
, (3)
wherepA,EAandMAare the momentum, total energy and mass of theπKatom in the laboratory
sys-tem, respectively, andpKandpπthe momenta of the charged kaon and pion with equal velocities. The
inclusive production cross section from short-lived sources without final state interaction is denoted asσ0
s,ψ(0) stands for the atomic wave function at the origin.
On a similar way, freeπ±K∓pair production from short-lived sources is enhanced by a Gamow-Sommerfeld-Sakharov factor [12] as a function of their relative momentumq:
d2σ
C
dpKdpπ =
d2σ0
s
dpKdpπ
4πμα/q
1−exp (−4πμα/q). (4)
Thus the total numberNA of produced atoms is proportional to the number NC of Coulomb pairs
generated with small relative momentum:
NA=k(q0)NC(qq0). (5)
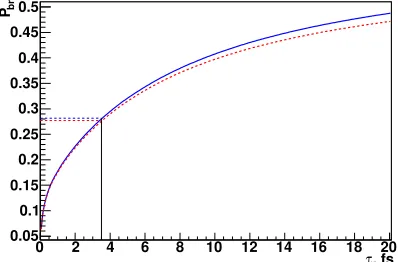
While crossing the target,πK atoms can be excited or even ionized (break-up) due to Coulomb interaction with target atoms. Pairs ofπ±K∓mesons fromπKatom break-up, called atomic pairs later in the text, are characterized by low relative momentaqin their center of mass system. Thanks to their distinct shape, atomic pairs can be revealed in a reconstructedQdistribution (Qstands for exper-imental relative momentum) by an experiment with sufficiently high momentum resolution. Thus a numbernAof atomic pairs can be identified from the experimentalQ-spectra over background of free πKpairs. Ionization ofπKatoms in the target is in competition with their annihilation. Therefore the probabilityPbr=nA/NAofAπKionization in the target is a unique function of its lifetimeτ, which is
calculated with sufficient precision [13, 14] (Fig. 1).
, fs τ
0 2 4 6 8 10 12 14 16 18 20
br
P
0.05 0.1 0.15 0.2 0.25 0.3 0.35 0.4 0.45 0.5
Figure 1.Probability ofAπKionization as a function of the ground state lifetimeτcalculated for Ni targets of thickness 98μm (dashed red line) and 108μm (solid blue line). The theoretically predicted lifetimeτ(Eq. 2) corresponds toPbr=0.28.
3 Experimental setup
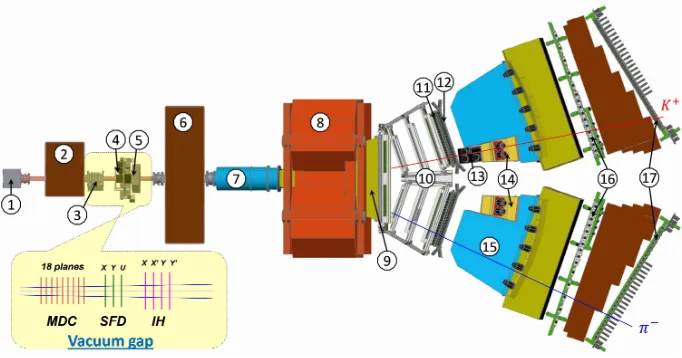
The DIRAC Collaboration constructed the double arm magnetic spectrometer which is optimized to detect and identifyπ+π−,π+K−andπ−K+pairs with small relative momenta Q. The sketch of the apparatus is shown on Fig. 2.
Figure 2.General view of the DIRAC setup: 1 — target station; 2 — first shielding; 3 — microdrift chambers; 4 — scintillating fiber detector; 5 — ionisation hodoscope; 6 — second shielding; 7 — vacuum channel; 8 — spectrometer magnet; 9 — vacuum chamber; 10 — drift chambers; 11 — vertical hodoscope; 12 — horizontal hodoscope; 13 — aerogel Cherenkov; 14 — heavy gas Cherenkov; 15 — nitrogen Cherenkov; 16 — preshower; 17 — muon detector.
The experiment uses a 24 GeV/cprimary proton beam from the CERN PS. Protons are directed onto a pure Ni thin foil with a radiation thickness of∼7·10−3X0. The DIRAC apparatus with its secondary channel is inclined by 5.7◦with respect to the primary proton beam. Tracking detectors are positioned in two groups: between the target station and the spectrometer magnet (BL=2.2 T·m), and downstream the magnet. The resolution of the setup on components of pair relative momenta in c.m.s.
σQx ≈σQy ≈ 0.2 MeV/candσQL ≈0.85 MeV/cis comparable toAπK Bohr momentum. Particle identification (e/μ/π/K/p) is performed through a combination of time-of-flight technique, threshold Cherenkov detectors and muon veto.
4 Experimental results
The data sample was collected on two Ni targets with thickness (98±1)μm in 2008 and (108± 1)μm in 2009 and 2010. Events containingπ±K∓pairs with low relative momentaQin their centre-of-mass system were selected. Then the reconstructed 2-dimensional (QT,QL) distribution ofπK
pairs was fitted by a sum of simulated distributions of atomic, Coulomb and non-Coulomb pairs with abundances of each component as free fit parameters. HereQL corresponds to a component
of the relative momentum parallel to the direction of pair total momentum, whileQT comprises the
transverse component. In the lowQLregion (Fig. 3), where atomic pairs are expected, there is an
0 50 100 150 200 250 300 350 400
0 2 4 6 8 10 12 14
Atomic pairs
Coulomb pairs
non-Coulomb pairs
-20 0 20 40 60 80
0 2 4 6 8 10 12 14
NA=465.±37.
nA=96.±41. PBr=0.207±0.101
|QL| [MeV/c]
0 20 40 60 80 100 120 140 160 180
0 2 4 6 8 10 12 14
Atomic pairs
Coulomb pairs
non-Coulomb pairs
-10 0 10 20 30 40 50 60
0 2 4 6 8 10 12 14
NA=188.±21.
nA=82.±26.
PBr=0.44±0.18
|QL| [MeV/c]
Figure 3.Experimental distributions on|QL|forπ−K+(left) andπ+K−pairs (right). Top: experimental|QL| distri-bution (crosses) is fitted by the sum of simulated distridistri-butions of atomic (red), Coulomb (blue) and non-Coulomb pairs (pink). The sum of free pair (Coulomb and non-Coulomb) distributions is shown by solid black line. Bot-tom: the difference between experimental and free pair distributions is compared to simulated distribution for atomic pairs.
Table 1.Experimental results for number of produced atomsNA, number of observed atomic pairsnAand probability of break-upPbrreconstructed by (QT,QL)-analysis from collected data.
Year NA nA Pbr
π−K+from (Q
T,QL)-analysis
2008 132±16 14±19 0.11±0.15 2009 169±24 33±26 0.20±0.17 2010 164±23 49±26 0.30±0.19
All 465±37 96±41
π+K−from (Q
T,QL)-analysis
2008 51±11 21±13 0.41±0.33 2009 78±13 26±16 0.34±0.24 2010 60±12 35±16 0.58±0.36
All 188±21 82±26
Table 1. In total, the number of reconstructed atomic pairs of both charge combinations amounts to nA(π−K++π+K−)=178±49.
The lifetime dependencePbr,i(τ) for each periodiof data taking was calculated, which takes into
account the target thickness and experimental spectrum onπ+K−orπ−K+laboratory momenta. The maximum likelihood method has been applied
, fs
τ
0 1 2 3 4 5 6 7 8 9 10 0
0.2 0.4 0.6 0.8 1
CL=0.68
CL=0.90
π
m
-0
a 0.06 0.08 0.1 0.12 0.14 0.16 0.18 0.2 0.22
, fs
τ
0 2 4 6 8 10 12
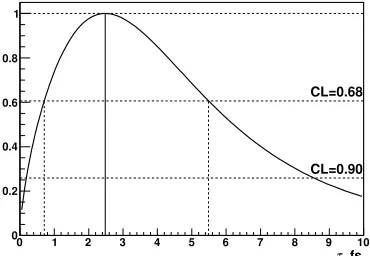
Figure 4.Likelihood function forAπKlifetime estima-tion based on both charged combinaestima-tionsπ+K− and π−K+and all data periods combined, systematic un-certainties are included.
Figure 5. Dependence ofAπK lifetime in the ground stateτonπKscattering lengtha−0. Experimental result (red) is compared to theoretical prediction (blue).
whereUi = Πi−Pbr,i(τ) is a vector of differences between measuredΠi(Pbrin Table 1) and theo-retical breakup probabilityPbr,i(τ) for data samplei. The error matrixGincludes both statistical and
systematic uncertainties [16]. The combined likelihood functionL(τ) for both charge combinations is shown on Fig. 4. Its maximum yields the following estimation ofπKatom lifetime in the ground state:
τ=2.5−+31..08stat+−00..31 syst
fs=2.5−+31..08totfs. (7)
The estimated ground state lifetime (7) corresponds to theπKscattering length (1)
a−0Mπ= 1
3a1/2−a3/2Mπ=0.11 +0.09
−0.04, (8)
to be compared with the theoretical predictions (Eq. 2, Fig. 5).
5 Conclusions
The analysis ofπK data collected by DIRAC experiment in 2008–2010 leads to the observation of nA(π−K++π+K−)=178±49 (3.6 sigma) characteristic atomic pairs of both charge combinations. The
probability ofAπKionization (break-up) has been measured. Combined with the known dependence of
break-up probability on atom lifetime, this results in a first measurement of theπKatom lifetime in the ground stateτ=2.5+3.0
−1.8tot
fs. As the atom lifetime is related to a scattering length, a measurement of the S-wave isospin-oddπKscattering lengtha−0=
0.11+0.09
−0.04
M−1
π has been presented.
Acknowledgements
This work has been partially supported by Russian Foundation for Basic Research, research project 13-01-00060.
References
[2] J. Gasser, H. Leutwyler, Nucl. Phys.B250 (1985) 465.
[3] G. Colangelo, J. Gasser, H. Leutwyler, Nucl. Phys.B603 (2001) 125. [4] J. Bijnens, P. Dhonte, P. Talavera, JHEP05 (2004) 036.
[5] B. Adeva et al. (DIRAC Collaboration), Phys. Lett.B704 (2011) 24. [6] J.R. Batley et al. (NA48/2 Collaboration), Eur. Phys. J.C64 (2009) 589. [7] J.R. Batley et al. (NA48/2 Collaboration), Eur. Phys. J.C70 (2010) 635. [8] S.M. Bilen’kii et al., Sov. J. Nucl. Phys. 10 (1969) 469.
[9] J. Schweizer, Phys. Lett.B587 (2004) 33.
[10] P. Buettiker, S. Descotes-Genon, B. Moussallam, Eur. Phys. J.C33 (2004) 409. [11] L.L. Nemenov, Sov. J. Nucl. Phys. 41 (1985) 629.
[12] A. Sakharov, Zh. Eksp. Teor. Fiz. 18 (1948) 631; reprinted in Sov. Phys. Usp. 34 (1991) 375. [13] C. Santamarina et al., J. Phys.B36 (2003) 4273. [14] M. Zhabitsky, Phys. At. Nucl. 71 (2008) 1040.
[15] B. Adeva et al. (DIRAC Collaboration), Phys. Lett.B674 (2009) 11.