Article
1
A multiscale modelling approach for estimating the
2
effect of defects in unidirectional carbon fiber
3
reinforced polymer composites
4
Kim-Niklas Antin 1, Anssi Laukkanen 2, Tom Andersson 2, Danny Smyl 3 and Pedro Vilaça 1,*
5
1 Aalto University, Department of Mechanical Engineering, Puumiehenkuja 3, 02150 ESPOO, Finland;
kim-6
7
2 VTT Technical Research Centre of Finland, Kivimiehentie 3, 02044 VTT, Finland; [email protected]
8
3 University of Sheffield, Department of Civil and Structural Engineering, Mappin Street, S13JD Sheffield,
9
United Kingdom; [email protected]
10
* Correspondence: [email protected]
11
12
Abstract: A multiscale modelling approach was developed in order to estimate the effect of defects
13
on the strength of unidirectional carbon fiber composites. The work encompasses a micromechanics
14
approach, where the known reinforcement and matrix properties are experimentally verified and a
15
3D finite element model is meshed directly from micrographs. Boundary conditions for loading the
16
micromechanical model are derived from macroscale finite element simulations of the component
17
in question. Using a microscale model based on the actual microstructure, material parameters and
18
load case allows realistic estimation of the effect of a defect. The modelling approach was tested
19
with a unidirectional carbon fiber composite beam, from which the micromechanical model was
20
created and experimentally validated. The effect of porosity was simulated using a resin-rich area
21
in the microstructure and the results were compared to experimental work on samples containing
22
pores.
23
Keywords: Modelling; Carbon fiber composite; Experimental mechanics; Multiscale; Defect
24
25
1. Introduction
26
Fiber reinforced polymers are important materials for structural applications in many fields. For
27
example, there are several notable applications of unidirectional (UD) carbon fiber reinforced
28
polymers (CFRP) in civil engineering [1-4]. Various mathematical regimes, including analytical [5-6],
29
semi-analytical [7], and numerical models [8], have been formulated to estimate the strength of these
30
materials [9]. Homogenised macroscale models [10] do not correctly capture the failure mechanisms
31
of a composite material and therefore micromechanical models have been developed as an alternative
32
[11]. Micromechanical models can be divided into phenomenological models, such as shear lag and
33
fiber bundle models [12], and numerical models using the finite element method [9]. Although both
34
types of micromechanical models take into account the interactions between fiber and matrix, only
35
numerical models have the potential to fully capture the complex nature of damage evolution in
36
composites [13]. They have the capability of accurately describing how failure starts and how defects,
37
that are small compared to the microstructural features, affect the performance of a composite.
38
Numerical micromodels can also be used to solve ply properties without experimental work when
39
designing laminates. Several analytical models have been developed for solving the homogenised
40
properties based on constituent properties [14]. However, the analytical models do not always
41
perform reliably, especially when fiber volume fractions are higher than 0.6 [15]. The analytical
42
solutions are, however, simple to use. These homogenised macroscopic material properties are
43
needed as an input for computation of mechanical finite element models. Micromechanical modelling
44
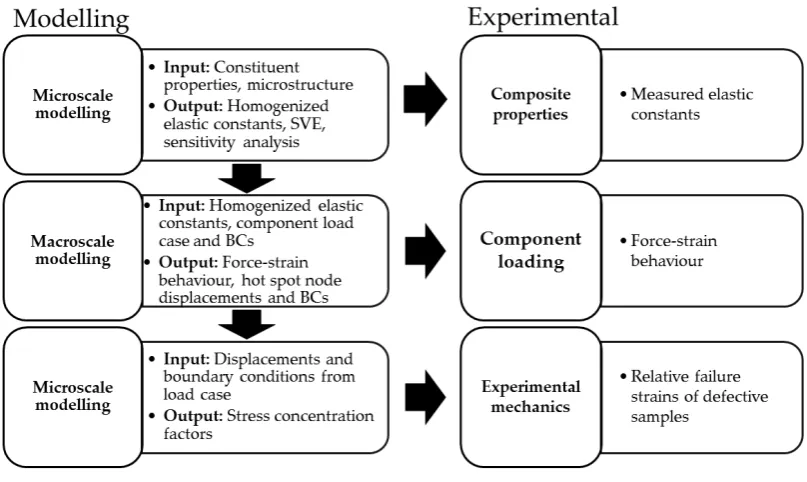
is useful during the service life of a component as well. It could provide a means to simulate the
45
response of a structure as a function of different sizes and types of damage occurring during service,
46
and hence be integrated in relevant condition monitoring systems. It also allows for continued
47
assessment and provides better information as to the required actions when damage is found and
48
characterized via non-destructive evaluation [16]. In other words, it furthers the ability to determine
49
the residual strength and evaluate whether or not a component can continue in service. However,
50
micromechanical models require the correct input, namely fiber and matrix properties (constituent
51
properties) and microstructure, in order to deliver reliable results.
52
Obtaining constituent properties and validating the homogenised output is not straightforward
53
for anisotropic composite materials. However, transversely isotropic materials like carbon fiber and
54
unidirectional fiber-reinforced composites have only five independent material constants [17]. The
55
longitudinal Young’s modulus E1f of the fiber is straightforward to calculate from instrumented
56
tensile tests [18-19]. Furthermore, the rule of mixtures is well established for axial properties of UD
57
composites and allows inverse micromechanics to be used with confidence. Direct measurements
58
of transverse Young’s modulus E2f have been conducted using nanoindentation [14] and the results
59
were found to be slightly higher than those obtained using various analytical inverse micromechanics
60
solutions [20]. Resonance frequencies have also been used to measure transverse Young’s modulus
61
of carbon fibers [21]. Obtaining experimentally the remaining three elastic constants of a single
62
filament is challenging. Many authors resort to measuring composite properties and using inverse
63
micromechanics [22]. Some modelling papers simply assume certain elastic properties [22-24] while
64
others cite sources which are difficult to obtain [25].
65
The modelled microstructure should describe information such as fiber volume fraction,
66
packing, size and shape as accurately as possible. Periodic square or hexagonal fiber packing is an
67
idealized case whereas random packing generators create a more realistic distribution of fibers [26],
68
but high fiber volume fractions are challenging for the generators [27]. There is an effect on transverse
69
elastic constants between periodic and random packing [15]. In strength models, fibers very close to
70
each other can lead to a significant increase in stress concentration factors [26], but the stress recovery
71
distance is smaller due to a locally stiffer matrix. Hence, packing type does not make much of a
72
difference for uniaxial loading of UD CFRPs in the fiber direction [28]. However, matrix plasticity
73
and debonding may change results [29] and off-axis loading requires random packing for accurate
74
results [30].
75
This paper describes the creation of a multiscale microstructure-based model and the
76
experimental validation of it. Ultimately, the goal of this work is to create a macroscale strength
77
model that considers microstructural defects without the need for experimental model updating or
78
calibration. The structure of the paper is as follows. First, the general structure of the multiscale
79
approach and the pre-requisites for a micromechanical model are described. Second, the numerical
80
methods for calculating composite properties using the information established in the previous step
81
are presented. Third, the composite properties are used to obtain relevant boundary conditions for
82
loading the original micromodel and simulating the effect of a defect on strength. The modelling
83
results are compared to measurements of a pultruded UD CFPR beam at each step.
84
2. Materials and Methods
85
The workflow (Figure 1) follows a typical multiscale approach [31] where microscopic behaviour is
86
described using a representative volume element (RVE) and global response is simulated using
87
homogenisation of the RVE (first step). Statistical representation of the microstructure is evaluated
88
by varying the RVE size until stabilization of homogenised properties occurs. The sensitivity of the
89
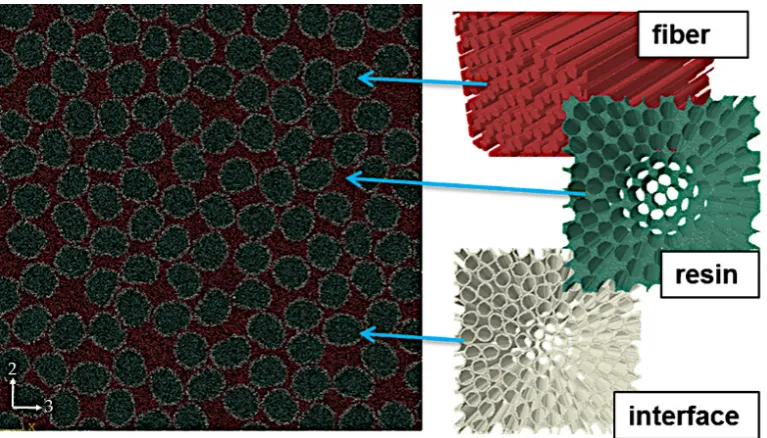
homogenised properties to changes in constituent properties, i.e. fiber and matrix properties, are
90
analysed with the aim of assessing the importance of individual input parameters, since not all of
91
them are necessarily well known. Homogenised properties can be measured experimentally [32], but
92
the goal here is that no experimental calibration [33] or inverse micromechanics is used. There are
93
two reasons for this. First, experimental work can be expensive and time-consuming if it is needed
94
every time an input parameter changes. Second, using inverse micromechanics or model calibration
makes experimental validation redundant. The second step in the workflow is to insert the
96
homogenised properties into a macroscopic model, which takes the component geometry, boundary
97
conditions and load cases into consideration. The response of the macroscopic model can be validated
98
experimentally by loading the component and comparing measured strain values with simulated
99
strain. The macroscopic model is used to identify critical areas in the structure. The third step in the
100
workflow involves using the critical locations for defining displacements and boundary conditions
101
for the RVE so that they are relevant with the practical application in mind. The effect of known
102
defects found using advanced NDE [16] or postulated defects can now be evaluated in microscale
103
with loading conditions relevant to real-life applications. The simulated failure strength of a defective
104
component can thus be calculated and compared to experimentally obtained failure loads. Ideally,
105
this process allows the estimation of residual strength of a defective component based on in-service
106
inspection results.
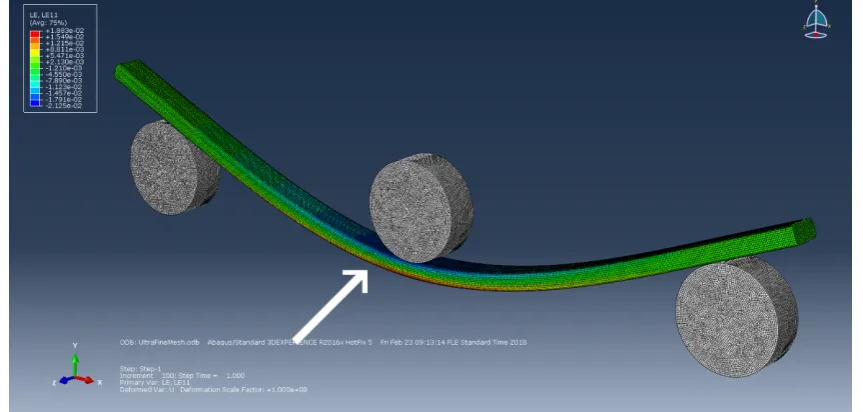
107
108
Figure 1. Flow chart describing the modelling process with concurrent experimental work.
109
The macroscopic model and case study presented in this paper is three point bending of a pultruded
110
UD CFRP beam. Constituent properties and micrographs are used to create the RVE and to obtain
111
homogenised composite properties. The critical location is identified from the macroscopic
112
simulation results and the node displacements at that location are used as a load case for the RVE to
113
evaluate the effect of porosity on the strength of the beam. Experimental validation is done for each
114
step.
115
2.1 Constituent properties
116
Constituent properties given by the manufacturer are used in this study, which is a typical source in
117
modelling papers [34-35]. This paper uses E1, E2, G12, ν12 and ν23, because these are the most feasible
118
to obtain experimentally. Here, fiber direction is denoted as “1” and the transverse plane as “2-3”
119
(Figure 2).
120
Experimental verification of the given constituent properties were conducted where possible
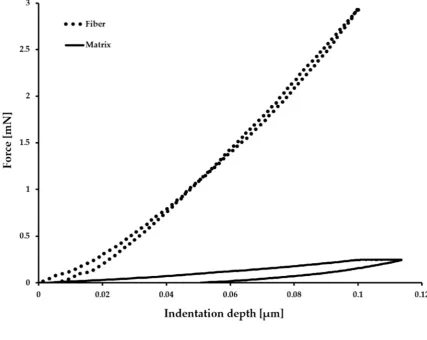
121
using instrumented nanoindentation. Indentation was performed using a CSM machine on
122
longitudinal and transverse cross-sections of the UD CFRP material [40] with the intention of
123
verifying E1f, E2f and Em, where the subscripts “f” and “m” stand for fiber and matrix respectively.
124
Specimen cross-sections were wet sanded to FEPA P4000 grit and ten measurements were made in a
125
line with 10 µm intervals. An indentation depth of 0.1 µm was selected because the indentation
modulus stabilizes at relatively high values [14,36-37]. On the other hand, deeper indentation was
127
avoided in order to keep the area function of the sphero-conical tip continuous and to avoid fracture.
128
It was apparent from the results which indentations had hit the fiber and which were on the matrix
129
(Figure 4). For the transverse sample, the direction of the measurement line was perpendicular to
130
fiber direction meaning that no two measurements are from the same filament. The indentation
131
parameter are: Indenter = SB-B28 sphero-conical; Tip radius = 2 µm; Cone full angle = 90°; Indentation
132
depth = 0.1 µm; (un)Loading rate = 0.8mN/min; Dwell time = 30 s; Data acquisition rate = 10 Hz.
133
The initial unloading slope was determined from the force-displacement data. The typically
134
used power-law fit proposed by Oliver & Pharr [38] did not produce high-correlation fits and
135
therefore a quadratic polynomial was used. Any permanent displacement (hf) was subtracted from
136
the data and intersection with the origin was imposed. The derivative of the polynomial fit at
137
maximum displacement was used to obtain the initial unloading slope or contact stiffness, S [39]. The
138
contact stiffness was used to calculate the contact depth (hc) using parameter ε=0.75 as proposed in
139
[38]. The contact depth was used to calculate the projected contact area and thus the indentation
140
modulus M as defined by Vlassak [40]. The indentation modulus of the isotropic matrix is
141
straightforward to calculate using the Oliver & Pharr method [38] when the indenter properties are
142
known. For an anisotropic material, where the contact area is elliptical, another solution is used
[41-143
42]. The principle there is to solve all five stiffness constants using a five-equation system by inserting
144
three previously known stiffness constants and two perpendicular indentation results. A
one-at-a-145
time sensitivity analysis showed that none of the inserted engineering constants alone affects the
146
results to a significant extent. The sensitivity analysis was conducted by doubling or halving each
147
engineering constant one at a time. The resulting values for E2f were maintained within 10% of the
148
reference case. The indentation modulus had the largest effect, which was close to a linear
149
dependency.
150
2.2 Microstructure
151
Since the ultimate goal here is a strength model, real microstructure of a pultruded CFRP beam is
152
used to generate the model morphology. High-resolution X-ray microtomography has been
153
conducted on the pultruded CFRP material [16]. However, distinguishing between fiber and matrix
154
from microtomography voxel data was found to be unreliable and therefore a 2.5D approach was
155
selected. Completely straight fibers are assumed although the tomography data [16] and transverse
156
cross-sections [3] indicate some fiber waviness. 2D data from cross-sections imaged using variable
157
pressure scanning electron microscopy (VP-SEM) and backscatter electron (BSE) detection are used.
158
The incident electrons were accelerated with a potential of 25 kV in order to get a higher yield of
159
back-scattered electrons compared to lower acceleration voltages. Fiber volume fraction is analysed
160
from that image as well using a binary colour map and manually adjusted threshold criteria. Defects
161
were introduced to the pultruded material by adding water to the resin bath at the pultrusion line.
162
Optical microscopy was used to characterize the resulting pore content and typical pore size, but the
163
2.5D approach for generating a 3D mesh does not allow using direct image-based meshing for the
164
microstructure containing pores. Instead, a resin-rich area of the microstructure is used to represent
165
the effect of porosity.
166
2.3 Microscale modelling
167
An image-based approach is used to obtain a representative microstructure for further
168
micromechanical analysis. SEM images were segmented initially to a two-phase depiction of the
169
material, the fiber and resin phases, respectively. In order to improve the realism of modelling and
170
eliminate possible artefacts from SEM specimen preparation, individual fibers were detached
171
algorithmically. These two-dimensional segmented images were extruded to yield a cubic
172
representative volume element (RVE) of the composite. As image-based meshing was utilized, no
173
geometric representative of the microstructure was generated at any point, but rather, the segmented
174
data is meshed directly. In addition to the fiber and resin phases, an interface region is included
175
(interphase) (Figure 2). The strategy chosen in the current work is to include the interface firstly to
obtain separation of individual fibers and secondly to yield a better description of the composite
177
microstructure and interaction between the fibers and the resin [43-44]. The approach falls within
178
effective interface approaches, i.e. the interface is a third phase, which effectively captures the
179
interface region behaviour between fibers and resin by employing its own mechanical material
180
properties. Further details of the modelling toolset utilized in creating the interphase are presented
181
in [31].
182
Figure 2. Representation of the three-phase microstructure: algorithmically detached fibers, interface
183
(interphase) added to the fiber perimeters and resin filling the rest.
184
Numerical homogenisation was employed in determining the engineering material properties of the
185
composite based on micromechanical modelling results. The RVEs were loaded under
kinetic-186
uniform boundary conditions (KUBC) and subjected to differing imposed strain states to compute
187
the volume averaged metrics for solving the composite material properties. In addition, the
188
computational volume from which the data was extracted was considered a variable in order to
189
ascertain that the RVE size is representative of composite behaviour. This was carried out by
190
sampling increasing material volumes beginning from the center of the microstructure towards its
191
external boundaries and assessing the changes in material property predictions.
192
The homogenised composite properties obtained with microscale FE modelling were compared
193
to analytical micromechanical equations. Results using the equations by Chamis [39] are included as
194
a comparison, since those equations require only the fiber volume fraction in addition to the
195
constituent properties. Other models often require some empirical parameters for the material in
196
question [17], which is effectively model calibration.
197
All of the homogenised composite properties were verified experimentally. The parameters E1
198
and ν12 were measured using uniaxial tensile and compression tests following the procedures in ISO
199
527-5, with strain gauges bonded parallel and perpendicular to fiber direction. The parameter ν12 was
200
solved by linear regression of the εt-εL strain data instead of measuring transverse thickness of the
201
sample as is suggested in the standard. E2 and ν23 were obtained using micro-DIC (Digital Image
202
Correlation) in transverse compression where the fibers themselves were used as contrast pattern.
203
Furthermore, quasi-static elasticity imaging was used to solve E1, E2, ν12 and G12. All of the previous
204
macroscale experiments are explained in more detail in [45].
205
2.4 Macroscale modelling
206
The finite element method was used for simulating the macroscale behaviour of the UD CFRP beam.
207
The simulations allow experimental verification of the behaviour of a real component using the
208
material constants obtained in the previous step. In addition, they give boundary conditions and
209
node displacements for the micromodel that are relevant to a real loading situation. The three point
210
bending setup used for experimental work was modelled and meshed in Abaqus CAE using
211
quadratic tetrahedral (C3D10) elements (Figure 3). The rollers were defined as rigid shell bodies with
212
Hertzian contact and a 0.15 friction coefficient [46]. Orthotropic material properties from the
213
homogenised micromechanical model were used for material properties of the specimen. A load of
214
658 N was applied to the central roller, which corresponds to the forces seen in earlier experimental
215
work [45]. In addition, cases with isotropic assumptions and a sensitivity analysis to individual
216
material parameters was made. The results were compared to flexural tests according to ISO 14125,
217
which are described in more detail in [45] and apparent interlaminar shear strength (ILSS) tests
218
according to ISO 14130.
219
220
Figure 3. Location of strain hot spot in simulated three point bending.
221
3. Results
222
The results are presented following the simulation workflow. First, constituent properties given by
223
the manufacturer are compared to measured values. The micrographs used for meshing are
224
presented also. Second, the representative microstructure is created and homogenised to obtain
225
composite properties. The results are compared to those obtained by analytical and experimental
226
methods. Third, macroscale simulations are used to create relevant loads for the micromechanical
227
model. Last, CFRP components are tested to failure and compared to the simulated stresses and
228
strains of corresponding microstructures.
229
3.1. Constituent properties
230
The micromodel inputs are the constituent properties and microstructure. The manufacturer has
231
provided material values for the constituents (Table 1). Only one shear modulus is used in this paper
232
and therefore ν23f needs to be calculated using the given value of G23f considering the isotropic
233
condition in the 2-3 plane.
234
Table 1. Material constants given by the manufacturer.
235
E1 [GPa] E2 [GPa] G12 [GPa] G23 [GPa] ν12 ν23 (calculated)
Fiber, f 239 20 30 8 0.2 0.25
Matrix, m 3.2 0.35
Nanoindentation was conducted in order to verify some of the given parameters (Figure 4). There is
237
a large discrepancy between the Young’s moduli obtained from indentation data and values reported
238
by the composite manufacturer (Table 2). The reason for differing behavior in the case of the fiber is
239
proposed to be nanobuckling and compressive failure in the nanostructure of carbon fiber [47].
240
Others have obtained similar results for PAN-based carbon fibers [37,48-50]. The resulting E2f from
241
these indentations is 13 GPa, which falls between the 20 GPa given by the manufacturer and inverse
242
micromechanics [14,17] from transverse compression tests indicating E2f should be 10 GPa. The
243
reason for differing epoxy stiffness is attributed to the constraint imposed by surrounding fibers [50].
244
245
Figure 4. Loading/unloading curves of fiber and matrix from which indentation modulus is
246
calculated.
247
Table 2. Comparison of indentation results with the given reference values.
248
Contact stiffness, S [mN/µm]
Indentation modulus, M [GPa]
Young’s modulus, E [GPa]
Reference, E [GPa]
Fiber, long. 46 ± 4 50 55 239 Fiber, trans. 17.5 ± 0.9 19 13 20
Matrix 13 ± 3 11 13 3
3.2 Microstructure
249
The microstructure obtained using electron microscopy (Figure 5) was processed algorithmically into
250
a multiphase mesh. The fiber volume fraction was obtained from the segmenting process also. The
251
fiber fraction was found to be 0.65, which corresponds to the fill ratio disclosed by the manufacturer.
252
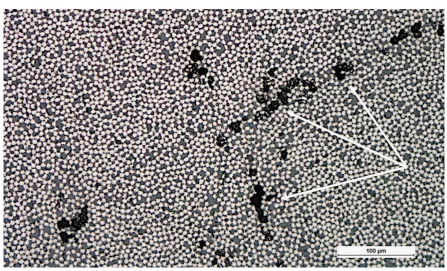
The introduced pores were characterized using light optical microscopy (Figure 6). The image shows
253
clusters of multiple pores approximately 20 µm in diameter.
255
Figure 5. Electron backscatter image distinguishes between fiber and matrix due to a difference in
256
average atomic number (Z contrast).
257
258
Figure 6. Optical micrograph showing pores (marked with white arrow).
259
3.3 Microscale modelling
260
The statistical representation of the microstructure meshed from the previous step (Figure 7) can be
261
evaluated by looking at homogenised values as a function of volume fraction of total microstructure
262
size. It is noted that stabilization of the prediction takes place at 0.5 of total volume, indicating that
263
the system is representative with respect to property computation. In addition, it is noted that chosen
264
boundary conditions for the simplistic description of material behavior do not markedly influence
the computation, as no significant deviations in the predictions are visible as the volume fraction
266
approaches 1.0.
267
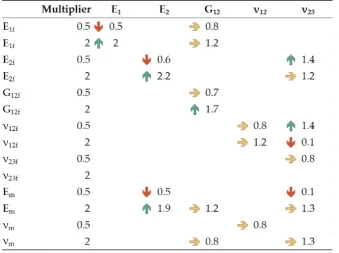
A one-at-a-time sensitivity analysis was conducted using the micromechanical FE model. In
268
total, 14 simulations were made and the resulting homogenised composite properties were analyzed
269
in terms of the five independent composite constants. The relative change to the reference value was
270
calculated and all ratios between 0.9-1.1 were omitted as insignificant. Ratios below 0.7 are marked
271
with red indicating a significant reduction while values above 1.3 are marked with green indicating
272
a significant increase. Values in between are marked with yellow to indicate a small change (Table
273
3). The most important constituent properties are E1f, E2f, G12f and Em while the Poisson’s ratios do not
274
have a strong effect on composite properties, especially when considering the realistic bounds for
275
those values. E1 is affected by E1f while E2 is affected by E2f and Em as shown also in the analytical
276
formulation [20]. E1f has a surprising effect on G12, which is not included in the analytical model,
277
which, on the other hand, exaggerates the role of Em on G12. The Poisson’s ratio ν12 is insensitive to all
278
parameters while ν23 changes with many of the parameters.
279
280
Figure 7. Image-based meshing of the microstructure showing a perspective view of the fiber and
281
interphase.
282
Table 3. Sensitivity of homogenised composite properties to fiber and resin properties.
283
3.4 Macroscale modelling
285
Macroscale modelling was used to obtain relevant boundary conditions for the RVE, but also to
286
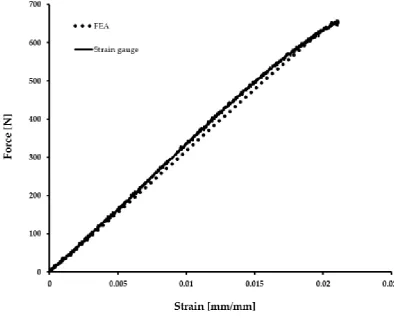
confirm that the three point bending simulation using homogenised material properties behaves
287
correctly. The simulation results are in good agreement with measured strain gauge and force cell
288
values (Figure 8), although the measurements show a non-linear dependency, which is not captured
289
by the model. In a similar way to what was done for the microscale modelling, a one-at-a-time
290
sensitivity analysis was conducted by doubling and halving the homogenised material constants. E1
291
could not be halved because the resulting displacements were too large for a stable solution to be
292
found. Instead, a factor of 0.75 was chosen for the reduced E1 case. Looking at the relative maximum
293
von Mises stress, strain in fiber direction and center roller displacement it appears like E1 is the main
294
governing parameter in three point bending, while E2 and G12 have only a weak effect on simulated
295
component behaviour. E1 is affected only by E1f (Table 3) and therefore E1f is the only constituent
296
property that needs to be known accurately for macroscale modelling the bending of UD CFRP
297
beams. Even an isotropic assumption leads only to a 3% error, meaning that the anisotropy is not
298
essential to be included in the model. However, these results are only for three point bending and the
299
transverse properties could play a larger role in other load cases.
300
Figure 8. Comparison of simulated and experimental response in three point bending.
301
The homogenised material properties were verified using various macroscopic experiments. Results
302
obtained using uniaxial tensile testing, uniaxial compression testing, transverse compression, flexural
303
testing, quasi-static elasticity imaging (QSEI), analytical formulas and homogenisation of the
304
micromechanical FE model are summarized in Table 4. G12 and ν23 are the only parameters where
305
discrepancy is seen. The first was not directly measured and the latter was obtained from transverse
306
compression where boundary conditions and specimen geometry, especially the length, could affect
307
the results as well as the location of the virtual strain gauges on the cross-section.
Table 4. Summary of simulated and measured composite properties.
309
E1 [GPa] E2 [GPa] G12 [GPa] ν12 ν23
Uniaxial tension 148 0.29 Uniaxial
compression 135
0.29
Transverse
compression 7
0.5
Flexural testing 152
QSEI [45] 155 7 10 0.29
Analytical [20] 156 10 5.3 0.25 0.29 RVE FEA 158 9 6.8 0.25 0.34
310
3.5 Effect of defects
311
The last step of the multiscale modelling approach is to use the boundary conditions obtained from
312
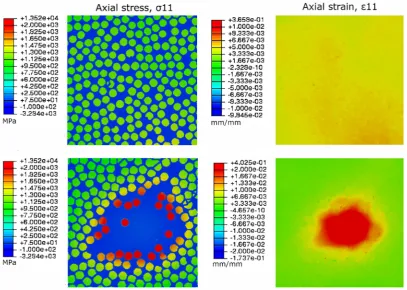
macroscale hot spot analysis for loading an RVE with a known defect. A resin-rich area in the
313
microstructure is used to represent the microstructure with porosity (Figure 6). The lack of
314
reinforcement fibers causes a local increase in strain and the surrounding fibers have to carry the load
315
(Figure 9). However, this type of matrix defect does not adversely affect the measured flexural
316
strength (Table 5). On the other hand, apparent ILSS tests indicate that porosity reduces the shear
317
strength of the CFRP material and failure occurs in the center plane (1-3) of the specimen. Changing
318
the RVE load case to correspond with the failure location observed in ILSS tests and looking at the
319
shear strain components shows the effect of the resin-rich zone (Figure 10). As expected,
320
heterogeneities in the microstructure cause local effects which can be quantified using the modelling
321
approach presented here.
322
323
Figure 9. Comparison of reference microstructure (top) and resin-rich defect (bottom) in
tension-324
Table 5. Comparison of strengths in defective and pristine samples.
326
Material Flexural strength [MPa] Apparent ILSS [MPa]
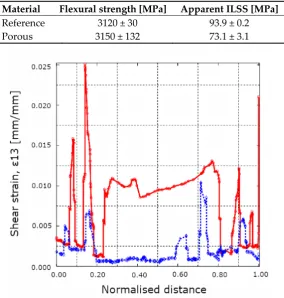
Reference 3120 ± 30 93.9 ± 0.2 Porous 3150 ± 132 73.1 ± 3.1
327
Figure 10. Line plots of the shear strains at the center (red) of the resin-rich microstructure and at
328
the bottom (blue) in a shear-dominated load case.
329
4. Conclusions
330
A micromechanics-based model was created to estimate the effect of defects in unidirectional carbon
331
fiber composites. The modelling approach requires the following inputs: fiber and resin properties,
332
microstructure, macroscale load cases, boundary conditions and defect morphology and location.
333
• Fiber and resin properties given by manufacturers should be taken with caution, considering the
334
measurement methodology is not known. Determining constituent properties with
335
nanoindentation gives poor results for both longitudinal fiber and matrix properties. The
336
phenomena could be attributed to nanoscale buckling of the fiber and a constraint effect in the
337
matrix respectively. Transverse nanoindentation results of the fiber were closer to inverse
338
micromechanics solutions and literature values of similar fibers. Despite the uncertainty in input
339
parameters, the homogenised composite properties were in good agreement with experimental
340
verifications.
341
• SEM images were successfully segmented algorithmically enabling the generation of a
342
representative mesh of the microstructure. However, the use of 2D micrographs omits fiber
343
waviness effects and defect morphology.
344
• Macroscale simulations were in good agreement with experimental work both in terms of elastic
345
response and failure location. A sensitivity analysis showed that only the longitudinal modulus
346
of the composite plays a significant role in the macroscale response. Furthermore, that parameter
347
is mainly affected by the longitudinal fiber modulus, which is typically known. In fact,
348
transverse properties are insignificant to a degree where an assumption of isotropic material
349
properties leads only to a 3% error in stress/strain. However, three-point bending was the only
350
load case used.
351
• A batch of high-porosity material was produced and the effect of porosity was simulated using
352
a resin-rich area in the microstructure. The simulations show stress and strain concentrations in
353
the fibers and matrix due to the heterogeneous microstructure. However, long-beam bending
experiments showed no difference in strength between reference and porous samples. This can
355
be attributed to the load sharing mechanism of unidirectional reinforcement fibers in
356
predominantly tensile loading. However, short-beam bending experiments showed a 20%
357
reduction in apparent shear strength for the samples with porosity. The effect of matrix defects
358
on shear strength was simulated by looking at the shear strains in the center plane where failure
359
occurred. The results depict a highly strained matrix at the resin-rich zone compared to a
360
homogeneous microstructure.
361
362
The approach presented here can be used to estimate the residual strength of a component with a
363
known microscale defect. The component and load case used in this paper is simple and future work
364
should include validating the approach for other component geometries and loads.
365
Author Contributions: conceptualization, K-N.A.; methodology, K-N.A, A.L, T.A.; software, A.L.; validation,
366
K-N.A.; formal analysis, K-N.A., A.L.; investigation, K-N.A.; resources, K-N.A., P.V., A.L.; data curation, K-N.A,
367
A.L.; writing—original draft preparation, K-N.A.; writing—review and editing, K-N.A., D.S., P.V.; visualization,
368
K-N.A., A.L.; supervision, P.V.; project administration, P.V.; funding acquisition, P.V.
369
Funding: This research was funded by Business Finland FIMECC program and the APC was funded by Aalto
370
University.
371
Conflicts of Interest: The authors declare no conflict of interest. The funders had no role in the design of the
372
study; in the collection, analyses, or interpretation of data; in the writing of the manuscript, or in the decision to
373
publish the results.
374
References
375
1. Rizzo, P.; di Scalea, L. Acoustic emission monitoring of carbon-fiber-reinforced-polymer bridge stay cables
376
in large-scale testing. Experimental Mechanics 2001, 41, pp. 282-290. DOI:10.1007/BF02323146
377
2. Rebel, G.; Verreet, R.; Ridge, I.M.L. Lightweight ropes for lifting applications. In: Proceedings of the
378
OIPEEC Conference, Athens, Greece, 2006, pp. 33-54.
379
3. Antin, K-N.; Machado, M.A.; Santos, T.G.; Vilaça, P. Evaluation of different non-destructive testing
380
methods to detect imperfections in unidirectional carbon fiber composite ropes. Journal of Nondestructive
381
Evaluation 2019, 38. DOI:10.1007/s10921-019-0564-y
382
4. Machado, M.A.; Antin, K-N.; Rosado, L.S.; Vilaça, P.; Santos, T.G. Contactless high-speed eddy current
383
inspection of unidirectional carbon fiber reinforced polymer. Composites Part B: Engineering2019, 168, pp.
384
226-235. DOI:10.1016/j.compositesb.2018.12.021
385
5. Hedgepeth, J.M.; van Dyke, P. Local stress concentrations in imperfect filamentary composite materials.
386
Journal of Composite Materials1967, 1, pp. 294-309.
387
6. Landis, C.M.; McMeeking, R.M. Stress concentrations in composites with interface sliding, matrix stiffness
388
and uneven fiber spacing using shear lag theory. International Journal of Solids andStructures 1999, 36, pp.
389
4333-4361.
390
7. Otero, J.A.; Rodriguez-Ramos, R.; Bravo-Castillero, J.; Guinovart-Diaz, R.; Sabina, F.J.; Monsivais, G.
Semi-391
analytical method for computing effective properties in elastic composite under imperfect contact.
392
International Journal of Solids and Structures 2013,50, pp. 609-622. DOI:10.1016/j.ijsolstr.2012.11.001
393
8. Sun, C.T.; Vaidya, R.S. Prediction of composite properties from a representative volume element.
394
Composites Science and Technology 1996, 56, pp. 171-179.
395
9. Mishnaevsky Jr., L.; Broensted, P. Micromechanical modeling of damage and fracture of unidirectional
396
fiber reinforced composites: A review. Computational Materials Science 2009, 44, pp. 1351-1359.
397
DOI:10.1016/j.commatsci.2008.09.004
398
10. Wongsto, A.; Li, S. Micromechanical FE analysis of UD fibre-reinforced composites with fibres distributed
399
at random over the transverse cross-section. Composites Part A 2005, 36, pp. 1246-1266.
400
DOI:10.1016/j.compositesa.2005.01.010
401
11. Dong, C. Effects of Process-Induced Voids on the Properties of Fibre Reinforced Composites. Journal of
402
Materials Science & Technology2016, 7, pp. 597-604. DOI: 10.1016/j.jmst.2016.04.011
403
12. Swolfs, Y.; Gorbatikh, L.; Romanov, V.S.; Orlova, S.; Lomov, S.V.; Verpoest, I. Stress concentrations in an
404
impregnated fibre bundle with random fibre packing. Composites Science and Technology2013, 74, pp.
113-405
13. Vaughan, T.J.; McCarthy, C.T. Micromechanical modelling of the transverse damage behaviour in fibre
407
reinforced composites. Composites Science and Technology 2011, 71, pp. 388-396.
408
DOI:10.1016/j.compscitech.2010.12.006
409
14. Maurin, R.; Davies, P.; Baral, N.; Baley, C. Transverse properties of carbon fibres by nano-indentation and
410
micro-mechanics. Applied Composite Materials2008, 15, pp. 61-73. DOI:10.1007/s10443-008-9057-3
411
15. Beicha, D.; Kanit, T.; Brunet, Y.; Imad, A.; El Moumen, A.; Khelfaoui, Y. Effective transverse elastic
412
properties of unidirectional fiber reinforced composites. Mechanics of Materials 2016, 102, pp. 47-53.
413
DOI:10.1016/j.mechmat.2016.08.010
414
16. Schumacher, D.; Antin, K-N.; Zscherpel, U.; Vilaça, P. Application of different X-ray techniques to improve
415
in-service carbon fiber reinforced rope inspection. Journal of Nondestructive Evaluation2017, 36, pp. 1-14.
416
DOI:10.1007/s10921-017-0441-5
417
17. Halpin, J.C.; Kardos, J.L. The Halpin-Tsai equations: A review. Polymer Engineering and Science 1976, 16, pp.
418
344-352.
419
18. Sarlin, E.; von Essen, M.; Palola, S.; Lindgren, M.; Kallio, P.; Vuorinen, J. Determination of environmental
420
degradation of matrix and fiber materials with a novel, stastically reliable micro-robotic approach. In:
421
Proceedings of the 17th European Conference on Composite Materials ECCM17, München, Germany, 2016.
422
19. Ilankeeran, P.K.; Mohite, P.M.; Kamle, S. Axial tensile testing of single fibres. Modern Mechanical Engineering
423
2012, 2, pp. 151-156. DOI:10.4236/mme.2012.24020
424
20. Chamis, C.C. Simplified composite micromechanics equations for hygral, thermal and mechanical
425
properties. NASA Technical Memorandum 83320, In: 38th Annual Conference of the Society of the Plastics
426
Industry, Houston, Texas, USA, 1983.
427
21. Mounier, D.; Poilane, C.; Bucher, C.; Picart, P. Evaluation of transverse elastic properties of fibers used in
428
composite materials by laser resonant ultrasound spectroscopy. In: Proceedings of the Acoustics
429
Conference, Nantes, France, 2012.
430
22. Soden, P.D.; Hinton, M.J.; Kaddour, A.S. Lamina properties, lay-up configurations and loading conditions
431
for a range of fibre-reinforced composite laminates. Composites Science and Technology1998, 58, pp.
1011-432
1022.
433
23. Turon, A.; Costa, J.; Maimi, P.; Trias, D.; Mayugo, J.A. A progressive damage model for unidirectional
fibre-434
reinforced composites based on fibre fragmentation. Part I: Formulation. Composites Science and Technology
435
2005, 65, pp. 2039-2048. DOI:10.1016/j.compscitech.2005.04.012
436
24. Blassiau, S.; Thionnet, A.; Bunsell, A.R. Micromechanisms of load transfer in a unidirectional carbon fibre–
437
reinforced epoxy composite due to fibre failures. Part 1: Micromechanisms and 3D analysis of load transfer:
438
The elastic case. Composite Structures 2006, 74, pp. 303-318. DOI:10.1016/j.compstruct.2005.04.013
439
25. Behzadi, S.; Jones, F.R. The effect of temperature on stress transfer between a broken fibre and the adjacent
440
fibres in unidirectional fibre composites. Composites Science and Technology 2010, 68, pp. 2690-2696.
441
DOI:10.1016/j.compscitech.2008.04.046
442
26. Bouaoune, L.; Brunet, Y.; El Moumen, A.; Kanit, T.; Mazouz, H. Random versus periodic microstructures
443
for elasticity of fibers reinforced composites. Composites Part B 2016, 103, pp. 68-73.
444
DOI:10.1016/j.compositesb.2016.08.026
445
27. Melro, A.R.; Camanho, P.P.; Pinho, S.T. Generation of random distribution of fibres in long-fibre reinforced
446
composites. Composites Science and Technology 2008, 68, pp. 2092-2102.
447
DOI:10.1016/j.compscitech.2008.03.013
448
28. Swolfs, Y.; Verpoest, I.; Gorbatikh, L. Issues in strength models for unidirectional fibre-reinforced
449
composites related to Weibull distributions, fibre packings and boundary effects. Composites Science and
450
Technology2015, 114, pp. 42-49. DOI:10.1016/j.compscitech.2015.04.002
451
29. Okabe, T.; Takeda, N.; Kamoshida, Y.; Shimizu, M.; Curtin, W.A. A 3D shear-lag model considering
micro-452
damage and statistical strength prediction of unidirectional fiber-reinforced composites. Composites Science
453
and Technology 2001, 61, pp. 1773-1787.
454
30. Trias, D.; Costa, J.; Mayugo, J.A.; Hurtado, J.E. Random models versus periodic models for fibre reinforced
455
composites. Computational Materials Science2006, 38, pp. 316-324. DOI:10.1016/j.commatsci.2006.03.005
456
31. Holmberg, K.; Laukkanen, A.; Turunen, E.; Laitinen, T. Wear resistance optimisation of composite coatings
457
by computational microstructural modelling. Surface and Coatings Technology 2014, 247, pp. 1-13.
458
32. Orell, O.; Vuorinen, J.; Jokinen, J.; Kettunen, H.; Hytönen, P.; Turunen, J.; Kanerva, M. Characterization of
460
elastic constants of anisotropic composites in compression using digital image correlation. Composite
461
Structures 2018, 185, pp. 176-185. DOI:10.1016/j.compstruct.2017.11.008
462
33. Haj-Ali, R.; Kilic, H. Nonlinear constitutive model for pultruded FRP composites. Mechanics of Materials
463
2003, 35, pp. 791-801. DOI:10.1016/S0167-6636(02)00207-7
464
34. Fiedler, B.; Holst, S.; Hobbiebrunken, T.; Hojo, M.; Schulte, K. Modelling of the initial failure of CFRP
465
structures by partial discretisation: A micro/macro-mechanical approach of first ply failure. Advanced
466
Composite Letters2004, 13. DOI:10.1177/096369350401300501
467
35. Fliegener, S.; Luke, M.; Gumbsch, P. 3D microstructure modeling of long fiber reinforced thermoplastics.
468
Composites Science and Technology 2014, 104, pp. 136-145. DOI:10.1016/j.compscitech.2014.09.009
469
36. Miyagawa, H.; Mase, T.; Sato, C.; Drown, E.; Drzal, L.T.; Ikegami, K. Comparison of experimental and
470
theoretical transverse elastic modulus of carbon fibers. Carbon 2006, 44, pp. 2002-2008.
471
DOI:10.1016/j.carbon.2006.01.026
472
37. Diss, P.; Lamon, J.; Carpentier, L.; Loubet, J.L.; Kapsa, P. Sharp indentation behavior of carbon/carbon
473
composites and varities of carbon. Carbon 2002, 40, pp. 2567-2579.
474
38. Oliver, W.C.; Pharr, G.M. An improved technique for determining hardness and elastic modulus using
475
load and displacement sensing indentation experiments. Journal of Materials Research 1992, 7, pp. 1564-1583.
476
DOI:10.1557/JMR.1992.1564
477
39. Oliver, W.C.; Pharr, G.M. Measurement of hardness and elastic modulus by instrumented indentation:
478
Advances in understanding and refinements to methodology. Journal of Materials Research 2004, 19, pp.
3-479
20. DOI:10.1557/jmr.2004.19.1.3
480
40. Vlassak, J.J.; Ciavarella, M.; Barber, J.R.; Wang, X. The indentation modulus of elastically anisotropic
481
materials for indenters of arbitrary shape. Journal of the Mechanics and Physics of Solids 2003, 5, pp.
1701-482
1721. DOI:10.1016/S0022-5096(03)00066-8
483
41. Delafargue, A.; Ulm, F-J. Explicit approximations of the indentation modulus of elastically orthotropic
484
solids for conical indenters. International Journal of Solids and Structures 2004, 41, pp. 7351–7360.
485
DOI:10.1016/j.ijsolstr.2004.06.019
486
42. Csanadi, T.; Nemeth, D.; Zhang, C.; Dusza J. Nanoindentation derived elastic constants of carbon fibres
487
and their nanostructural based predictions. Carbon 2017, 119, pp. 314-325. DOI:10.1016/j.carbon.2017.04.048
488
43. Hashin, Z. Thin interphase/imperfect interface in elasticity with application to coated fiber composites.
489
Journal of the Mechanics and Physics of Solids 2002, 50, pp. 2509-2537.
490
44. Tang, Z.; Wang, C.; Yu, Y. Failure response of fiber-epoxy unidirectional laminate under transverse
491
tensile/compressive loading using finite-volume micromechanics. Composites Part B 2015, 79, pp. 331-341.
492
DOI: 10.1016/j.compositesb.2015.04.054
493
45. Smyl, D.; Antin, K-N.; Dong, L.; Bossuyt, S. Coupled digital image correlation and quasi-static elasticity
494
imaging of inhomogeneous orthotropic composite structures. Inverse Problems 2018, 34.
DOI:10.1088/1361-495
6420/aae793
496
46. Qiao, Y.; Bisagni, C.; Bai, Y. Experimental investigation and numerical simulation of unidirectional carbon
497
fiber composite under multi-axial loadings. Composites Part B 2017, 124, pp. 190-206.
498
DOI:10.1016/j.compositesb.2017.05.034
499
47. Oscan, S.; Tezcan, J.; Filip, P. Microstructure and elastic properties of individual components of C/C
500
composites. Carbon 2009, 47, pp. 3403-3414. DOI:10.1016/j.carbon.2009.07.057
501
48. Marx, D.T.; Riester, L. Mechanical properties of carbon-carbon composite components determined using
502
nanoindentation. Carbon 1999, 37, pp. 1679-1684.
503
49. Leatherbarrow, A.; Wu, H. Mechanical behaviour of the constituents inside carbon-fibre/carbon-silicon
504
carbide composites characterised by nano-indentation. Journal of the European Ceramic Society 2012, 32, pp.
505
579-588. DOI:10.1016/j.jeurceramsoc.2011.09.026
506
50. Hardiman, M.; Vaughan, T.J.; McCarthy, C.T. The effect of fibre constraint in the nanoindentation of fibrous
507
composite microstructures: A finite element investigation. Computational Materials Science 2012, 64, pp.