Testing and Evaluation of Multi-Parameter
Physiological Data Acquisition System under
+Gz Stress
BindushreeYadav M1, Dr.Aravind A.S2, Dr. S.C Prasannakumar3
PG Student (BMSP&I), Dept. of Electronics and Instrumentation, RVCE, Bangalore, India1
Professor & Head, Dept. of Biomedical Engineering, IAM, IAF, Bangalore, India2
Professor, Dept. of Electronics and Instrumentation, RVCE, Bangalore, India3
ABSTRACT:The study of muscular response of neck muscles under high +Gz conditions from within the simulated
environment of human centrifuge was not carried out so far as commercially available sEMG systems were neither small in footprint and volume nor were they rated for operation in high +Gz environment. Therefore, a system was developed for operation and data collection from within the centrifuge under high +Gz conditions.The paper describes the testing and evaluation of a multi-parameter physiological data acquisition system, both the hardware and software, used for recording various biomedical signals under simulated G stress inside a human Centrifuge. It also lists out the modifications done while building progressive versions of software.
KEYWORDS: +Gz Stress, iMedilogger ,Neck pain, sEMG, Centrifuge
I.INTRODUCTION
Neck pain in military pilots and aircrew is a growing, international aero-medical concern. High performance combat pilots (HPCP) are a unique occupational group who routinely operate in a high gravitational force environment where they are expected to control expensive and highly complex instrumentation in order to successfully maneuver their aircraft. Gravitational force, which is measured in multiples of force due to gravity, is the result of accelerating (+Gz) and decelerating (-Gz) maneuvers, which are common in aerial combat. Both acute and chronic neck pain is a common complaint of HPCP, often resulting in loss of workdays and reduced functional performance in high +Gz situations.
The fighter pilots wear helmets which have Night Vision goggles (NVGs), battery sources, housing cabinets and other associated electronic display units. These elements exert excess load on the neck muscles in the presence of +Gz stress while performing aerial maneuvers because the helmet weighs G times its original weight. Exposure to these high loads will eventually result in muscle fatigue and thus leading to neck pain. In order to quantify the effects of high loads being exerted on the neck muscle during G-stresses and to measure the extent of fatigue, sEMG is used as an indicator.
In this project, Non-invasive or surface EMG is used to extract information about muscle activity under G-stress induced loads. The obtained EMG information is later correlated with other physiological parameters such as ECG, SpO2 and respiratory rate acquired under G-stress. For this, development of a multi-parameter telemetric
II.HARDWARE DESCRIPTION
iMedilogger, the multi-parameter physiological data acquisition system designed allows recording of human parameters Electro cardiograph, 4-channels of Electromyograph, the pulse-oximetry data (SpO2) and respiration. This device contains twoparts, the Master (transmitter) and the Slave (receiver).The Master device is connected to subject and Slave device is connected to the computer. The master device collects the above mentioned parameters from the subject and transmits to the receiver through RF (Radio freq.). In parallel with the transmission, a backup of this data is stored on the SD card. The slave device receives data sent by the master and saves it in the computer.
Product Name: iMedilogger ITIE41T and ITIE41R
Compact, portable, computerised battery operated, digital, Telemetric multi-channel, multi parameter telemetric physiological data acquisition and display system capable of monitoring and storage of 4-channel EMG, ECG, SpO2 and Respiration rate, running on 3.7V Li-Ion battery optimized for low power consumption. The system comprised of a head amplifier unit along with digitizer and transmitter and a receiver unit connected to a laptop computer through the USB port for capture/display of data in real-time, storage, replay and analysis as shown in the figure 1 below. The data could also be captured and recorded on a 2 GB micro-SD Card. The system had embedded firmware in the head amplifier unit and software installed in the computer for operation.
Figure 1: Transmitter and Receiver Units used in the project
III.SOFTWARE DESCRIPTION
Software Name: iMedilogger - Multi-Channel, Multi-parameter physiological data acquisition and display system.
iMedilogger software was developed to record and store the physiological signals ECG, EMG, SPO2 and Respiratory Signals. The software was designed to act as an interface between the hardware system and the subject in consideration. It was designed with simple yet interactive GUI for easy user access. At first, the subject profile has to be created filling in the details such as his name, DOB, weight, telephone number, address. The system generates a unique Patient ID number for every profile saved. In the next step the user can select the signals of interest among the available choices. After creating the profile, live recording can be carried out under the created profile. The system permits multiple sessions and multiple recordings for every subject by assigning unique Trace ID numbers. Every recording can be saved on the Microsoft database which is linked to the software at the backend, and can be replayed accordingly as and when required. Figure 2 shows the snapshot of iMedilogger software.
Figure 2: Snapshot of iMedilogger software
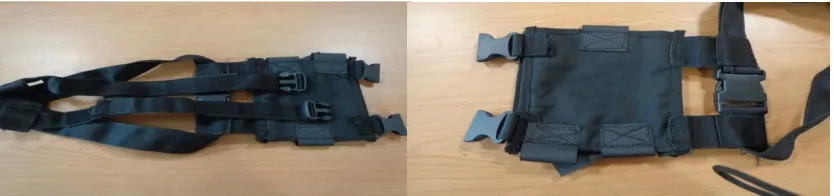
The system also comprised of a chest harness as shown in figure 3 to enable safe body mounting of the head amplifier/ transmitter unit on the subject even when the subject is under G-stress inside the Human centrifuge. The harness was developed to hold the transmitter at subject’s chest level throughout the recording period. This harness was made up of very thick Nylon cloth along with Nylon straps, Velcro, belts and buckles. The harness is rectangular with two cross straps whose lengths could be adjusted and one around the body secure belt. This harness ensured the safety of the transmitter as well as prevented the discomfort to the subject throughout the recording.
Figure 3: Chest Harness for body mounting the transmitter.
IV.TESTING
Extensive testing of the system was undertaken for its performance evaluation. The trails were carried out both on-ground and within the human centrifuge exposing the system to High-G-Stress.It was seen that the software had certain bugs and severe limitations and system was not functioning as required. Also, certain basic essential features were left out and these had to be incorporated. Remedial measures were undertaken and all these anomalies were fixed during testing, leading to development of progressive versions of the software.
A.On-ground testing
The system was tested on-ground using live subjects who were connected to the system for recording their ECG, EMG, SpO2 and respiration. The ECG was recorded using limb leads in lead-II configuration and sEMG was recorded bilaterally from the right and left wrist muscles. The electrodes were placed directly on the bulk of the muscle body 20mm apart. The finger probe was used for pulse oximetry and a variable resistance chest belt transducer was used for respiration. The recordings were carried out for duration of 40 minutes in each episode with the subject in resting condition.
Application seldom hanged. When this happened it was observed that the acquisition screen showed absence of signal which was being recorded at that instant. It was also observed there was a significant reduction in the amplitude of the signals being recorded. There was an error message which said "Error 6- (overflow) Enter the correct minimum, maximum and division values." The source of these errors was identified to the battery conditions. The battery was replaced and it was ensured that it remained in fully charged condition during acquisition.
The saving of the signals in the database was based on sample count index and had no reference to time due to non-availability of RTC in the transmitter unit. All experiments were assumed to start at 12:00:00 hrs only. This was a serious limitation and did not allow redraw based on time of the record. It was corrected by introducing system time of the laptop into the record. The time axis in the manual draw mode was also changed to contain time-stamps. This modification helped the user to view and analyze the signal recorded in any time slot of interest.
The system time and application time were not in sync and the difference between them kept on increasing during acquisition even though both showed same value at the start of the process. This was rectified by taking the system time for each sample.
The manual draw function had extremely limited navigation features. The system did not have provision for viewing Previous and Next pages. This feature was introduced in redraw mode which gave access to the before and after time slots of the current time slot preventing the user from manually keying in the time ranges every time.
It was not possible to mark any event of interest during recording as Event Markers did not exist. These were introduced to allow the user to mark instants of interest. This would help the user to analyze how the physiological signals varied at those instants. A user could use a total of 16 markers in one recording episode.
G graph was superimposed on Respiratory, ECG and EMG graphs which was not present earlier.
In redraw mode, provision was made to manually insert the minimum and maximum value, and the number of divisions for Y-axis of all the individual graphs. This allowed the user to rescale the graph to achieve better viewing of the recorded signals.
Data processing and marker identification and processing were optimized to achieve faster replotting of the graphs.
V.EVOLUTION OF IMEDILOGGER SOFTWARE
The system was supplied with version V0.82.DBR as its native resident operational software. As the testing progressed, the software was continuously modified to rectify the issues and the software evolved accordingly. This led to progressive versions of the software and the details are as given below.
Version DBR- This was the old delivered version with inherent problems. Raw data was saved based on
sample count. Data saving protocol was changed to real time based system. System time was captured from the computer and introduced as a key field at the beginning of the record.All further references and computations were changed based on this recorded system time.
Version DER-The Auto and Manual redraw computations and the graphs for all parameters were changed to
parameters, and in Auto and Manual redraw functions. This changed the entire design philosophy for a better, real-time based acquisition system.
Version DFR- The manual draw function had extremely limited navigation features. The data graph of
parameters could be accessed at any one specified time range only. "Next and Previous Page" features were introduced for all parameters to navigate forward and backwards in the Manual Draw mode.
Version E0R-Event Markers were introduced in the ECG, RR and EMG-3 channels to mark important events
during recording. This helped immensely in the recall of events and to observe the changes in the parameters at the time of any event of interest. Notes for the event markers could also be entered in consonance with the notes function. A maximum of 16 event markers could be introduced for each record.
Version E1R-The Y-axis scale of amplitude of voltages in Redraw function was common for all parameters,
but the actual voltages ranges were different for different parameters. This resulted in graphs of parameters being displayed inappropriately in the Redraw mode. Therefore separate Y-axis specification scales for all parameters on page 1 and for EMG on page 2 were introduced.
Version E2R- It was seen that Redraw function was taking extremely long time (32 minutes for 20 min data)
for computation and display of graphs. The algorithms were optimized for faster computation by taking samples based on ratios. But, the problem was not resolved and the process led to additional issues in computations. System went into infinite loops under certain conditions. These bugs were identified and fixed.
Version E3R- In this version, combined features from V.xxxxE0R was introduced along with optimization
but no Y axis scaling. 0 values were substituted for first 25 sample records for initialization.
Version E4R- Corrections were made in the algorithms and bugs were fixed to incorporate features from
Vxxxx.E3R along with Y-Axis scaling and Marker optimizations.
Version E6R: Introduction of CSV format conversion feature for data conversion. A tab for CSV conversion
was introduced in the GUI of iMedilogger.
Version E8R: Time delay of 1ms was introduced when sample system time was same as previous sample as
this was leading to clashes and system became unstable.
Version EBR: Sampling rates were rationalized and optimization of processing time was carried out. But it
was noticed that the sample updating rate was very low in this modified version. This issue could not be fixed as it required changes in hardware design and introduction of RTC in the transmitter.
Version ECR: In this version, the display screen refreshing rate was made higher.
B.In-centrifuge testing
The main aim of the project was to record and study the changes in the sEMG of human subjects under +Gz stress and correlate them with their other physiological parameters. This required testing and evaluation of the performance of the iMedilogger device in the Human Centrifuge. The human centrifuge is a unique simulation facility for simulating high-G-stress conditions. This facility is available only at the Institute of Aerospace Medicine, Bangalore in India.
designed harness. The ECG in lead –II configuration and EMG electrodeswere connected to the subject to obtain sEMG of neck muscles. The subject was made to sit on the seat of the gondola. However, it was found that the RF transmission failed when the Gondola door was closed. This was observed during Static centrifuge testing itself. With more testing it was concluded that RF transmission was not successful as the Gondola was electrically isolated. The identified problem was of serious concern because the data collection was expected to be done by keeping the computer outside the Gondola and having a RF link. Therefore, recording PC along with transmitter and receiver part was placed inside the Gondola as the solution. This placement of the whole recording system needed rigid and fail proof anchoring system with strappings that would hold the system firmly when the centrifuge is on run simulating high G condition. Appropriate sites inside the Gondola were identified and a Harness was developed for fixing the recording system inside the Gondola of High Performance Human Centrifuge (HPHC).
C.Development of Harness for Recording PC and Receiver
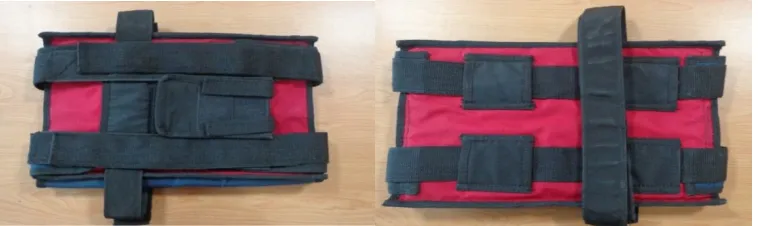
This Harness was made using very thick bi-layered Nylon cloth along with Nylon straps, Velcro Straps and cushioning materials. The cushioning material was added as a layer below the Nylon cloth to ensure that the recording laptop rests on a cushion and also to avoid any damage to the device during High-G movement of centrifuge. Three Nylon straps were made, two of which fixed the laptop length-wise and the other fixed the laptop breadth-wise to the Gondola. Velcro straps were stitched to the end of the Nylon straps to tie the two ends of straps together and to the Gondola. Separate pouch was made for the Receiver above the Harness as the receiver had to be connected to the recording PC through the USB cable. The harness is shown in figure 4 below.
Figure 4: Top view and bottom view of Harness for Recording PC and Receiver
The system was put inside the gondola and fixed securely with the help of developed harness. Trails were carried out without subject and then with subject. Both the efforts were found successful.
VI.CONCLUSION
A multi-channel, multi-parameter physiological recording system was developed for recording physiological parameters from human subjects subjected to +Gz stress. The system was tested and evaluated extensively for its performance both on-ground and in-centrifuge. This process brought out many of the limitations and lack of essential features of the system. These issues were identified, analyzed in detail and innovative solutions were arrived at to resolve them. This led to change in experimental protocol and methodology, evolution of software and development of additional mounting accessories which were essential for the successful completion of the project.
REFERENCES
1. ZoranaDančuo, Vladimir Zeljković, BoškoRašuo, MirkoĐapić, High G Training Profiles in a High Performance Human Centrifuge, Scientific Technical Review, 2012, Vol.62, Page 64-66.
2. Simon Guardiera, Effects of hypergravity on manual forces and displacements: causes and practical implications, Institute of Physiology and
Anatomy, German Sport University, Germany, 2008 (Ph.D Thesis), Page 8-19.
3. Jonathan P. R. Scott , James Jungius , Desmond Connolly , Alec T. Stevenson, Subjective and Objective Measures of Relaxed +G z Tolerance
Following Repeated +G z Exposure, Aviation, Space, and Environmental Medicine, Vol. 84, July 2013, Page 1-8.
4. Thais Russomano, Mara R Rizzatti, Effects of simulated Hypergravity on Biomedical Experiments, IEEE Engineering In Medicine And
5. Marco Di Rienzo, PierandreaCastiglioni, Assessment of Gravitational stress on Heart rate variability during Maneuvers on High performance Jet Flights,32nd Annual International Conference of the IEEE EMBS, Buenos Aires, Argentina, August 31 - September 4, 2010,Page 3457-3459.
6. Acad. Valeriy, Dr. Oleg a. yakimenko, The concept of ON-Board diagnostics, Prognosis and correction of pilot condition under the action of
high level G-load complex, Aerospace and Electronics conference, IEEE,1995, Page 453-458.
7. Jonathan korn and david L. Lleinman, Frequency Domain Measures of Human performance under G-stress, IEEE, 1979.
8. Bennett Tucker, Kevin Netto, George hampson, Predicting neck Pain in Royal Australian air force Fighter Pilots, Military Medicine, Vol 177,
April 2012, Page 444-450.
9. Bjorn O. ang, Karin Harms, Neck/ Shoulder Exercise for Neck pain in air force helicopter pilots, SPINE Vol 34,2009,Page 44-51.
10. GoutamChatterjee, Ajay Somkuwar, +Gz induced stress monitoring of pilots with synthesized ECG, IJSCT, Vol 3, Jan 2010, Page 75-79.
11. Peter Konrad ,The ABC of EMG - A Practical Introduction to Kinesiological Electromyography, Version 1.0, April 2005, Page 1-58.
12. Basmajian JV, De Luca CJ (1985) Muscles Alive. Their Function Revealed by Electromyography. Williams &Wilkens, Baltimore, Chapter
1-6.
13. Carlo J De Luca, Surface Electromyography: Detection and Recording, ©DelsysInc, Page 1-10.
14. EMG Analysis-A software user guide for EMG Graphing and EMG Analysis, ©Motion lab systems, Page 1-48.
15. LidaMademli, The physiological background of EMG, Centre of Research & Technology Centre of Research & Technology - Hellas
Informatics & Telematics Institute, Page 1-37.
16. Daniel E. Becker, Fundamentals of Electrocardiography Interpretation, American Dental Society of Anesthesiology, 2006, Page 53-56.
17. Steve Meek, Francis Morris, ABC of clinical electrocardiography, Bio-medical Journal (BMJ) Volume 324, 2002, Page 1-8.
18. Anderson de Souza CasteloOliveira , Mauro Goncalves, EMG amplitude and frequency parameters of muscular activity: Effect of resistance