DOI: 10.15662/ijareeie.2014.0307001
Shunt Compensation for Improvement of Voltage
Stability Using Static VAR Compensator (SVC) In
a Power Transmission System
Shervin Samimian Tehrani
1, Peyman Salmanpour Bandaghiri
2Student, Amirkabir University of Technology, Tehran Polytechnic, Iran1&2
ABSTRACT: Voltage stability of a system is affected by reactive power limit of the system. FACTs devices improve the reactive power flow in system thereby improving voltage stability and these are used for controlling transmission voltage, Power flow, dynamic response and reducing reactive losses in transmission lines. This paper explores the effect of SVC on static voltage stability and presents the effect of Static VAR compensator (SVC) on Voltage Profile & Reactive Power for variable load conditions is investigated and presents static methods like Modal Analysis, Two Bus Thevenin Equivalent and Continuation Power Flow methods to predict the voltage collapse of the bus in the power system.WSCC 3-machine, 9-bus system has been used to demonstrate the ability of SVC in improving the voltage stability margin. These FACTs controllers help to increase the load ability margin of the power network. Modelling & simulation have been carried out using MATLAB/SIMULINK Software.
KEYWORDS: FACTS, SVC, Voltage Stability.
I.INTRODUCTION
DOI: 10.15662/ijareeie.2014.0307001 Line stability index, Line stability Factor, Reduced Jacobian Determinant, Minimum Singular Value of Power Flow Jacobian, and other voltage indices methods. The minimum singular value of the load flow Jacobian matrix is used as an index to measure the voltage stability limit is considered by reference [5]. Energy method [6, 7] and bifurcation theory [8] are also used by some researchers to determine the voltage stability limit. Point of collapse method and continuation method are also used for voltage collapse studies [9].Of these two techniques continuation power flow method is used for voltage analysis. These techniques involve the identification of the system equilibrium points or voltage collapse points where the related power flow Jacobian becomes singular [10, 11]. In this paper the following methods are used
1. Modal Analysis method is used to identify the weak bus by calculating participation factors and sensitivity factors. 2. Two Bus Thevenin Equivalent method is used to determine the maximum loading capability of a particular load bus in a power system through the Thevenin equivalent circuit and also the loading capability of the bus after the placement of SVC device.
II.BASIC CONFIGURATION OF SVC
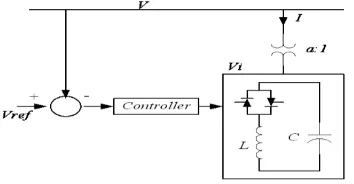
The SVC uses conventional thyristors to achieve fast control of shunt-connected capacitors and reactors. The configuration of the SVC is shown in Fig.1, which basically consists of a fixed capacitor (C) and a thyristor controlled reactor (L). The firing angle control of the thyristor banks determines the equivalent shunt admittance presented to the power system. A shunt connected static Var generator or absorber whose output is adjusted to exchange capacitive or inductive current so as to maintain or control bus voltage of the electrical power system. Variable shunt susceptance model of SVC [12] is shown in Fig.1.
Fig.1. Equivalent circuit of SVC
As far as steady state analysis is concerned, both configurations can modeled along similar lines, The SVC structure shown in Fig. 1 is used to derive a SVC model that considers the Thyristor Controlled Reactor (TCR) firing angle as state variable. This is a new and more advanced SVC representation than those currently available. The SVC is treated as a generator behind an inductive reactance when the SVC is operating within the limits. The reactance represents the SVC voltage regulation characteristic. The reason for including the SVC voltage current slope in power flow studies is compelling. The slope can be represented by connecting the SVC models to an auxiliary bus coupled to the high voltage bus by an inductive reactance consisting of the transformer reactance and the SVC slope, in per unit (p.u.) on the SVC base. A simpler representation assumes that the SVC slope, accounting for voltage regulation is zero. This assumption may be acceptable as long as the SVC is operating within the limits, but may lead to gross errors if the SVC
is operating close to its reactive limits [12]. The current drawn by the SVC is, ISV C jBSV C.VK
The reactive power drawn by SVC, which is also the reactive power injected at bus k is,
0 PSV C
2
QSV C QK V .BK SV C (1)
Where, VK − Voltage at bus k BSV C − Voltage at bus k
QSV C− Reactive Power drawn or generated by SVC.
DOI: 10.15662/ijareeie.2014.0307001 reactive power value to maximum inductive reactive power value in the bus that the static Var generator is connected [13]. Inductance determines the capacitive or inductive working positions of the device. The inductance value is calculated with the equation (2) below [14]:
X X
2( ) sin 2
V L
,
o o
0 90 (2)
Where, XLis thyristor uncontrolled basic inductive reactance and α is the trigger angle. Total impedance of the
controller is calculated with the equation (3) below:
1
X X
sin 2 2 (2 )
x
e C
x r
r
(3)
Where, r c
x L
X X
provides the limits of trigger angle and the limit values of the controllers. XC is the capacitive
reactance. The output power of SVC is found by using the equation (4) below:
2 1 1
( )
QC
V
v c
X X
(4)
Where,
V
is the voltage of the line.As the reactive power demand at the bus varies, the susceptance is varied subject to the limits. However, the reactive power is a function of the square of the bus voltage. Hence the reactive power generated decreases as the voltage decreases.The SVC can both absorb as well as supply reactive power at the bus it is connected to by control of the firing angle of the thyristor elements. By controlling the firing angle α of the thyristors (i.e., the angle with respect to the zero crossing of the phase voltage), the device is able to control the bus voltage magnitude. Changes in α results in changes on the current and hence, the amount of reactive power consumed by the inductor. When α = 90°, the inductor is fully activated but is deactivated when α = 180°. Actually, the basic control strategy is typically to keep the transmission bus voltage within certain narrow limits defined by a controller droop and the firing angle α limits (90° < α < 180°).
Fig.2. Basic structure of SVC and voltage control
Fig. 3 provides the voltage control characteristic of SVC in continuous operations [15]. Where, Vref shows the voltage
value of the system under normal loading conditions. Bmax shows the inclusion of all capacities whereas Bmin shows the
exclusion of all capacities. The flow to the system is either inductive or capacitive according to these conditions. In this system SVC controls the power system to which it is connected by behaving as an adjustable reactive power system.
DOI: 10.15662/ijareeie.2014.0307001
III. NEWTON-RAPHSON METHOD
The Newton-Raphson method is widely used for solving non-linear equations. ultimately used to study power flow studies in power system. It transforms the original non-linear problem into a sequence of linear problems whose solutions approach the solutions of the original problem. Let G=F(x,y) be an equation where the variables x and y are the function of arguments of F. G is a specified quantity.
If F is non-linear in nature there may not be a direct solution to get the values of x and y for a particular value of G. in such cases, we take an initial estimate of x and y and iteratively solve for the real values of x and y until the difference is the specified value of G and the calculated value of F (using the estimates of x and y) i.e. ΔF is less than a tolerance
value. The procedure is as follows: Let the initial estimate of x and y be
x
oandy
o respectively. Using Taylor series0 0
0 0 0 0
x ,y x ,y
G = F(x ,y ) F x F Δy
x y
(5)
Where F x and F y
are calculated at 0
x and y 0
0 0
G F(x ,y ) F F . x F . y
x y
(6) In the matrix form it can be written as
Δx
(ΔF) ( )( )
Δy
F F
x y
or Δx
( ) Inv( )(ΔF)
Δy
F F
x y
(7)
After the first iteration x is updated to x =x +Δx1 0 &y =y +Δy . The procedure is continued till after some iteration 1 0 both ΔF is less than some tolerance value ε. The values of x and y after the final update at the last iteration is considered as the solution of the function F. For the Load Flow solution, the non-linear equations are given. There will be (2n – 2 – p) such equations, with (n) being the total number of buses and p the number of PV and generator buses. Equation can be replaced as:
V Δδ ΔP Δ V ΔQ V P P Q Q
or Δδ V ΔP
Inv
Δ V ΔQ
V P P Q Q (8)
The matrix of equation consisting of the partial differentials, is known as the Jacobean matrix and is very often denoted as J.ΔP is the difference between specifies value of P (Psp) and the calculated value of P using the estimates of δ and |V| in a previous iteration. We calculate ΔQ similarly.The Newton power flow is the most robust power flow algorithm used in practice. However, one drawback to its use is the fact that the terms in the Jacobian Matrix must be recalculated each iteration, and then the entire set of linear equations in equation must also be resolved each iteration. Since thousands of complete power flow are often run for planning or operations study, ways to speed up this process were devised.3.1. Two Bus Thevenin Equivalent Method . 3.1.1. Without Placement of SVC
A Simple and direct method of determining the steady state voltage stability limit of a power system is presented in reference [16].Consider a simple Two-Bus system as shown in Fig 4. The generator at bus 1 transfers power through a transmission line having an impedance of Z = R +jX to a load center at bus 2. Bus 1 is considered as a swing bus where
DOI: 10.15662/ijareeie.2014.0307001
Fig.4. A Simple Two-Bus System
For a given value of V1 the relationship between the load voltage magnitude V2 and the load power S = P +jQ can
readily be written as :V1V2IZ V2I R2X2 (9) Critical loading is found as follows
1
2
( cos sin )
2 ( sin cos )
m
V Z R X
S
R X
(10)
Where Z R2X2
The maximum reactive power loading Q
m (with P = 0) and the corresponding voltage can be obtained from the above
equations by setting θ = 0.
2 2
1 1
2
( - ) - 2
and
2 2
m m
V Z X V Q X
Q Vcr
R
(11)
3.1.2. With Placement of SVC
A Simple and direct method of determining the steady state voltage stability limit of a power system after the placement of Static Var Compensator (SVC) is presented in reference [17].A SVC of finite reactive power rating is placed at the load center in two bus equivalent model and it is shown in fig. 5.
Fig.5. A Simple Two-Bus System with SVC
The receiving end voltage decreases as the load increases and reactive power will be injected by SVC to boost the voltage. Voltage collapse occurs when there is further increase in load after SVC hits its maximum limit. In order to prevent voltage collapse, SVC is considered as fixed susceptance BC.Receiving end current from fig.5 is given by
*
L
R c R
R
S I jB V
V
(12)IV.IMPLEMENTATION OF SVC ON WSC 3-MACHINE, 9-BUS SYSTEM
DOI: 10.15662/ijareeie.2014.0307001
Fig.6. Modelling of WSCC 3-machine, 9-bus system with SVC on bus 8th bus
First of all, a continuous power flow analysis for 9 bus system power system was undertaken in order to determine the maximum loading parameters without the use of SVC. Later, the most vulnerable bus of the system in terms of system voltage stability was determined.
Table1: POWER FLOW RESULTS Result without SVC
Bus No.
Voltage (p.u.)
Phase (rad)
P.Gen (p.u.)
Q.Gen (p.u.)
P.load (p.u.)
Q.load (p.u.)
1 1.0398 -0.98955 0.71585 0.24815 0 0
2 1.0229 -0.82645 1.63 0.00155 0 0
3 1.0227 -0.90735 0.85 -0.1635 0 0
4 1.0249 -1.0283 0 0 0 0
5 0.99425 -1.0592 0 0 1.25 0.5
6 1.0113 -1.0539 0 0 0.9 0.3
7 1.0238 -0.9239 0 0 0 0
8 1.0138 -0.97635 0 0.12875 1 0.35
9 1.0303 -0.95465 0 0 0 0
Table2: POWER FLOW RESULTS Result with SVC
Bus No.
Voltage (p.u.)
Phase (rad)
P.Gen (p.u.)
Q.Gen (p.u.)
P.load (p.u.)
Q.load (p.u.)
1 1.04 0 0.71585 0.24815 0 0
2 1.025 0.1605 1.63 0.00155 0 0
3 1.025 0.08065 0.85 -0.1635 0 0
4 1.027 -0.0386 0 0 0 0
5 0.99795 -0.06955 0 0 1.25 0.5
6 1.0147 -0.0643 0 0 0.9 0.3
7 1.0297 0.0638 0 0 0 0
8 1.025 0.01165 0 0.12875 1 0.35
DOI: 10.15662/ijareeie.2014.0307001
Fig.7. Diagram of bus voltage variations versus time without SVC
Fig.8. Diagram of bus voltage variations versus time with SVC
Fig.9. Voltage Magnitude Profile without and with SVC
V. CONCLUSION
DOI: 10.15662/ijareeie.2014.0307001 the shunt compensation device called Static Var Compensator of different susceptance values. Continuation Power Flow method is used for determining the critical loading as well as the voltage profile of the test system with and without placement of SVC is observed. The reactive power support to the weak bus is provided by using shunt connected FACTS device Static Var Compensator (SVC) which is modeled as variable suscpetance mode. The voltage stability of the weak bus is enhanced after the placement of SVC.
REFERENCES
[1] P. Kundur, “Power system stability and control”, New York: McGraw-Hill 1994.
[2] Hingorani, N.G. and Gyugyi, L., “Understanding FACTS - Concept and technology of flexible ac transmission systems”, IEEE Press, 1999. [3] Mohamed, G.B.Jasmon, S.Yusoff, “A Static Voltage Collapse Indicator using Line Stability Factors”, Journal of Industrial Technology, Vol.7,
N1, pp. 73-85, 1989.
[4] Yokoyama, A. and Kumano, T., “Static voltage stability index using multiple load flow solutions’’, Journal of Electrical Engineering in Japan, Vol. 111.
[5] Overbye, T.J. and DeMarco, C.L., “Improved technique for power system voltage stability assessment using energy methods”, IEEE Trans. on Power Systems, Vol. 6, No. 4, 1991, pp. 1446-1452.
[6] Overbye, T.J., Dobson, 1.D. and DeMarco, C.L., “Q-V curve interpretations of energy measures for voltage security”, IEEE Trans. on Power Systems, Vol. 9, No. 1, 1994, pp. 331-340.
[7] Canizares, C.A., “On bifurcations, voltage collapse and load modeling”, IEEE Trans. on Power Systems, Vol.10, No. 1, 1995, pp. 512-522. [8] R.Natesan, G.Radman, “Effects of STATCOM, SSSC and UPFC on Voltage Stability”, Proceeding of the system theory, thirty-Sixth
southeastern symposium, 2004, pp.546-550.
[9] Dobson, H.Dchiang, “Towards a theory of Voltage collapse in electric power systems”, Systems and Control Letters, Vol.13, 1989, pp.253-262.
[10] C.A.Canizares, F.L.Alarado, C.L.DeMarco, I. Dobson and W.F.Long, “Point of collapse methods applied to ac/dc power systems”, IEEE Trans. on Power Systems, Vol.7, No. 2, May 1992, pp.673-683.
[11] C. A. Canizares, “Power Row and Transient Stability Models of FACTS controllers for Voltage and Angle Stability Studies”, IEEE/PES WM Panel on Modeling, Simulation and Applications of FACTS Controllers in Angle and Voltage Stability Studies, Singapore, Jan. 2000. [12] Hingorani, N.G. and Gyugyi, L., “Understanding FACTS - Concept and technology of flexible ac transmission systems”, IEEE Press, 1999. [13] Arifoglu U. Guc Sistemlerinin Bilgisayar Destekli Analizi. Alfa Publications, Istanbul, Turkey, 2002 [in Turkish].
[14] Canizares CA, Zeno TF., “Analysis of SVC and TCSC controllers in voltage collapse”, IEEE Trans ac Power System 1999;14:158-165. [15] Hingorani N. G., Gyugyi L., “Understanding FACTS concepts and Technology of flexible AC transmission systems”, New York. IEEE Press,
2000.
[16] Haque M.H., “A fast method of determining the voltage stability limit of a power system”, Electric Power Systems Research, Vol. 32, 1995, pp. 35-43.
[17] Haque M.H., “Determination of steady state voltage stability limit of a power system in the presence of SVC”, IEEE Porto Power Tech Conference, 10th– 13thSeptember, 2001, Porto, Portugal.
[18] Acha E., Ambriz-Perez H., Fuerte-Esquivel, “Advanced SVC Models for Newton-Raphson Load Flow and Newton Optimal Power Flow Studies”, IEEE Transactions on Power Systems, 15(1), p.129-136, 2000.
[19] K. Kuthadi, N. Suresh, “Enhancement of Voltage Stability through Optimal Placement of Facts Controllers in Power Systems”, American Journal of Sustainable Cities and Society, vol. 1.2012.
BIOGRAPHY
Shervin Samimian Tehrani graduated from Islamic Azad University South Tehran Branch, Iran, with B.E. degree in Electrical Power Engineering. He is currently working towards his Master degree in power management (Electrical Power Engineering) at Amirkabir University of Technology, Tehran Polytechnic, Iran. He knows with specialize software in Electrical Power Engineering, including: MATLAB/SIMULINK, PSCAD/EMTDC, DIgSILENT PowerFactory, LEAP, HOMER. His research lies in Renewable Energy, Energy Management, Power System Analysis, power marketing and power electronics.