ISSN (Print) : 2320 – 3765 ISSN (Online): 2278 – 8875
I
nternational
J
ournal of
A
dvanced
R
esearch in
E
lectrical,
E
lectronics and
I
nstrumentation
E
ngineering
(An ISO 3297: 2007 Certified Organization)
Vol. 4, Issue 5, May 2015
Multi Temporal SAR Image Analysis
using NSCT Fusion and Supervised
Classifier for Change Detection
Archana.G, M.Rathika
M.E Student [Applied Electronics], Dept. of ECE, Kingston Engineering College, Vellore, Tamil Nadu, India
Assistant Professor, Dept. of ECE, Kingston Engineering College, Vellore, Tamil Nadu, India
ABSTRACT: The project presents change detection approach for synthetic aperture radar (SAR) images based on an image fusion and supervised classifier system. The image fusion technique will be introduced to generate a difference image by using complementary information from a mean-ratio image and a log-ratio image. NSCT (Non- subsampled contourlet transform) fusion rules based on an average operator and minimum local area gradient are chosen to fuse the contourlet coefficients for a low-frequency band and a high-frequency band respectively, to restrain the background information and to enhance the information of changed regions in the fused difference image. For the remote sensing images, differencing(subtraction operator) and ratioing (ratio operator) are well-known techniques for producing a difference image. In differencing, changes are measured by subtracting the intensity values pixel by pixel between the considered couple of temporal images. In ratioing, changes are obtained by applying a pixel-by-pixel ratio operator to the considered couple of temporal images. In the case of SAR images, the ratio operator is typically used instead of the subtraction operator since the image differencing technique is not adapted to the statistics of SAR images. An artificial neural network type multi-layer perceptron or back propagation with feed forward network will be proposed for classifying changed and unchanged regions in the fused difference image. This classifier comes under supervised segmentation which is worked based on training cum classification. The results will be proven that ratioing generates better difference image for change detection, using supervised classifier segmentation approach and efficiency of this algorithm will be exhibited by sensitivity and correlation evaluation.
KEYWORDS: Image fusion, synthetic aperture radar (SAR), Image Segmentation, Non Subsampled Contourlet Transform (NSCT), Log ratio approach, Mean ratio approach, Supervised Classifier.
I. INTRODUCTION
ISSN (Print) : 2320 – 3765 ISSN (Online): 2278 – 8875
I
nternational
J
ournal of
A
dvanced
R
esearch in
E
lectrical,
E
lectronics and
I
nstrumentation
E
ngineering
(An ISO 3297: 2007 Certified Organization)
Vol. 4, Issue 5, May 2015
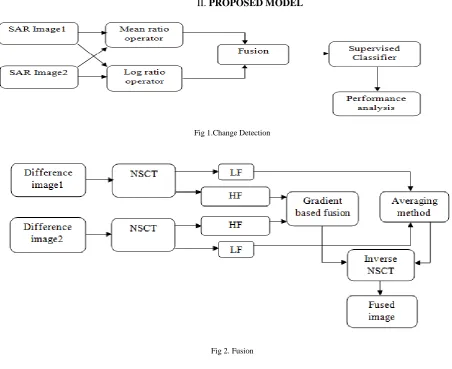
II. PROPOSED MODEL
Fig 1.Change Detection
Fig 2. Fusion
A. DESCRIPTION
Change detection approach for synthetic aperture radar images based on an image fusion and a supervised classifier algorithm. The image fusion technique will be introduced to generate a difference image by using complementary information from a mean-ratio image and a log-ratio image.
Fig 3. Multitemporal images relating to the city of Bern used in the experiments (a) Image acquired in April 1999 before the flooding. (b) Image acquired in May 1999 after the flooding.
ISSN (Print) : 2320 – 3765 ISSN (Online): 2278 – 8875
I
nternational
J
ournal of
A
dvanced
R
esearch in
E
lectrical,
E
lectronics and
I
nstrumentation
E
ngineering
(An ISO 3297: 2007 Certified Organization)
Vol. 4, Issue 5, May 2015
information and enhance the information of changed regions in the fused difference image. A supervised classifier algorithm will be proposed for classifying changed and unchanged regions from fused image with performance analysis.
B. DIFFERENCE IMAGE CREATION
Logarithmic scale based difference part will be generated to identify changed and unchanged region and it is weakening the high intensity and enhancing the low intensity pixels. Due to this weakening, there is a possibility of information loss from significant part. So along with this, ratio mean operator and fusion approach is used to reduce this limitation and produce detailed portion from source images for accurate detection of changes.
The difference images are obtained by,
Log ratio approach
𝐷1 = | log 𝑋2 – log 𝑋1| (1) Where,
𝑋2 – Input image1 and 𝑋1 – Input image 2 Mean ratio approach
𝐷2= 1 – min(𝑢1/𝑢2, 𝑢2/𝑢1) (2) Where,
𝑢1 – average filtered image1,𝑢2 – average filtered image2 .
(c) (d) Fig 4. (c) Log ratio image (d) Mean ratio image
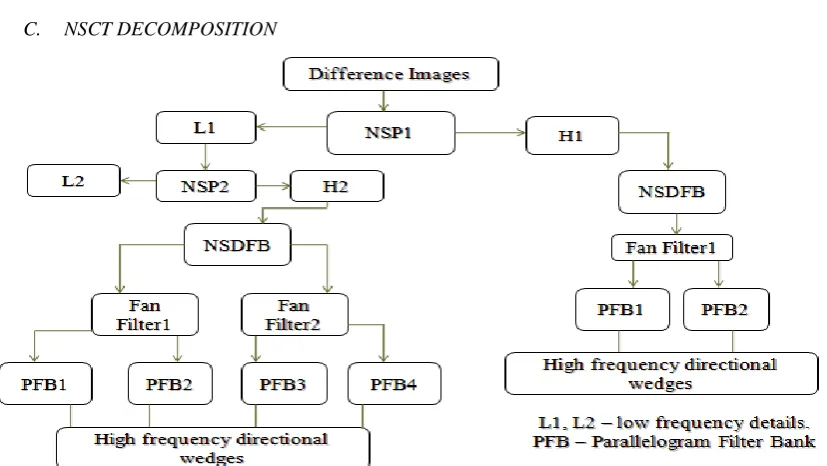
C. NSCT DECOMPOSITION
ISSN (Print) : 2320 – 3765 ISSN (Online): 2278 – 8875
I
nternational
J
ournal of
A
dvanced
R
esearch in
E
lectrical,
E
lectronics and
I
nstrumentation
E
ngineering
(An ISO 3297: 2007 Certified Organization)
Vol. 4, Issue 5, May 2015
NSCT transform is more suitable for constructing a multi-resolution and multi-directional expansions using non-separable Pyramid Directional Filter Banks (PDFB) with small redundancy factor.
NSCT decomposition is to compute the multi scale and different direction components of the discrete images. It involves the two stages such as Non sub sampled pyramid (NSP) and Non sub sampled directional filter bank(NSDFB) to extract the texture, contours and detailed coefficients. NSP decomposes the image into low and high frequency subbands at each decomposition level and it produces n+1 sub images if decomposition level is n.
NSDFB extracts the detailed coefficients from direction decomposition of high frequency subbands obtained from NSP. It generates m power of 2 direction sub images if number of stages be m.
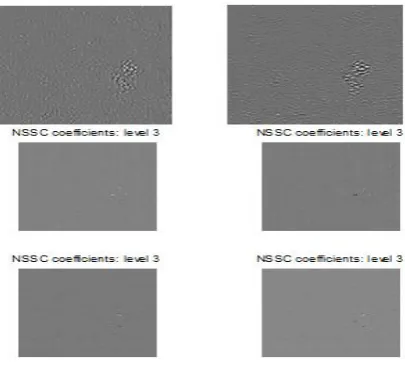
Fig 6. Difference image 1
D. FUSION
FUSION OF LOW-FREQUENCY COEFFICIENTS
Considering the images approximate information is constructed by the low-frequency coefficients, average rule is adopted for low-frequency coefficients. Suppose BF(x, y) is the fused low-frequency coefficients, then
𝐵𝐹 𝑥, 𝑦 =
(𝐵1 𝑥 ,𝑦 + 𝐵2 𝑥,𝑦 )
2 (3)
WhereB1(x, y) and B2(x, y)denote the low-frequency coefficients of source images.
FUSION OF HIGH-FREQUENCY COEFFICIENTS
High-frequency coefficients always contain edge and texture features. Suppose Clk (x y) is the high-frequency
CT coefficients, whose location is (x,y) in the subband of k-th direction at l-th decomposition scale. The region energy is defined as follows:
𝐸𝑙𝑘 𝑥, 𝑦 = 𝐶𝑙𝑘 𝑥 + 𝑚, 𝑦 + 𝑛 2
𝑚 ,𝑛 ∈ 𝑆𝑀 ×𝑁 (4)
where 𝑆𝑀×𝑁denotes the regional window and its size is M × N (typically 3×3 ).
ISSN (Print) : 2320 – 3765 ISSN (Online): 2278 – 8875
I
nternational
J
ournal of
A
dvanced
R
esearch in
E
lectrical,
E
lectronics and
I
nstrumentation
E
ngineering
(An ISO 3297: 2007 Certified Organization)
Vol. 4, Issue 5, May 2015
𝐺 = 𝑑𝑧𝑑𝑥2+ 𝑑𝑦𝑑𝑥2 (5)
Where, the dzdx and dydx are the y derivatives and x derivatives obtained by the sobel edge operators.Then these coefficients are fused based on the searching maximum gradient of these two using decision rule.
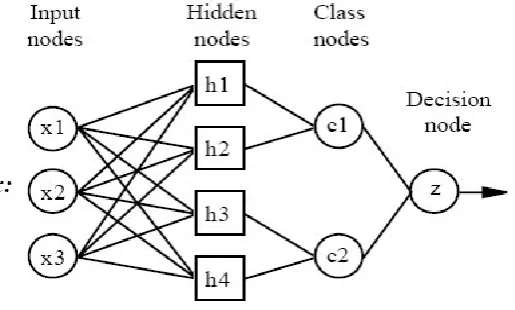
E. SUPERVISED CLASSIFIER
NEURAL NETWORK
Neural networks are predictive models loosely based on the action of biological neurons. The type of neural network used here is Back propagation with feed forward network for training the samples.
BACK PROPAGATION NETWORK
Fig 7. Architecture of a BPN Network
All BPN networks have the following four layers,
INPUT LAYER
There is one neuron in the input layer for each predictor variable. In the case of categorical variables, N-1 neurons are used where N is the number of categories.
HIDDEN LAYER
This layer has one neuron for each case in the training data set. The neuron stores the values of the predictor variables for the case along with the target value. When presented with the x vector of input values from the input layer, a hidden neuron computes the Euclidean distance of the test case from the neuron’s center point and then applies the RBF kernel function using the sigma value(s). The resulting value is passed to the neurons in the pattern layer.
PATTERN LAYER / SUMMATION LAYER
For BPN networks there is one pattern neuron for each category of the target variable. The actual target category of each training case is stored with each hidden neuron; the weighted value coming out of a hidden neuron is fed only to the pattern neuron that corresponds to the hidden neuron’s category.
DECISION LAYER
For BPN networks, the decision layer compares the weighted votes for each target category accumulated in the pattern layer and uses the largest vote to predict the target category.
ISSN (Print) : 2320 – 3765 ISSN (Online): 2278 – 8875
I
nternational
J
ournal of
A
dvanced
R
esearch in
E
lectrical,
E
lectronics and
I
nstrumentation
E
ngineering
(An ISO 3297: 2007 Certified Organization)
Vol. 4, Issue 5, May 2015
Consider a network with a single real input x and network function F. The derivative F’(x) is computed in two phases. They are,
FEED-FORWARD
The input x is fed into the network. The primitive functions at the nodes and their derivatives are evaluated at each node. The derivatives are stored.
BACK PROPAGATION
The constant 1 is fed into the output unit and the network is run backwards. Incoming information to a node is added and the result is multiplied by the value stored in the left part of the unit. The result is transmitted to the left of the unit. The result collected at the input unit is the derivative of the network function with respect to x.
STEPS OF THE ALGORITHM
The back propagation algorithm is used to compute the necessary corrections, after choosing the weights of the network randomly. The algorithm can be decomposed in the following four steps:
Step 1: Feed-forward computation
Step 2 : Back propagation to the output layer Step 3: Back propagation to the hidden layer Step 4 : Weight updates
The algorithm is stopped when the value of the error function has become sufficiently small.
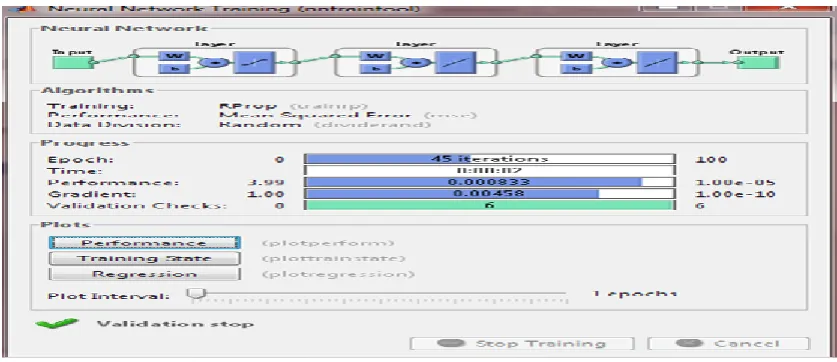
Fig 8 . Neural Network Performance
III. EXPERIMENTAL RESULTS
PEAK SIGNAL TO NOISE RATIO AND MEAN SQUARE ERROR
To establish an objective criterion for digital image quality, a parameter named PSNR (Peak Signal to Noise Ratio) is defined in the following equation.
PSNR = 10*log10 (255*255/MSE) (6) where MSE (Mean Square Error) stands for the mean-squared difference between the cover-image and the stereo-image. The mathematical definition for MSE is defined as follows,
𝑀𝑆𝐸 = 1
𝑀 × 𝑁 𝑎𝑖𝑗 − 𝑏𝑖𝑗 2 𝑁
𝑗 =1 𝑀
𝑖=1
(7)
ISSN (Print) : 2320 – 3765 ISSN (Online): 2278 – 8875
I
nternational
J
ournal of
A
dvanced
R
esearch in
E
lectrical,
E
lectronics and
I
nstrumentation
E
ngineering
(An ISO 3297: 2007 Certified Organization)
Vol. 4, Issue 5, May 2015
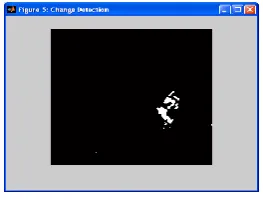
Sensitivity: It measures the proportion of actual positives which are correctly identified
Sensitivity = Tp./(Tp + Fn) (8)
Where,
Tp = True Positive: Number of correctly classified pixels as changed region
Fn = False negative: Number of incorrectly classified pixels as changed region
Fig 9. Change detection
Table 1. Comparison Table
PARAMETERS
UNSUPERVISED CLASSIFIER (Existing Method)
SUPERVISED CLASSIFIER (Proposed Method)
SENSITIVITY 99.6058 99.8115
RMSE 0.0725 0.0505
PSNR 59.5304 61.0981
IV. CONCLUSION
The project presented the Change detection approach for remote sensing satellite images based on an image fusion and a supervised classifier for segmentation. Detection of changed region involved the fusion approach for morphing the two images taken at different time to enhance details of changed region from unchanged region. Here, NSCT decomposition was effectively used to extract the smoothing and contour wedges from images to make pixel level fusion with better efficiency. In this type, an averaging rule and gradient detection were utilized. Here, the changes will be detected using supervised classifier from the fused image with less time. The simulated results shown that generated fused image has less error and segmented changed region with better signal to noise ratio, better sensitivity and accuracy compared to the previous method.
REFERENCES
[1] R. J. Radke, S. Andra, O. Al-Kofahi, and B. Roysam, “Image change detection algorithms: A systematic survey,” IEEE Trans. ImageProcess., vol. 14, no. 3, pp. 294–307, Mar. 2005.
[2] L. Bruzzone and D. F. Prieto, “An adaptive semiparametric and context- based approach to unsupervised change detection in multi-temporal remote-sensing images,” IEEE Trans. Image Process., vol. 11, no. 4, pp. 452–466, Apr. 2002.
Sensitivity: 99.8115 %
Root mean Square Error: 0.0505
ISSN (Print) : 2320 – 3765 ISSN (Online): 2278 – 8875
I
nternational
J
ournal of
A
dvanced
R
esearch in
E
lectrical,
E
lectronics and
I
nstrumentation
E
ngineering
(An ISO 3297: 2007 Certified Organization)
Vol. 4, Issue 5, May 2015
[3] A. A. Nielsen, “The regularized iteratively reweighted MAD method for change detection in multi- and hyperspectral data,” IEEE Trans.Image Process., vol. 16, no. 2, pp. 463–478, Feb. 2007.
[4] F. Bovolo and L. Bruzzone, “A detail-preserving scale-driven approach to change detection in multitemporal SAR images,” IEEETrans. Geosci.Remote Sens., vol. 43, no. 12, pp. 2963–2972, Dec.2005.
[5] F. Chatelain, J.-Y.Tourneret, and J. Inglada, “Change detection in multisensor SAR images using bivariate Gamma distributions,” IEEETrans. Image Process., vol. 17, no. 3, pp. 249–258, Mar. 2008.
[6] E. J. M. Rignot and J. J. Van Zyl, “Change detection techniques for ERS-1 SAR data,” IEEE Trans. Geosci. Remote Sens., vol. 31, no. 4, pp. 896– 906, Jul. 1993.
[7] S. Krinidis and V. Chatzis, “A robust fuzzy local information C-means clustering algorithm,” IEEE Trans. Image Process., vol. 19, no. 5, pp.1328–1337, May 2010.
[8] M. Ahmed, S. Yamany, N. Mohamed, A. Farag, and T. Moriarty, “A modified fuzzy C-means algorithm for bias field estimation and segmentation of MRI data,” IEEE Trans. Med. Imag., vol. 21, no. 3, pp.193–199, Mar. 2002.
BIOGRPHY