Article
A Content-Based Remote Sensing Image Change
Information Retrieval Model
Caihong Ma 1,2, Wei Xia 1,2, Fu Chen 1,*, Jianbo Liu 1, Qin Dai 1, Liyuan Jiang 1,2, Jianbo Duan 1, Wei Liu 1
1 Affiliation 1; [email protected] Institute of Remote Sensing and Digital Earth, Chinese Academy of Sciences, Beijing 100094, China. [email protected] (C. M.); [email protected]; chenfu@@radi.ac.cn (C. F.);
liujb@@radi.ac.cn (J. L.); [email protected] (Q. D.); [email protected] (L. J.); [email protected] (J. D.) ; [email protected] (W. L.)
2 University of Chinese Academy of Sciences, Beijing, 100049,China * Correspondence: [email protected]; Tel.: +86-10-8217-8151
Abstract: With the rapid development of satellite remote sensing technology, the volume of image datasets in many application areas is growing exponentially and the demand for Land-Cover and Land-Use change remote sensing data is growing rapidly. It is thus becoming hard to efficiently and intelligently retrieve the change information that users need from massive image databases. In this paper, content-based image retrieval is successfully applied to change detection and a content-based remote sensing image change information retrieval model is introduced. First, the construction of a new model framework for change information retrieval in a remote sensing database is described. Then, as the target content cannot be expressed by one kind of feature alone, a multiple-feature integrated retrieval model is proposed. Thirdly, an experimental prototype system that was set up to demonstrate the validity and practicability of the model is described. The proposed model is a new method of acquiring change detection information from remote sensing imagery and so can reduce the need for image pre-processing, deal with problems related toseasonal changes as well as other problems encountered in the field of change detection. Meanwhile, the new model has important implications for improving remote sensing image management and autonomous information retrieval.
Keywords: Content-Based Remote Sensing Image Retrieval; Change Information Detection; Information Management; Remote Sensing Data Service
1. Introduction
Land-Cover (LC) and Land-Use (LU) (also referred to as LULC) change can be associated with varying rates of change of one of the Earth’s surface components. However, with human activity increasing, the Earth’s surface has been modified significantly in recent years by various kinds of land cover changes1-2 [1, 2]. Given its large number of practical applications, including monitoring deforestation, agricultural expansion and intensification, damage assessment, disaster monitoring, urban expansion monitoring, city planning, and land-resource management [1, 3], knowledge of LULC changes is needed in many fields. Satellite images have long been the primary and most important source of data for studying different kinds of land cover changes due to the long periods for which consistent measurements are available and high spatial resolution of the imagery [4, 5]. With the rapid development of remote sensing technology and the increasing variety of Earth observation satellites, the volume of data in satellite image datasets is growing exponentially (Datcu et al. 2005) [6]. However, limited by data processing and analysis capacity, mass data organization and management lag far behind the explosive increase in the amount of remote sensing imagery.
Therefore, one of most challenging emerging applications is how to efficiently and precisely access change information data from such archives based on users' needs.
The state-of-the-art systems for accessing change information original images acquisition still rely on the use of keywords or metadata such as geographical coordinates, data acquisition time and sensor type [7], along with prior knowledge of the target change events. The performance of keyword matching-based retrieval approaches is highly dependent on the completeness of the prior knowledge. In order to provide consistent data that can be used to derive land cover information as well as geophysical and biophysical products for regional assessment of surface dynamics and to study the functioning of Earth systems, new data service systems have been proposed. These include the NASA-funded Web-enabled Landsat Data [8] project that systematically generated 30-m composited Landsat Enhanced Thematic Mapper Plus (ETM+) mosaics of the conterminous United States and Alaska from 2002 to 2012, the Australian Geoscience DATA CUBE framework [9,10], and ChangeMatters [11] founded by Esri’s ArcGIS Server Image Extension, which accesses the USGS and NASA created 34,000 scenes of Global Land Survey (GLS) Landsat imagery, comprising of worldwide imagery from the 1970s, 1990s, 2000 and 2005. However, the geographical area covered by the remote sensing imagery used by the above-mentioned services is small and the available products are limited by the universality of the algorithms used to produce them. Also, as extensions of the keyword/metadata approach, they cannot accurately be applied to all the different change application areas actually required by users.
In contrast to the keyword-to-find-image approach, content-based image retrieval (CBIR) is a major advance that aims to search images using visual features that are similar to those of the query image submitted by the user. This technqiue uses a description of the image consisting of automatically extracted visual features such as color, texture and shape. After a user submits one or more query images, the images in the database are ranked according to their similarity with the query images and the most similar images are returned to the user [12, 26, 27]. This efficient method of managing and utilizing the information contained in an image database from the viewpoint of comprehension of the image content provides a new opportunity to solve the problem of information management in a large remote sensing image database [7,13]. Therefore, content-based remote sensing image retrieval (CBRSIR) is a topic that has attracted the attention of scholars around the world. It will become particularly important in the next decade when the number of acquired remote sensing images will again dramatically increase. Feature extraction is fundamental to content-based image retrieval. In the remote sensing literature, several primitive features for characterizing and describing images for retrieval purposes have been presented; these include the fuzzy color histogram [14], the integrated color histogram [15], the Gray Level Cooccurrence Matrix (GLCM)[16], the fast wavelet [17] and visual salient point features [18]. Most studies have focused mainly on methods with different visual features and their effects on CBRSIR [18, 28]. However, on its own, one type of feature cannot always express the image content precisely and perfectly [20] and it is hard to attain satisfactory retrieval results using a single feature. So, in this paper, the multi-features integrated retrieval model is proposed, in which the main colour and texture features of remote sensing image proposed by the present researcher are included, to improve the image retrieval by using multi-features.
makes two general improvements to the existing content-based remote sensing image retrieval models. First, the structure and framework of the content-based retrieval of remote sensing image change information is built. In addition, an experimental prototype system is set up to demonstrate the validity and practicability of this model. Secondly, the multiple-feature integrated retrieval model is proposed − this model uses three types of color feature and four types of texture feature to improve the retrieval of change information from remote sensing imagery. The new model is a new mode of acquiring change information from remote sensing imagery and can reduce the need to carry out image pre-processing. It can also overcome problems related to seasonal changes and other factors that affect change detection and, thereby, meet the needs of many different kinds of user. Meanwhile, the new model has important implications for improving remote sensing image management and autonomous information retrieval.
The remainder of this article is organized as follows. Section 2 describes the study data and the main data processing steps. Section 3 describes the content-based remote sensing image change information retrieval model in detail. Section 4 presents the experimental results that were obtained using a remote sensing imagery dataset. Conclusions are drawn in section 5 along with recommendations for future research.
2. Data and Study area
2.1. Study area
The study area was located in Beijing, China (as shown in Figure 1). Due to the growth of the city and its outward expansion into the surrounding rural areas, the city of Beijing has received a lot of attention from researchers in recent years [21]. The study area itself includes all of the urban, much of the suburban and parts of the rural districts of Beijing. Beijing was selected as the study area because: (1) it made field visits easy; (2) as a national capital, Beijing (formerly romanized as Peking) is undergoing unprecedented urban growth; (3) the study area includes a wide variety of land cover change types that provide many prime examples of the land-cover/land-use changes currently occurring in China. These changes include extensive urbanization, water resource changes and vegetation/cultivated land degradation.
(a) (b) (c)
Figure 1. Maps showing administrative areas and terrain: (a) the geographical location of Beijing, China; (b) political map of Beijing; (c) topographic map of Beijing derived from Landsat 5 data
2.2. Landsat Data
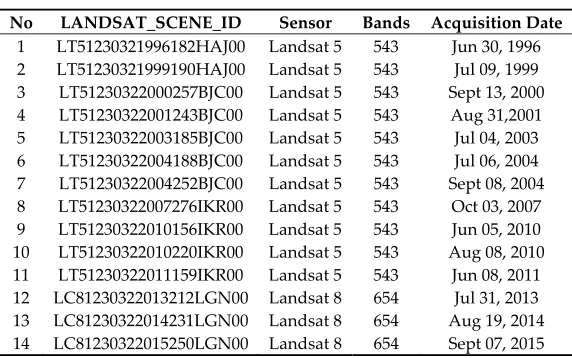
Table 1. RS Image information
No LANDSAT_SCENE_ID Sensor Bands Acquisition Date 1 LT51230321996182HAJ00 Landsat 5 543 Jun 30, 1996 2 LT51230321999190HAJ00 Landsat 5 543 Jul 09, 1999 3 LT51230322000257BJC00 Landsat 5 543 Sept 13, 2000 4 LT51230322001243BJC00 Landsat 5 543 Aug 31,2001 5 LT51230322003185BJC00 Landsat 5 543 Jul 04, 2003 6 LT51230322004188BJC00 Landsat 5 543 Jul 06, 2004 7 LT51230322004252BJC00 Landsat 5 543 Sept 08, 2004 8 LT51230322007276IKR00 Landsat 5 543 Oct 03, 2007 9 LT51230322010156IKR00 Landsat 5 543 Jun 05, 2010 10 LT51230322010220IKR00 Landsat 5 543 Aug 08, 2010 11 LT51230322011159IKR00 Landsat 5 543 Jun 08, 2011 12 LC81230322013212LGN00 Landsat 8 654 Jul 31, 2013 13 LC81230322014231LGN00 Landsat 8 654 Aug 19, 2014 14 LC81230322015250LGN00 Landsat 8 654 Sept 07, 2015
3. Methods
This study was a “prototype” for content-based remote sensing image change information retrieval using times-series of Landsat data of Beijing. Testing this approach for other regions with different environments will be a future research direction. The new model has three components: remote sensing image preprocessing and data archiving, content-based remote sensing image change information retrieval and assessment criteria.
3.1. Remote Sensing Image Preprocessing and Data Archiving
The remote sensing image preprocessing and data archiving consisted of four parts: image preprocessing, image decomposition based on Quin+-tree [22], feature extraction from pairs of remote sensing images, and content-based remote sensing image change information retrieval.
3.1.1 Image Preprocessing
Image preprocessing for change information retrieval consists of two steps: false-color composition and coarse geographic registration. Because of the low resolution of Landsat images and the small number of gray levels that the images contain, it is hard to distinguish between different ground objects using only the naked eye. Researchers have found that the human eye can recognize 30 to 40 gray-scale levels. However, the human eye is also sensitive to color, being able to distinguish between hundreds or even thousands of different colors. In order to improve the identification of natural and man-made objects, and especially to improve the effectiveness of the change information retrieval, false-color composition was used in this study. This meant that Landsat imagery, bands 5, 4 and 3 were assigned to R(red), G(green), and B(blue) to make false color composites. For the Landsat 8 imagery, bands 6, 5 and 4 were used for the corresponding colors. And, to maintain images consistency, the false-color images from Landsat 8 imageries were scaled to 256 gray-scale levels, same as images from Landsat 5 imageries.
comparing with classic change detection methods; However, coarse geographic registration was used to define the latitude and longitude of the corners of the image pair. Given the requirement of Gaussian coordinate transformation and the structure of the USGS data collection, it cannot be guaranteed that the corners of Landsat Level-1 products have the same latitudes and longitudes, even for the same path/row. Therefore, sub-regions (defined as having corners with Gaussian coordinates [418564, 437821; 539737, 4526184]) were cropped from the original scenes.The images cropped from a pair of TM false-color images acquired in 2013 and 2015 are shown in Figure 2.
(a) (b)
Figure 2. Cropped images extracted from a 2013/2015 TM false-color pair: (a) Scene 1 (Jul 31, 2013); (b) Scene 2 (Sept 07, 2015)
3.1.2 Image Decomposition based on Quin+-tree
The diversity and complexity of remote sensing images and the enormous data volume produce big challenges for the effective retrieval of information from remote sensing image databases. A satellite remote sensor collects ground surface data from a distance, meaning that the acquired image represents a broad scene that contains many ground objects. However, for many practical applications, users are often only interested in part of the scene or particular objects, such as those with military significance, infrastructure construction those related to ground resources. Therefore, important small-scale objects and particular regions of remote sensing images attract more attention than the images as a whole. The result is that remote sensing images are almost always sliced into small pieces 7]. In this paper, the Quin+-tree [22] method was adopted to decompose scenes. A size of 128*128 pixels was considered an appropriate choice for the resulting pieces [22], which meant that each cropped image was sliced into 2288 small pieces.
As the cropped images covered the same areas after preprocessing, the small images with the same decomposition number acquired at different times also covered the same areas. Pairs of small images containing change information were thus formed. In this paper, we refer to the older image in the pair as the before image and the more recent image as the after image. The image pairs were organized by algorithm of full permutation of their data acquisition methods. Assuming there were three images with same geographic location but different time phases, such as time A, B,C, then there are 3 pairs of small images, as A->B, A->C and B->C. So, 151008 pairs of small images containing change information were formed.
3.1.3 Feature Extraction from Pairs of Remote Sensing Images
surrounding environment. In this paper, therefore, three color features and four texture features were extracted from remote sensing images. In the color feature extraction, the color correlogram [23], color moments and HSV-HIST histogram [24], were used. In the texture feature extraction, Fast wavelet [17], In-moments, GLCM and Texture Spectrum [16] were adopted.
As shown in Table 2, a 423-dimensional feature vector was used to represent the content of one remote sensing image consisting of seven descriptors. In order to prevent numerical difficulties in the calculation and feature values in higher numerical ranges from dominating those in smaller numerical ranges, the seven categories of feature descriptors were normalized by being scaled to a range of [0, 1]. An 846-dimensional change feature vector was then ordered by feature vectors on the basis of the before and after images in a pair.
Table 2. Description of the feature vector
Colour Feature Number of dimensions Texture Feature Number of dimensions
Colour Correlogram 256 Fast wavelet 20
Colour Moments 9 In-moments 7
HSV-HIST 72 GLCM 8
Texture Spectrum 51
3.1.4 Remote Sensing Image Preprocessing and Data Archiving
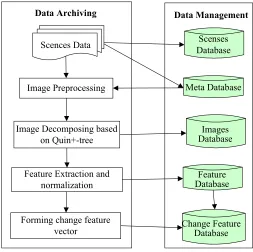
In order to allow complete change information results to be successfully retrieved, each new remote sensing scene should be preprocessed and archived to the database. The main steps in the remote sensing image scene preprocessing and data archiving procedure are shown in Figure 3.
Data Management Data Archiving
Image Preprocessing
Image Decomposing based on Quin+-tree
Feature Extraction and normalization
Meta Database Scenses Database
Images Database
Change Feature Database Forming change feature
vector Scences Data
Feature Database
Figure. 3. Flow chart for the remote sensing image scene preprocessing and data archiving
The main steps are as follows.
1. Parsing the metadata from the scene itself and any accompanying metadata files and archiving the scene and the metadata to the database;
3. Image decomposition based on Quin+-tree. The remote sensing images are sliced into 128*128 pixel pieces and the pieces then archived to the image database;
4. Extracting the feature vector for each image piece. The values are scaled to the range [0, 1] and the feature vectors archived to the feature database;
5. Forming pairs of change feature vectors. Overlapping images are registered to pairs and then the change feature vectors are organized according to the more recent image after the older one in pair. Finally, the change feature vectors are archived to the change feature database.
3.2. Content-Based Remote Sensing Image Change Information Retrieval
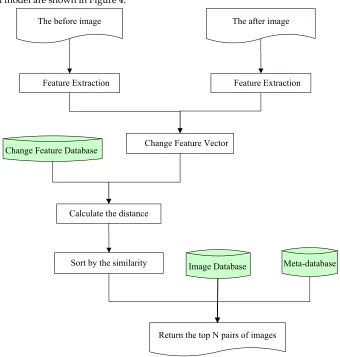
The main procedures included in the content-based remote sensing image change information retrieval model are shown in Figure 4.
Change Feature Database
Calculate the distance
Sort by the similarity
Return the top N pairs of images Change Feature Vector
The before image
Feature Extraction
Image Database Meta-database The after image
Feature Extraction
Figure 4. The architecture of the content-based remote sensing image change information retrieval model
As shown in figure 4, the main processing steps in the new change model are as follows.
1. Input the target pair of query images − the before and after images.
2. Extract the feature vectors for both images in the target pair and scale the values to the range [0, 1].
4. Calculate the distance between the change feature vector of the target pair of images and the change feature database. The Euclidean distance is used for this.
5. Sort the similarity between the change feature vector of the target pair of images and the change feature database
6. Return the top N similar pairs of images. In our experiment, the value of N was 12.
3.3. Assessment Criteria
Evaluation of retrieval performance is a crucial step in content-based remote sensing image retrieval. Many different methods for measuring the performance of a system have been created and used by researchers. We used the most common evaluation methods namely recall (or sensitivity) and precision (or specificity).
3.3.1 Coverage Ratio
Traditionally, the recall, precision and recall-precision break-even point have been the methods most commonly used to assess the effectiveness of retrieval models. However, Schapire et al. [25] gave very reasonable arguments as to why these conventional evaluation metrics are not very informative for users of a CBIR system. In particular, the recall index cannot be calculated by the user until all relevant images have been seen by the user, which is not possible except by means of an exhaustive search. As the user cannot know how well the image retrieval search is going [7], the coverage ratio, which can be applied to remote sensing image retrieval, was used as the performance metric in this study. This ratio can be calculated as in Eq.(1) below:
(10i R), 10
cov
(10i > R)
i i R R n i erage ratio n R ≤ = (1)
where Ris the total number of relevant images in the image database and nRiis the number
of relevant images returned in the top 10iimages. When the value of 10i<R, the coverage ratio is the same as the precision; when the value of 10i>R, the coverage ratio is the same as the recall. In this study, i was set to {1,2,3,4,5,10,20 }.
3.3.2 Mean Average Precision
Precision and recall-precision are single-value metrics that are based on the whole set of images returned by the retrieval system. For systems that return a ranked image sequence, it is desirable to also consider the order in which the returned images are presented. The average precision index ranks the more relevant images more highly. This index is equal to the average of the precisions calculated for each of the relevant images in the ranked sequence. The mean average precision for a set of queries is the mean of the average precision scores for each query. It is calculated as:
1
1
Nss
r
s r
M a p
N
ρ
ρ
==
(2)where r is the rank, Nr denotes the number of relevant images returned, NS represents the
number of real relevant images returned,
ρ
r is the rank num in the relevant images that arereturned and
ρ
s is the rank num in the real relevant images that are returned.4. Results
of the new model using multiple features, our experiments were divided into three groups. Group1 described the remote sensing images using 9 kinds of features to compare the change information retrieval performance using the multiple features with the other features described in section 4.1. Group 2 compared the retrieval performances obtained using different features for different types of ground object changes. Group 3 showed some change information retrieval examples using the content-based remote sensing image change information retrieval model with different features.
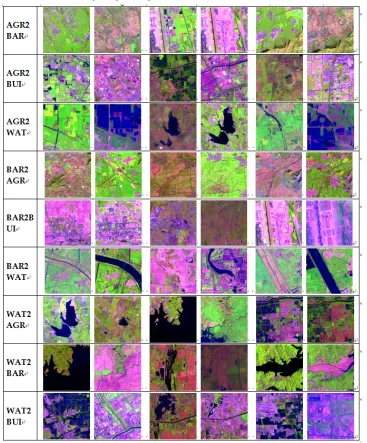
Figure 5. Remote sensing database: samples of three pair of images for each of the 9 change classes
experimental remote sensing image database. There were 161, 295, 67, 194, 44, 42, 149, 103 and 137 pairs of images, respectively, in the classes listed. Figure 5 shows three sample pairs of images for each of the 9 change classes. It should be noted that Beijing has undergone unprecedented urban growth in the past three decades and the length of time between the demolition of buildings and the construction of new ones is very short. In addition, the spatial resolution of the Landsat satellites is relatively low. This means that it is difficult to capture the change from built-up land to other ground objects and so there were no data corresponding to the changes BUI2AGR (Built-up Land to Agricultural Land/Vegetation), BUI2BAR (Built-up Land to Bare Land) and BUI2WAT (Built-up Land to Water).
4.1. Comparision of Different Features
In the unified framework of our proposed content-based remote sensing image change information retrieval method, different feature combinations were tested for demonstrating the effectiveness of combined color and texture features. In this experiment, the Color correlogram, Color moments, HSV-HIST, Fast wavelet, In-moments, GLCM and Texture Spectrum were exploited to represent the change content. Multi-Color, Multi-Texture and Multi-all produce hybrid multiple features by combining three categories of color feature, four categories of texture feature and seven categories of color and texture features, respectively. Altogether, nine comparison tests were made.
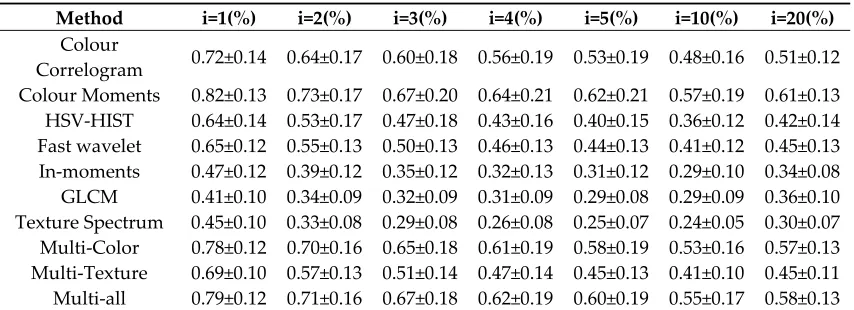
Table 3.Comparison of different methods: Coverage Rate
Method i=1(%) i=2(%) i=3(%) i=4(%) i=5(%) i=10(%) i=20(%)
Colour
Correlogram 0.72±0.14 0.64±0.17 0.60±0.18 0.56±0.19 0.53±0.19 0.48±0.16 0.51±0.12 Colour Moments 0.82±0.13 0.73±0.17 0.67±0.20 0.64±0.21 0.62±0.21 0.57±0.19 0.61±0.13
HSV-HIST 0.64±0.14 0.53±0.17 0.47±0.18 0.43±0.16 0.40±0.15 0.36±0.12 0.42±0.14 Fast wavelet 0.65±0.12 0.55±0.13 0.50±0.13 0.46±0.13 0.44±0.13 0.41±0.12 0.45±0.13 In-moments 0.47±0.12 0.39±0.12 0.35±0.12 0.32±0.13 0.31±0.12 0.29±0.10 0.34±0.08
GLCM 0.41±0.10 0.34±0.09 0.32±0.09 0.31±0.09 0.29±0.08 0.29±0.09 0.36±0.10 Texture Spectrum 0.45±0.10 0.33±0.08 0.29±0.08 0.26±0.08 0.25±0.07 0.24±0.05 0.30±0.07
Multi-Color 0.78±0.12 0.70±0.16 0.65±0.18 0.61±0.19 0.58±0.19 0.53±0.16 0.57±0.13 Multi-Texture 0.69±0.10 0.57±0.13 0.51±0.14 0.47±0.14 0.45±0.13 0.41±0.10 0.45±0.11
Multi-all 0.79±0.12 0.71±0.16 0.67±0.18 0.62±0.19 0.60±0.19 0.55±0.17 0.58±0.13
Table 4. Comparison of different methods: Mean Average Precision value.
Method i=1(%) i=2(%) i=3(%) i=4(%) i=5(%) i=10(%) i=20(%)
Color Correlogram 0.91±0.06 0.84±0.08 0.80±0.10 0.76±0.11 0.74±0.11 0.66±0.13 0.58±0.14 Color Moments 0.94±0.04 0.89±0.06 0.86±0.07 0.83±0.09 0.81±0.10 0.74±0.12 0.66±0.14
HSV-HIST 0.88±0.04 0.80±0.05 0.74±0.06 0.70±0.08 0.67±0.09 0.57±0.10 0.48±0.11 Fast wavelet 0.89±0.04 0.80±0.05 0.74±0.07 0.70±0.07 0.67±0.07 0.58±0.08 0.50±0.09 In-moments 0.85±0.05 0.72±0.06 0.66±0.07 0.61±0.07 0.58±0.08 0.48±0.08 0.40±0.09
GLCM 0.82±0.05 0.69±0.06 0.61±0.07 0.56±0.07 0.53±0.07 0.42±0.07 0.36±0.07 Texture Spectrum 0.86±0.06 0.74±0.08 0.66±0.08 0.60±0.08 0.56±0.07 0.43±0.05 0.34±0.05
Multi-Color 0.93±0.05 0.87±0.07 0.84±0.08 0.81±0.08 0.79±0.09 0.70±0.12 0.63±0.13 Multi-Texture 0.89±0.03 0.82±0.04 0.77±0.05 0.73±0.06 0.70±0.07 0.61±0.08 0.53±0.08
Multi-all 0.94±0.05 0.89±0.07 0.85±0.08 0.83±0.08 0.80±0.09 0.72±0.12 0.64±0.13
ratios and mean average precisions were higher than those obtained for single texture features. Better results were also obtained using Multi-Color than for any of the single color features except Color Moments. In addition, the values obtained using Multi-all were higher than those for Multi-Color and Multi-Texture.
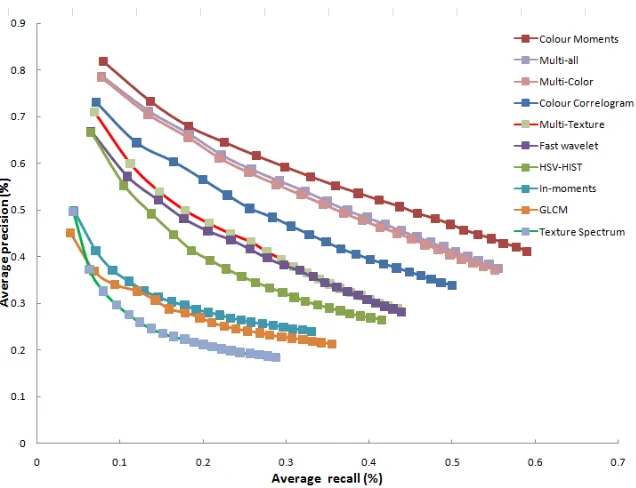
Figure. 6. Comparison of the average PVR curve for different methods
Figure 6 shows the precision–recall graphs for the different methods obtained using 20 trials per category (giving at total of 180 trials) when i was set to {1, 2, 3, ..., 20}. As shown in figure 6, the change information retrieval results based on the Color Moments method again outperformed the other methods in terms of the precision-to-recall ratio. Also, the results based on Multi-all were better than those for the other 8 methods.
It is important to note that the change information retrieval results based on the Color Moments method had the highest coverage ratios and mean average precision and also the best performance in terms of precision to-recall ratio. However, this does not mean that the use of this method will necessarily produce good results using other databases as a single feature cannot always express the image content precisely and perfectly.
4.2. Comparative performance of different features for different retrieval cases
Table 5. Comparison of coverage rates obtained using different methods and 9 types of ground change classes (i=2).
Method AGR2
BAR AGR2 BUI AGR2 WAT BAR2 AGR BAR2 BUI BAR2 WAT WAT2 AGR WAT2 BAR WAT2 BUI
Color Correlogram 0.88±0.21 0.68±0.22 0.62±0.30 0.82±0.30 0.36±0.19 0.47±0.22 0.58±0.26 0.49±0.23 0.83±0.12 Color Moments 0.92±0.15 0.77±0.24 0.71±0.31 0.93±0.17 0.43±0.24 0.49±0.21 0.70±0.26 0.72±0.28 0.90±0.13 HSV-HIST 0.57±0.23 0.48±0.21 0.76±0.28 0.46±0.16 0.24±0.14 0.34±0.13 0.47±0.12 0.68±0.22 0.77±0.11 Fast wavelet 0.65±0.25 0.60±0.20 0.61±0.29 0.67±0.21 0.26±0.13 0.50±0.20 0.41±0.17 0.63±0.26 0.61±0.22 In-moments 0.55±0.29 0.45±0.26 0.47±0.28 0.50±0.26 0.21±0.08 0.16±0.10 0.36±0.15 0.42±0.22 0.40±0.23 GLCM 0.38±0.21 0.34±0.13 0.47±0.27 0.29±0.13 0.16±0.07 0.27±0.12 0.35±0.20 0.48±0.28 0.33±0.20 Texture Spectrum 0.34±0.14 0.35±0.10 0.32±0.21 0.35±0.12 0.22±0.11 0.23±0.10 0.31±0.13 0.36±0.22 0.53±0.12 Multi-Colour 0.90±0.22 0.71±0.21 0.77±0.28 0.82±0.25 0.40±0.19 0.48±0.14 0.63±0.22 0.71±0.25 0.86±0.11 Multi-Texture 0.64±0.21 0.60±0.22 0.68±0.30 0.67±0.18 0.30±0.13 0.46±0.26 0.46±0.17 0.61±0.30 0.74±0.20 Multi-all 0.91±0.23 0.73±0.21 0.77±0.29 0.84±0.25 0.41±0.19 0.49±0.15 0.65±0.22 0.74±0.25 0.88±0.10
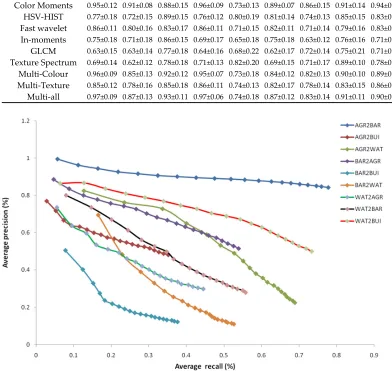
Table 6. Comparison of different methods: Mean Average Precision for 9 kinds of ground change classes (i=2).
Method AGR2 BAR AGR2 BUI AGR2 WAT BAR2 AGR BAR2 BUI BAR2 WAT WAT2 AGR WAT2 BAR WAT2 BUI Colour Correlogram 0.95±0.09 0.82±0.18 0.87±0.12 0.97±0.05 0.68±0.15 0.84±0.14 0.80±0.15 0.78±0.15 0.88±0.12
Color Moments 0.95±0.12 0.91±0.08 0.88±0.15 0.96±0.09 0.73±0.13 0.89±0.07 0.86±0.15 0.91±0.14 0.94±0.08 HSV-HIST 0.77±0.18 0.72±0.15 0.89±0.15 0.76±0.12 0.80±0.19 0.81±0.14 0.74±0.13 0.85±0.15 0.83±0.14 Fast wavelet 0.86±0.11 0.80±0.16 0.83±0.17 0.86±0.11 0.71±0.15 0.82±0.11 0.71±0.14 0.79±0.16 0.83±0.13 In-moments 0.75±0.18 0.71±0.18 0.86±0.15 0.69±0.17 0.65±0.18 0.75±0.18 0.63±0.12 0.76±0.16 0.71±0.18 GLCM 0.63±0.15 0.63±0.14 0.77±0.18 0.64±0.16 0.68±0.22 0.62±0.17 0.72±0.14 0.75±0.21 0.71±0.18 Texture Spectrum 0.69±0.14 0.62±0.12 0.78±0.18 0.71±0.13 0.82±0.20 0.69±0.15 0.71±0.17 0.89±0.10 0.78±0.15 Multi-Colour 0.96±0.09 0.85±0.13 0.92±0.12 0.95±0.07 0.73±0.18 0.84±0.12 0.82±0.13 0.90±0.10 0.89±0.09 Multi-Texture 0.85±0.12 0.78±0.16 0.85±0.18 0.86±0.11 0.74±0.13 0.82±0.17 0.78±0.14 0.83±0.15 0.86±0.10 Multi-all 0.97±0.09 0.87±0.13 0.93±0.11 0.97±0.06 0.74±0.18 0.87±0.12 0.83±0.14 0.91±0.11 0.90±0.09
Figure 7 shows the precision–recall graphs for different ground change classes obtained using the Multi-all method and 20 trials per category. i was set to {1,2,3,...,20}, resulting in a total of 180 trials using the remote image database. As shown in figure 7, using this method, the change information retrieval results for the AGR2BAR change class were the best; the method also produced good results for WAT2BUI, BAR2AGR, AGR2WAT and WAT2BAR. The worst performance was for the BAR2BUI change class. These results show that it is hard to attain satisfactory retrieval results for all change classes using a single combined features model.
4.3. Search examples
To illustrate the effectiveness of our approach for querying target pairs of remote sensing images, we provide here some screenshots obtained from our new data service system using the remote sensing images archive. Figure 8, showed a typical query pair of “WAT2BUI” images (Figure 8(a)) and the corresponding images retrieved using the proposed method based on the Multi-all feature. The order of the retrieval of the image pairs was as shown in Figure 8(b). Figure 9 shows a typical query pair of “BAR2BUI” images (Figure 9(a)) and the corresponding images retrieved using the proposed method based on Color Moments. From these figures, it can be seen that, using multiple features, the new method produces promising results.
(a)
(b)
(a)
(b)
Figure 9 Query by example: looking for "BAR2BUI" (bare land to Beijing airport) in a database of remote sensing images. (a) The target pair of query images. (b) Pairs of images retrieved using the proposed method based on Color Moments. The top 12 most similar pairs of images are shown.
5. Conclusions
With the rapid development of remote sensing technology and the increasing variety of Earth observation satellites that have been successfully launched, the volume of image datasets is growing exponentially in many application areas. The demand for LULC remote sensing data from all walks of life is also growing rapidly. As the existing knowledge based on a priori knowledge plus the keyword/metadata remote sensing data service model cannot meet the related challenges, content-based remote sensing image retrieval technology is being introduced to extract a variety of change information from remote sensing data. In this paper, the use of content-based remote sensing image change information retrieval (CBRSICIR) was proposed. This new model includes two main innovations.
1. The new model includes a wholly new way of accessing change information in remote sensing imagery and effectively uses the low-level features of the images. It can overcome the problems that arise due to the same type of object having different spectra. It can also meet the different needs that users have in terms of extracting change information from remote sensing imagery. At the same time, the new model greatly reduces the image preprocessing requirements, which means that it can be applied globally using full time-series of data, thereby improving the standard and efficiency of remote sensing information services.
it also means that feature selection for different kinds of changes in ground objects will be possible in the future.
As a future development of this work, we plan to extend the validation of the proposed new method to larger data sets. In addition, to bridge the semantic content between the low-level and high-level features, some pre-learning mechanism and relevance feedback (RF) methods will be introduced to improve the retrieval performance for different ground change classes.
Acknowledgments: The development of the HY-2A CAPF project was supported by the NSOAS and SOA. Additional funding was provided by “Research on the model of remote sensing disaster monitoring and assessment based on crowdsourcing” project(Y6SJ2700CX), Institute of Remote Sensing and Digital Earth, Chinese Academy of Sciences. And we thank U.S. Geological Survey a lot for providing Landsat 5 and Landsat 8 remote sensing images of Beijing.
Author Contributions: Fu Chen conceived and designed the experiments; Wei Xia built the experimental platform; Liyuan Jiang prepared and processed the remote sensing data; Caihong Ma designed and performed the experiments, analyzed the data and wrote the paper; Jianbo Liu, Qin Dai and Jianbo Duan supervised the research; and Wei Liu and Wei Xia gave comments and revised the manuscript.
Conflicts of Interest: The authors declare no conflict of interest.
Abbreviations
The following abbreviations are used in this manuscript:
AGR2BAR Agricultural/Vegetation Land to Bare Land AGR2BUI Agricultural/Vegetation Land to Building Land AGR2WAT Agricultural/Vegetation Land to Water
BAR2AGR Bare Land to Agricultural/Vegetation Land BAR2BUI Bare Land to Building Land
BAR2WAT Bare Land to Water
BUI2AGR Building Land to Agricultural/Vegetation Land BUI2BAR Building Land to Bare Land
BUI2WAT Building Land to Water
CBIR Content-based Image Retrieval
CBRSIR Content-based Remote Sensing Image Retrieval CD Change Detection
GLCM Gray Level Cooccurrence Matrix GLS Global Land Survey
HSV-HIST HSV-HIST histogram
LC Land-Cover
LU Land-Use
LULC Land-Cover and Land-Use
NASA National Aeronautics and Space Administration RS Remote Sensing
RF Relevance Feedback USGS United States Geological Survey WAT2AGR Water to Agricultural/Vegetation Land WAT2BAR Water to Bare Land
WAT2BUI Water to Building Land
WELD Web-enabled Landsat Data System WRS Worldwide Reference System
References
2. Roy, M.; Ghosh, S.; Ghosh, A. A novel approach for change detection of remotely sensed images using semi-supervised multiple classifier system. Information Sciences 2014, 269, 35-47.
3. Hussain, M.; Chen, D.; Cheng, A.; Wei, H.; Stanley, D. Change detection from remotely sensed images: From pixel-based to object-based approaches. Isprs Journal of Photogrammetry & Remote Sensing 2013, 80, 91-106.
4. Olson, G.A.; Cheriyadat, A.; Mali, P.; O'Hara, C.G. In Detecting and managing change in spatial data-land use and infrastructure change analysis and detection, Geoscience and Remote Sensing Symposium, 2004. IGARSS '04. Proceedings. 2004 IEEE International, 2004; pp 729-734.
5. Zhu, Z.; Woodcock, C.E. Continuous change detection and classification of land cover using all available landsat data. Remote Sensing of Environment 2014, 144, 152-171.
6. Datcu, M.; Seidel, K. In Human centered concepts for exploration and understanding of images, Advances in Techniques for Analysis of Remotely Sensed Data, 2003 IEEE Workshop on, 2005; pp 52 - 59.
7. Ma, C.; Dai, Q.; Liu, J.; Liu, S.; Yang, J. An improved svm model for relevance feedback in remote sensing image retrieval. International Journal of Digital Earth 2014, 7, 725-745.
8. Web-enabled landsat data. Available online: https://weld.cr.usgs.gov/
9. Lewis, A.; Lymburner, L.; Purss, M.B.J.; Brooke, B.; Evans, B.; Ip, A.; Dekker, A.G.; Irons, J.R.; Minchin, S.; Mueller, N. Rapid, high-resolution detection of environmental change over continental scales from satellite data – the earth observation data cube. International Journal of Digital Earth 2015, 9, 1-6.
10. CUBE, T.A.G.D. A world-leading data analysis environment for satellite and other earth observations. http://www.datacube.org.au/
11. Changematters-infrared. Available online: http://changematters.esri.com/compare
12. Marakakis, A.; Galatsanos, N.; Likas, A.; Stafylopatis, A. Combining gaussian mixture models and support vector machines for relevance feedback in content based image retrieval. Springer US: 2009; p 249-258.
13. Zhang, N. Research on key techniques of content-based optical remote sensing image retrieval. 2008. 14. Han, J.; Ma, K.K. Fuzzy color histogram and its use in color image retrieval. IEEE Transactions on Image
Processing A Publication of the IEEE Signal Processing Society 2002, 11, 944.
15. Hsu, W.; Chua, S.T.; Pung, H.H. In An integrated color-spatial approach to content-based image retrieval, ACM International Conference on Multimedia '95, San Francisco, Ca, Usa, November, 1995; pp 305-313. 16. Ojala, T.; Pietik; Inen, M.; Topi. Multiresolution gray-scale and rotation invariant texture classification with local
binary patterns. Springer Berlin Heidelberg: 2000; p 404-420.
17. Cheng, Q.M. Research on key technologies for content based retrieval from remote sensing image database. 2004.
18. Wang, X.; Shao, Z.; Zhou, X.; Liu, J. A novel remote sensing image retrieval method based on visual salient point features. Sensor Review 2014, 34, 349-359.
19. Zhao, L.; Tang, J.; Yu, X.; Li, Y.; Mi, S.; Zhang, C. Content-based remote sensing image retrieval using image multi-feature combination and svm-based relevance feedback. Lecture Notes in Electrical Engineering 2012, 124, 761-767.
20. Wang, X.Y.; Yang, H.Y.; Li, D.M. A new content-based image retrieval technique using color and texture information. Pergamon Press, Inc.: 2013; p 746-761.
22. LI Deren, N.X. A new image decomposition method for content-based remote sensing image retrieval. GEOMATICS AND INFORMATION SCIENCE OF WUHAN UNIVERS 2006, 31, 659-662.
23. Huang, J.; Kumar, S.R.; Mitra, M.; Zhu, W.J.; Zabih, R. In Image indexing using color correlograms, Conference on Computer Vision and Pattern Recognition, 1997; p 762.
24. Liu, Z.; Zhang, Y. Color image retrieval using local accumulative histogram. Journal of Image & Graphics 1998.
25. Schapire R E, Singer Y, Singhal A. Boosting and Rocchio applied to text filteringInternational ACM SIGIR Conference on Research and Development in Information Retrieval. ACM, 1998; p. 215-223.
26. Datcu, M., Daschiel, H., Pelizzari, A., Quartulli, M., Galoppo, A., & Colapicchioni, A., et al. Information mining in remote sensing image archives: system concepts. IEEE Transactions on Geoscience & Remote Sensing,200343(1), 188-199.
27. Molinier, M., Laaksonen, J., & Hame, T. Detecting man-made structures and changes in satellite imagery with a content-based information retrieval system built on self-organizing maps. IEEE Transactions on Geoscience & Remote Sensing,2007, 45(4), 861-874.