University of Windsor University of Windsor
Scholarship at UWindsor
Scholarship at UWindsor
Electronic Theses and Dissertations Theses, Dissertations, and Major Papers
3-24-2019
Electron Biomolecule Collisions
Electron Biomolecule Collisions
Joshuah Anthony Trocchi
University of Windsor
Follow this and additional works at: https://scholar.uwindsor.ca/etd
Recommended Citation Recommended Citation
Trocchi, Joshuah Anthony, "Electron Biomolecule Collisions" (2019). Electronic Theses and Dissertations. 7660.
https://scholar.uwindsor.ca/etd/7660
This online database contains the full-text of PhD dissertations and Masters’ theses of University of Windsor students from 1954 forward. These documents are made available for personal study and research purposes only, in accordance with the Canadian Copyright Act and the Creative Commons license—CC BY-NC-ND (Attribution, Non-Commercial, No Derivative Works). Under this license, works must always be attributed to the copyright holder (original author), cannot be used for any commercial purposes, and may not be altered. Any other use would require the permission of the copyright holder. Students may inquire about withdrawing their dissertation and/or thesis from this database. For additional inquiries, please contact the repository administrator via email
Electron Biomolecule Collisions
By
Joshuah Anthony Trocchi
A Thesis
Submitted to the Faculty of Graduate Studies
through the Department of Physics
in Partial Fulfillment of the Requirements for
the Degree of Master of Science
at the University of Windsor
Windsor, Ontario, Canada
2019
Electron Biomolecule Collisions
by
Joshuah A. Trocchi
APPROVED BY:
R. Schurko
Department of Chemistry and Biochemistry
S. Rehse
Department of Physics
J.W. McConkey, Advisor
Department of Physics
Declaration of Co-authorship /
Previous Publication
I. Co-Authorship.
I hereby declare that this thesis incorporates material that is result of joint research, as
follows:
I acknowledge my supervisor, Dr. J.W. McConkey, for his contributions to the writing of
this thesis, including edits and suggestions on the degree of discussion present in this work.
I also acknowledge J. Hein who designed the biomolecule oven used in this work and was
a post-doctoral fellow under the supervision of Dr. J.W. McConkey. Also, some diagrams
he made for use in the lab have been reproduced in this thesis with appropriate credit.
Chapter 4 contains work on thymine that is published. The data collection and analysis
was initially conducted alongside C.J. Tiessen under the supervision of Dr. J.W. McConkey,
which I concluded with follow-up analysis for this thesis. C.J. Tiessen also provided the
vapour pressure fit of thymine using data from literature. Dr. W. Kedzierski and J. Dech
assisted with data analysis and provided input on the operation of the experimental
appa-ratus.
Chapter 5 contains work on adenine that is also published. I collected data and performed
the data analysis under the supervision of Dr. J.W. McConkey while Dr. W. Kedzierski and
J. Dech provided input on the operation of the apparatus. J. Dech also developed a program
that would allow the computer in the lab to interface with the BNC565 pulse generator.
obtained written permission from each of the co-author(s) to include the above material(s)
in my thesis.
I certify that, with the above qualification, this thesis, and the research to which it refers,
is the product of my own work.
II. Previous Publication.
This thesis includes 2 original papers that have been previously published/submitted for
publication in peer reviewed journals, as follows:
Thesis Chapter Publication title/full citation Publication status
Chapter 4 C.J. Tiessen, J.A. Trocchi, J.D. Hein, J. Dech, W. Kedzierski, and J.W. McConkey. VUV Study of electron impact dissociative excitation of thymine. Journal of Physics B: Atomic, Molecular and Op-tical Physics, 49(12):125204, 2016.
published
Chapter 5 J.A. Trocchi, J. Dech, W. Kedzierski, J.W. Mc-Conkey. Production of excited H—atoms in Electron Collisions with Adenine. Journal of Physics B: Atomic, Molecular and Optical Physics, 10.1088/1361-6455/ab0222, 2019.
published
III. General.
I declare that, to the best of my knowledge, my thesis does not infringe upon anyones
copyright nor violate any proprietary rights and that any ideas, techniques, quotations, or any
other material from the work of other people included in my thesis, published or otherwise,
are fully acknowledged in accordance with the standard referencing practices. Furthermore,
to the extent that I have included copyrighted material that surpasses the bounds of fair
dealing within the meaning of the Canada Copyright Act, I certify that I have obtained
a written permission from the copyright owner(s) to include such material(s) in my thesis.
I declare that this is a true copy of my thesis, including any final revisions, as approved
by my thesis committee and the Graduate Studies office, and that this thesis has not been
Abstract
A crossed electron-molecular beam system connected to a spectrometer was used to
in-vestigate the dissociative excitation of thymine and adenine following electron impact. The
emission spectrum for these molecules was measured from 80 nm to 150 nm with a 100 eV
electron beam to identify the excited atomic fragments that resulted from these electron
collisions. For each molecule, the hydrogen Lyman series was dominant in spectrum
mea-surements. Relative emission cross sections were measured with respect to Lyman-alpha for
each the Lyman features present in the spectrum for each molecule. The probability of
ob-taining other atomic fragments from the parent molecules was concluded to be insignificant.
Excitation studies were also performed to measure the relative emission cross sections for
electron impact energies up to 430 eV. During thymine studies, this excitation study was
performed for Lyman-alpha in which the threshold energy for this feature was measured to
be 23 eV. During adenine studies, excitation studies were also performed for Lyman-alpha
and Lyman-beta and their thresholds were determined to be 23 eV and 18 eV, respectively.
The possible excitation and dissociation mechanisms from the parent molecules that may
Acknowledgements
First, I would like to thank Dr. J.W. McConkey, whose wisdom and patience could
never be overstated. Additionally, I would like to thank Dr. Kedzierski for his advice and
willingness to lend a helping hand. Both have been important mentors, and the lessons I
have learned from them extend far from the field of physics.
Next, I would like to thank Collin Tiessen, who was a fellow student in the lab a few
years back but made significant contributions to the experiment in general and helped me
grow as a scientist. He has helped in many ways ever since he had left.
Additionally, gratitude is owed to Jeffrey Dech, who also worked in the lab and would
never hesitate to spend time away from his own commitments and instead help me with a
problem I was working on. He helped me become more confident in my work.
I would also like to thank Erik Clausen, Louis Beaudry, and Sinisa Jezdic, who all
contributed to the development and maintenance of the experiment.
Finally, I would like to thank the rest of my friends, including Aaron Bondy, Daniel
Venn, Spencer Percy, Maha Sami, Anmol Dahr, and many more for their support and
Contents
Declaration of Co-Authorship/Previous Publication iii
Abstract v
Dedication vi
Acknowledgements vii
List of Tables viii
List of Figures viii
Table of Abbreviations xvi
1 Biomolecule Targets - Thymine and Adenine 1
1.1 Introduction . . . 1
1.2 Damage Mechanisms for DNA . . . 2
2 Electron Collisions 8 2.1 Elastic and Inelastic Collisions . . . 8
2.2 Quantum Treatment of Scattering . . . 10
2.3 The Bethe-Born Approximation . . . 13
3 Experimental Apparatus 23
3.1 Introduction . . . 23
3.2 Vacuum Chamber . . . 25
3.3 Biomolecule Oven . . . 27
3.4 Electron Beam System . . . 29
3.5 VUV Spectrometer . . . 33
3.6 Photon Detection System . . . 34
3.7 Timing System . . . 35
3.8 Overview . . . 38
4 Electron Impact Studies on Thymine 39 4.1 Overview . . . 39
4.2 Thymine Photoemission Spectra . . . 40
4.3 Excitation Function Studies . . . 43
4.4 Conclusions . . . 49
5 Electron Impact Studies on Adenine 50 5.1 Overview . . . 50
5.2 Photoemission Spectra . . . 51
5.3 Excitation Function Studies . . . 54
5.4 Conclusions . . . 62
6 Conclusion 63
Bibliography 66
A Scientific Constants 73
B Jet Flow Estimations of Thymine and Adenine 74
D Threshold Calibration 81
E Curve Fitting and Error Analysis 83
E.1 Fitting Relative Cross Sections . . . 83
E.2 Error Analysis . . . 83
List of Tables
4.1 Relevant non-hydrogen atomic features that could be observed from thymine.
Taken from NIST[1]. . . 42
4.2 Features present in thymine emission spectrum. . . 42
5.1 Relevant non-hydrogen atomic features that could be observed from adenine.
Taken from NIST.[1] . . . 52
5.2 Features present in adenine emission spectrum. . . 53
5.3 Main primary fragmentation pathways for adenine as proposed by Minaev et
List of Figures
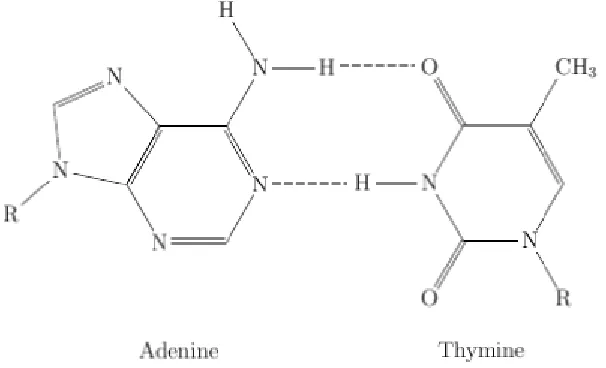
1.1 The adenine and thymine base pair hydrogen bonded together. The molecules
connect to the phosphate-deoxyribose backbone at the R group as can be seen
in the figure. . . 2
1.2 An illustration of single strand breaks (SSB) and double strand breaks (DSB)
in DNA. Various A-T and G-C pairs are shown on the backbone. Single strand
breaks are easily repaired, but double stand breaks are much more serious and
can be the cause of mutations. . . 4
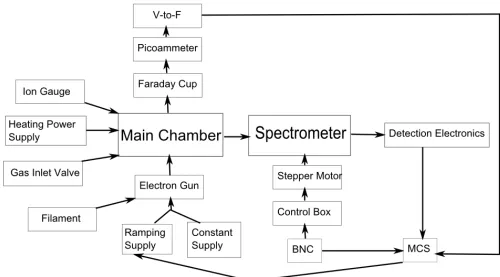
3.1 An overview of the experimental apparatus. Key features are the interaction
region in the centre of the chamber, where a target sample is sublimated from
an oven inside and crossed with an electron beam that is emitted from the
electron gun. The molecular beam is shown in the centre of the interaction
region and is oriented out of the page. The photons that emit at right angles
to both beams enter the VUV spectrometer. A diffraction grating picks out
the wavelength of light that enters the detector. . . 24
3.2 A representation of the main chamber provided by Jeff Hein. The oven sits on
a ceramic piece that is fixed on two interleaved stainless steel cradles, which
are held up by the sides of the chamber. The sample is heated in the body of
the oven where it diffuses out as a beam from the stem and intercepted with
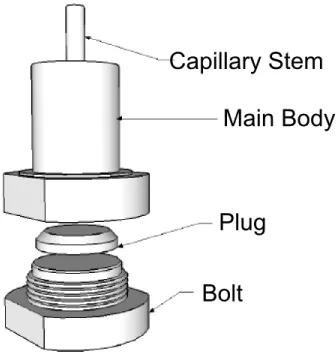
3.3 The components that make up the oven. A sample is loaded through the
body, which is sealed by the plug. The bolt base is threaded into the bottom
of the oven. Representation provided by Jeff Hein. . . 27
3.4 An oven heating study. The blue line indicates the voltage of the heater, and
its appropriate units are on the right axis. The orange line indicates the oven
body temperature and the red line indicates the oven stem temperature. The
units for temperature are indicated on the left axis. . . 28
3.5 The electron gun and Faraday cup units. Reproduced from Abdellatif [3]. . . 29
3.6 The circuitry for the electronics of the electron gun and Faraday cup.
Repro-duced from [3]. . . 32
3.7 A block diagram of the electronics sequence for data collection. The signal is
sent to an electronic counter device and to the MCS simultaneously. . . 34
3.8 The circuit for the detection box. The triangles in this diagram indicate ground. 35
3.9 Timing diagram for spectrum measurements. Channel A corresponds to the
initiating pulse. Channel C corresponds to the pulses sent to the stepper
motor to rotate the diffraction grating. Channel B corresponds the times in
which data was binned. The separation time between Channel C pulses, ∆t,
is 1/8th of the dwell time, T. Note that ∆t is not the difference between t0 and
t1—the interval between these t0 and t1 is 100 µs and has been exaggerated
for this diagram. . . 36
3.10 Block diagram for pulsing process during spectrum measurements. Channel A
instructs the MCS program to begin. Channel B instructs the MCS program
when to bin data. Channel C advances the stepper motor through the control
box. . . 37
3.11 A block diagram overview of the main components of the experiment. . . 38
4.2 The emission spectra of thymine measured from 85 nm to 125 nm with a fixed
electron beam energy of 100 eV. Entrance and exit slits were kept at 0.2 mm
to reduce spectral width. The data have been corrected to take account of
the spectral response of the detection system. . . 41
4.3 Excitation study performed on Lyman-α from 0 eV to 450 eV. . . 44
4.4 A Fano plot taken of the excitation function. The horizontal axis is the logarithm of the energy for the excitation function while the vertical axis is the energy of the excitation function multiplied by the excitation function. . 45
4.5 The emission cross section of Lyman-α transition as a function of electron-impact energy near threshold. The electron electron-impact energy ranged from 15 eV to 50 eV. . . 46
5.1 The molecular geometry of adenine. . . 50
5.2 Adenine emission spectrum measured at constant electron impact energy of 100 eV with 0.2 mm slit width. The data have been corrected to take account of the spectral response of the detection system. . . 52
5.3 Lyman-α excitation function from 0 eV to 350 eV. . . 54
5.4 Lyman-α excitation function near threshold. . . 55
5.5 Lyman-β excitation function measured from 0 eV to 400 eV. . . 56
5.6 Lyman-β excitation function near threshold. . . 57
B.1 Vapour pressure plots against temperature. The thymine plot on the left was done with [4]. The adenine plot on the right was done with [5]. . . 77
C.1 Theoretical H2 emission spectrum reproduced from Brotton et al [6]. . . 79
D.1 Excitation study performed on the (0,0) band of the c4’ 1Σg+ 1Σg+ of N2
at 95.8 nm. . . 81
D.2 A close-up of the excitation function measurement along with the linear fit
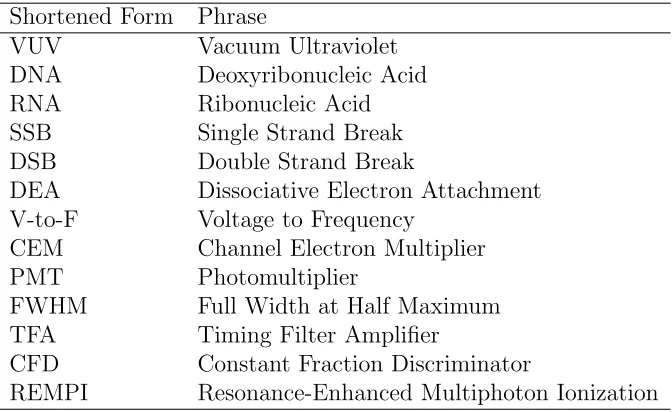
Table of Abbreviations
Shortened Form Phrase
VUV Vacuum Ultraviolet
DNA Deoxyribonucleic Acid
RNA Ribonucleic Acid
SSB Single Strand Break
DSB Double Strand Break
DEA Dissociative Electron Attachment
V-to-F Voltage to Frequency
CEM Channel Electron Multiplier
PMT Photomultiplier
FWHM Full Width at Half Maximum
TFA Timing Filter Amplifier
CFD Constant Fraction Discriminator
Chapter 1
Biomolecule Targets - Thymine and
Adenine
1.1
Introduction
Collisions between an electron with an atom or molecule can not only change the momentum
of the colliding objects but can also affect the electronic, vibrational, and rotational energy
of the atom or molecule. Hence, electron collision experiments are performed to investigate
dissociative, ionization, and excitation processes in a chosen target. If one is interested in
such processes, one can measure the light that is emitted from targets or fragments (if the
target undergoes dissociation) that have been promoted to an excited state; all that is needed
is for the excited states to radiatively decay. This photon flux can be measured and related
to the cross section of the excited state process that resulted from the collision.
If one has the capability to measure photon flux from an electron collision with their
target across a range of wavelengths, then specific transitions and processes may be
iden-tified by measuring the spectral lines that occur. Additionally, once a feature has been
identified, its energy dependence can be measured. This results in a so-called excitation
exci-tation process) against variation in energy. Measurement of the exciexci-tation function makes
it possible to identify the energy threshold(s) responsible for the production of radiation of
that wavelength.
In this work, a monoenergetic electron beam was used in tandem with a spectrometer
and photon detector to study the excitation processes involved with some targets. Light
of the vacuum ultraviolet (VUV) range of wavelengths (50 nm to 200 nm) was exclusively
studied as many transitions belonging to atomic species (H, He, C, N, O, and more) are
found in this spectral region.
The work done here is a continuation of prior work performed with the VUV spectrometer,
where excitation processes were studied for some sulfur-containing molecules by Brotton et
al. ([6] - [7]) and, more recently, a change in focus towards biomolecules with the pyrimidine
work by Hein et al. [8]. Electron impact studies were performed on thymine and adenine in
the VUV emission range.
1.2
Damage Mechanisms for DNA
Figure 1.1: The adenine and thymine base pair hydrogen bonded together. The molecules connect to the phosphate-deoxyribose backbone at the R group as can be seen in the figure.
together form a complementary base pair (A-T) via two hydrogen bonds. The other two
nucleobases, guanine and cytosine, form another base pair (G-C) via three hydrogen bonds.
In RNA, thymine is substituted with uracil (demethylated thymine) and the base pairs
are instead A-U and C-G. More generally, the nucleic acid in these nucleobases (DNA and
RNA) consist of purines, which are the double ringed nitrogen-containing compounds, and
their complementary pyrimidine partner, which are the single-ringed nitrogen-containing
compounds. The importance of these nucleic acids can hardly be overstated. These molecules
are responsible for encoding genetic information and are essential for all living cells [9].
The structure of DNA involves sequences of the aforementioned base pairs, which
consti-tutes the genetic code. These base pairs are connected to a phosphate-deoxyribose backbone
that is arranged in a double helix shape, which is useful for the DNA molecule as it allows
DNA to readily replicate itself. This replication mechanism first involves breaking the
hy-drogen bonds between the complementary base pairs, which causes an “unzipping” of the
double strand. Once the two strands are separated, an enzyme called DNA polymerase
matches the isolated purine or pyrimidine with its complementary pair and bonds it to the
strand. This mechanism allows a DNA molecule to copy itself — any one of the two strands
can be used to preserve the genetic information, as the presence of a purine (adenine and
guanine) or a pyrimidine (thymine and cytosine) suggests its complementary pair. T
repli-cation mechanism itself is very accurate, with less than one mistake in every 107 nucleotides
copied [10].
However, DNA may be damaged by oxidising and alkylating agents, or by high energy
radiation (like UV light or X-rays). Manifestations of this damage can include alteration of
the A-T or G-C sequencing in the molecule, insertions or deletions of sequences,
fragmen-tation of the backbone and as a result single strand or double strand breaks, cross-linking
between the pyrimidine bases, and numerous other mechanisms. Most of this damage can
be repaired, but not all of it, and the changes or errors in base pair sequencing can pass
Additionally, the general accumulation of these uncorrected errors may be an important
cause of ageing [11].
Ionizing radiation (like X-rays or charged particles) can be absorbed by biological
ma-terial, interact with critical nucleotide targets, and begin a process of events that leads to
permanent change. The event whereby atoms or molecules of a nucleotide target are ionized
or excited by incoming radiation is called direct action; for instance, an X-ray may be
ab-sorbed by the DNA molecule, which causes the production of secondary electrons, often 30
eV or lower [12], that can further interact with the biological environment. If instead ionizing
radiation interacts with the surroundings, DNA may be damaged by the process of indirect
action, whereby free radicals are produced and can interact with the DNA molecule. Both of
these radiation damage mechanisms can readily cause single strand and double strand breaks.
The first kind of inflicted damage is easily repaired, but the breaking of both strands is more
serious. Double strand breaks can be repaired by an illegitimate recombination where the
split ends are rejoined, but with no guiding template this process is prone to errors and may
account for many premutagenic lesions induced in DNA [13].
Figure 1.2: An illustration of single strand breaks (SSB) and double strand breaks (DSB) in DNA. Various A-T and G-C pairs are shown on the backbone. Single strand breaks are easily repaired, but double stand breaks are much more serious and can be the cause of mutations.
It is important to understand the dissociative, excitation, and ionization events that may
processes, and so, much work has been done to fill in the gaps of information. Boudaiffa et
al. [14] have shown that dissociative electron attachment (DEA) is a possible method causing
single strand and double strand breaks. In work done by van der Burgt [15], a large body
of work is referenced about the ionization of thymine, along with dissociative ionization,
and also on DEA. In addition, a few review articles have been compiled, mainly Hotop et
al.[16], Balog et al.[17], Sanche et al.[18], and Baccarelli et al.[19]. Colyer et al. [20] have
performed elastic scattering from thymine at 100 eV and 500 eV, while Abouaf et al. [21]
and Chernyshova et al. [22] have studied thymine’s low energy electron-loss spectroscopy.
Additionally, low energy elastic and inelastic scattering calculations on DNA bases have been
performed by Winstead et al. [23] and Dora et al. [24].
There has been a wide volume of research performed to gather information on absolute
cross sections for various kinds of collisions with the DNA bases along with identifying
fragmentation pathways and dissociation events in order to steadily build up a bank of
information that can be used to help develop theoretical models more accurately estimate
biological damage from collisional processes. However, a limited number of studies are
available that involve photon emission following electron impact. Work has been performed
in the visible and near UV spectral regions to investigate radiation from molecular fragments,
including uracil, by Shafranyosh et al. in reference [25] and reference [26] and Shpenik et
al. in reference [27] and reference [28]. Despite numerous studies, there is a lack of work
done to identify excited atomic species following electron impact. The work presented in
this thesis is an attempt to remedy this gap of information and to continue similar studies
that were performed with pyrimidine in this lab [8]. In this work, photo emission following
electron impact on thymine and adenine was measured for wavelengths of light between 80
nm and 140 nm. As the primary emissions in this range are due to excited atomic states, the
work for this thesis involve identifying the primary atomic fragments resulting from electron
collisions and making measurements on the cross sections for the features present. Absolute
beams could not be measured, but other data can be obtained. Following the identification of
atomic fragments resulting from electron bombardment by measuring an emission spectrum
over the 80 nm to 140 nm wavelength range, the emission cross sections for features present
in the spectral range could be measured relative to the largest feature found. In this way, if
the absolute cross section for any one of these emission features were measured, as may be
done in future work, then the relative emission cross section work present here may be used
to determine absolute cross section measurements for the other features.
Once a spectral feature was identified, excitation studies were performed on the feature
to measure the cross section’s dependence on electron impact energy. Specifically, these
exci-tation studies yield measurements of the electron impact energy where the cross section is at
a maximum and also provides some insight into the high energy behaviour of the cross
sec-tions. Additionally, the threshold energy for atomic dissociations from the parent molecules
can be measured, and as the electron impact energy rises, additional thresholds
representa-tive of newly dominant dissociation pathways that yield the atomic spectral feature under
observation can also be identified as they become relevant to the total cross section. These
threshold observations are discussed in the context of literature where mass spectrometry
and photofragmentation measurements have been performed for thymine and adenine.
Mass spectrometry work done by Rice et al. [29] measured mass fragments of thymine
and adenine, while other thymine mass spectra were obtained by Ulrich et al. [30]. and
Imhoff et al. [31]. Prominent mass fragments had been clearly identified in these works and
fragmentation of the parent molecules was achieved with electron impact energies
compa-rable to the energies used in this work. Sethi et al. [32] performed mass spectrometry for
adenine with electron ionization spectra. In the work of Minaev et al. [2], absolute total
ionization cross sections up to 200 eV for adenine have been measured. Jochims et al. [33],
Schneider et al. [34], and Li et al. [35] have performed photon impact studies on isolated
nucleobases. Particularly in the work of Jochims, 6 to 22 eV synchrotron radiation was
pathways are discussed. van der Burgt et al. [12] have measured partial ionization cross
sections for positive fragments of adenine following electron impact. Dawley et al. [36] have
measured electron ionization of adenine and Pilling et al. [37] have measured the dissociative
photoionization of adenine. The results from the works discussed here are compared later to
the results obtained for excitation studies of the identified emission atomic spectral features.
This is done to check for possible fragmentation mechanisms that may be responsible in
producing the studied feature and therefore determine the importance of such fragmentation
Chapter 2
Electron Collisions
2.1
Elastic and Inelastic Collisions
When one considers the action of an electron colliding into some target, numerous kinds of
scattering processes are possible. An electron can collide with a target and scatter without
losing any energy but change the individual momenta of the involved species in a process
called elastic scattering. An atom, A, as an example, will not have its internal energy
changed.
e+A→e+A (2.1)
Electrons with sufficient energy may also affect the internal structure of its target. If a
collision process occurs between an electron and a target, the electron may transfer some
energy to the target and affect its internal structure - this is called inelastic scattering. For
instance, the example atom A that was considered above, if hit by an electron e, which can
become captured:
e+A →A− (2.2)
of its energy to the target.
e+A→e0 +A∗ (2.3)
e0 denotes the scattered electron while A∗ denotes the excited state of the atom, which
some timer later can optically decay to its ground state. Another inelastic scattering process
is the action of ionization, where the projectile electron strips the target of one its own
electrons, denoted by e00 in the equation below.
e+A→e0+e00+A+ (2.4)
In this case, the collision has produced an ion. An electron impact that results in multiple
ionizations is possible, but usually with higher kinetic energy of the projectile electron, or
with heavier atoms that possess more electrons. Additionally, ionization of the target can
occur alongside an excitation process.
Similar processes can also be described for molecules. If we consider a diatomic molecule
made up of atom A and atom B, the different scattering channels as described before are
easily accounted for.
e+AB →AB− (2.5)
e+AB→e+AB (2.6)
e+AB→e0 +AB∗ (2.7)
e+AB→e0+e00+AB+ (2.8)
easily break any bonds that constitute the molecule.
e+AB→e0+A+B (2.9)
This is a simple dissociation of the diatomic molecule AB. It is feasible for dissociative
processes to occur concurrently with absorption by one of the fragments, or with the
pro-motion of a fragment to an excited state whereby it itself can radiatively decay, or with
ionization. Due to the increase in internal complexity of molecules, many more scattering
channels are opened up for them compared to atoms.
In this work, we are primarily concerned with collision events that result in the production
of excited products, more specifically, excited atomic fragments following electron impact on
biomolecules.
2.2
Quantum Treatment of Scattering
The following discussion is a basic theoretical introduction to the differential cross section
for non-relativistic collisions, which will facilitate discussion on the Bethe-Born
approxima-tion, which itself is discussed in the subsequent section. The physical consequences of the
Bethe-Born approximation are used in the analysis of the relative cross section
measure-ments obtained during excitation studies for energies beyond the cross section maxima. The
discussion here follows the treatment by Inokuti [38]. By the end of this section, we will
arrive at an equation for the total cross section, and then move on to discuss the Bethe-Born
approximation for high energies.
First consider an excitation collision process between an electron and a ground state
target (atom) with Z electrons where the atom transitions from a ground state to an excited
staten. At non-relativistic but high kinetic energies, we may determine the differential cross
section dσn using the first Born approximation for scattering. First by identifying p~0 as the
collision, and the momentum transfer as K~ = ~p−p~0, the differential cross section dσn for
a solid angle dω at θ and φ, calculated in the lowest order of the interaction potential V
between the electron and target is given by the following equation in atomic units.
dσn =
m2p
4π2p 0
ˆ
ei ~K·~ru∗n(r~1... ~rz)V u0(r~1... ~rz)d ~r1... ~rzd~r)
2
dω (2.10)
The quantity m is simply the reduced mass of the two-body system, given as:
m = m1m2
m1+m2
(2.11)
In the integrand,u0andunare the bound state wave functions of the target at the ground
state and thenth state, respectively. The quantity~r is the position of the projectile electron
while any r~i is the position of the ith electron in the target.
Next, we consider a Coulombic interaction between the projectile and its target.
V =
Z
X
j=1
e2 |~r−r~j |
− Ze 2
r (2.12)
From here, we follow the work by Bethe [39], where we introduce the following relation.
ˆ
ei ~K·~r
|~r−r~j |
d~r = 4π
K2e
i ~K·r~j (2.13)
This expression allows us to modify Equation 2.10.
dσn=
4m2e4p K4p
0
|n(K)|2 dω (2.14)
n(K) is the atomic matrix element of the target. It is written as
n(K) =hn| Z
X
j=1
or alternatively:
n(K) =
ˆ
u∗n
Z
X
j=1
ei ~K·r~ju
0d ~r1...d ~rZ (2.16)
We now consider two more items of interest. Firstly, we seek to replacedω by 2πsinθdθ=
πd(K2)/pp0. Secondly, as the states |niand|0iare orthogonal, the second term in Equation 2.12 for the interaction potential, vanishes. We arrive at the following equation.
dσn=
4πm2e4
p2 0K4
|n(K)|2 d(K2) =
4πm2e4
p2 0K2
|n(K)|2 dln(Ka0)2 (2.17)
where we have made use of the Bohr radius a0 in Equation 2.17.
Next we define what is known as the Generalized Oscillator Strength, fn(K) in the next
equation.
fn(K) =
En0
R(Ka0)2
|(K)|2 (2.18)
The term En0 is the excitation energy of a target from its ground state to its nth state.
The quantityR is the Rydberg energy. We will use thisfn(K) as defined above in the latest
expression fordσn.
dσn =
4πe4m2a2 0R
p2 0En0
fn(K)dln(Ka20) (2.19)
During an electron collision with a target of mass M, we can assume the target is
sta-tionary as M > me. The relative momentum, p0, can be written as p0 = mv. Using the
kinetic energy KE of the projectile electron, the above equation becomes:
dσn=
4πR2a2 0
KEEn0
fn(K)dln(Ka0)2 (2.20)
If we integrate across all possible values of ln(Ka0)2, we can obtain the total cross section.
If we define the following expressions,
and
δ1 = ln(Ka0)2max (2.22)
then we can write the effective excitation cross section from the ground state to the nth
excited state as in Equation 2.23.
σn =
4πa20R2 KEEn0
ˆ δ1
δ0
fn(K)dln(Ka0)2 (2.23)
This completes our initial objective. Next we will examine the consequences of the
asymptotic behaviour of fn(K) as K →0, and looking at an integration across all lnKa02, i.e., letting the δ0 and δ1 defined earlier go to −∞and +∞, respectively.
2.3
The Bethe-Born Approximation
Bethe [39] worked out a method for expressing the cross section as determined in Equation
2.23 in terms of an asymptotic expansion in inverse powers ofKE, which works very well at
high energies. Given this, we now consider the integral limits, δ0 and δ1, and the behaviour
of fn(K).
Looking at the asymptotic behaviour of the Generalized Oscillator Strength as K goes
to 0, we get the optical oscillator strength, fn.
lim
K→0fn(K) (2.24)
For optically forbidden processes, the optical oscillator strength vanishes, i.e. fn = 0.
Then, asKapproaches its lower limit, as defined by (Ka0)2 →1/KE,fn(K) goes to 0. In the
high energy approximation, δ0 = ln(Ka0)2min → −∞ and δ1 = ln(Ka0)2max → +∞. Then,
(Equation 2.25) and optically forbidden processes (Equation 2.26):
σn=
4πa2 0R
KE
Mn2ln
4CnT
R
+ γnR
KE
+O
"
En0
KE
2#!
(2.25)
σn=
4πa20R KE
bn+
γnR
KE
+O
"
En0
KE
2#!
(2.26)
M2
n is the dipole matrix element, as in:
Mn2 = fnR
En0
(2.27)
The other two terms, γn and bn, are expressed in the following equations.
γn=−
mefn
2m −
En0 4R
dfn(K)
d(Ka2 0)
K=0
(2.28)
bn=
ˆ +∞
−∞
Rfn(K)
En0
dln(Ka0)2 (2.29)
At the high energy limit whereKE → ∞, the equations obtained for the optically allowed
processes become:
σn=
4πa20RMn2lnKE
KE
+ C
KE
(2.30)
with C defined as:
C = 4πa20RMn2ln
4Cn
R
(2.31)
Additionally, the optically forbidden process becomes:
σn=
4πa2 0Rbn
KE
(2.32)
Consider the cross section for an optically allowed process, as in Equation 2.30. One may
will yield a straight line with a slope proportional toM2
n, and therefore the optical oscillator
strengthfn. Additionally, the intercept on the horizontal axis yieldsC in Equation 2.30, and
hence Cn. This technique was developed by Fano [40], and this plot itself is called a Fano
plot. At high kinetic energies, a Fano plot indicating linear behaviour justifies the use of
Bethe theory for the collision process. Absolute cross section data then makes it possible to
obtain optical oscillator strengths. Note that if a Fano plot is made of an optically forbidden
process, as in Equation 2.32, a linear function will not be made. Instead, this technique will
yield a constant for the plot.
In this work, the Fano plot technique was used with measurements made on the total
cross section for an excited atomic state, which provides a quantitative method for concluding
whether the process is an optically allowed transition or optically forbidden but spin allowed
transition. In the case of a high energy cross section for a spin forbidden transition, the
cross section will decrease as 1/E3; this was not observed in this work. The experimental
apparatus only had the capability to measure the cross section up to 430 eV; to properly
test the Bethe-Born approximation on the cross section would require at least 1 keV, but
the energy limit in this experiment does suffice to examine some differences between the
optically allowed and optically forbidden but spin allowed transitions.
2.4
Photon Spectroscopy
We next consider a multichannel scattering event such as in a crossed-beam experiment,
specifically with electrons and and molecules. The pressure of the gas that is used in the
crossed-beam experiment, along with the electron beam current, should be sufficiently low
so that some other secondary processes, like intrapopulation collisions and resonance
absorp-tion, negligibly contribute to the overall process. In a crossed-beam experiment, we consider
It is given by the following equation.
dn(j)
dt =−
X
k;k<j
n(j)A(jk) + n(g)Q(j)IL
e +
X
i;i>j
A(ij)n(j) (2.33)
A(jk) and A(ij) are the Einstein A coefficients for the transition to the kth/jth state
from the jth/ith state, respectively. The number densities for the ground, ith state, and
jth excited state atoms are n(g), n(i), and n(j), respectively. Q(j) is the excitation cross
section for the transition to the jth state from the ground state. I is the electron current
and L is the interaction length for the electron-target collision.
The equation listed above has three key terms. The first term describes the rate where
the target of the jth excited state radiatively decays to the lower kth state while the third
term describes the cascade contributions from higher states. The second term, in the middle,
describes the electron impact excitation of atoms to the jth excited state from the ground
state.
Consider when equilibrium is reached. This means that dn(j)/dt = 0 and n(j) can be
expressed using the terms in Equation 2.33.
n(j) =
hn(g)Q(j)IL
e +
P
i;i>jA(ij)n(i)
i
P
k;k<jA(jk)
(2.34)
Next, we define the quantity J(jk)
J(jk) = n(j)A(jk)
L (2.35)
which is the rate of targets in the jth state that decay to the kth state per unit length of
the electron beam. J(jk) can be substituted into the equation we just developed for n(j).
J(jk) =
hn(g)Q(j)I
e +
P
i;i>jJ(ij)
i
A(jk) P
k0;k0<jA(jk0)
We would like to rearrange Equation 2.36 so that we can arrive at an expression for
Q(j), but first we can make use of the branching ratio for the jth to kth transition,B(jk),
to simplify the expression above. The branching ratio is defined as follows.
B(jk) = P A(jk)
k0;k0<jA(jk0)
(2.37)
With this in hand, we are set to rearrange for Q(j).
Q(j) = hJ(jk)
B(jk) − P
i;i>jJ(ij)
i
e
n(g)I (2.38)
This equation reduces simply if the cascade contributions, P
i;i>jJ(ij), are negligible.
Q(j) can now be expressed as:
Q(j) = J(jk)e
B(jk)n(g)I (2.39)
Using the relation,
B(jk) = P J(jk)
k0;k0<jJ(jk0)
(2.40)
Equation 2.39 can also be expressed in this way.
Q(j) = P
k0;k0<jJ(jk0)e
n(g)I (2.41)
This equation suggests that the excitation cross section for a transition to the jth state
can be determined by measuring the radiation that is emitted from any transitions that end
at the jth state. Spectral line intensities, J(jk) are measured during photon spectroscopy
experiments. A measurement of this kind readily provides a way to determine the effective
cross section, Q(jk), as long as n(g) and I are measured too.
Q(jk) = J(jk)e
n(g)I (2.42)
defined as
P = Ik− I⊥ Ik+I⊥
(2.43)
In the above equation, the photon fluxes, I⊥ andIk, emitted from the interaction region per unit solid angle in a direction that is orthogonal to the beam axis are related to the
jk transition resulting from the inelastic electron collisions. Specifically, they are the
components of the electric dipole transition moment operator, for this jk transition, for
every atom or molecule in the interaction region. I⊥ is perpendicular to the electron beam axis while Ik is parallel to the electron beam axis.
Following work done by Heddle and Keesing [41], the flux of photons that enter into unit
solid angle in the direction of polar angle θ for ajk transition can be written as:
J(jk, θ) = Ik(jk)sin2θ+I⊥(jk)cos2θ+I⊥(jk) = [Ik(jk) +I⊥(jk)](1−P cosθ) (2.44)
We can obtain J(j, k) by integrating over all angles, θ and φ; this integration results in
the total intensity for the jk transition.
J(jk) =
ˆ
4π
J(jk, θ)dω (2.45)
J(jk) = 8π
3 [Ik(jk) + 2I⊥(jk)] (2.46)
This result can be used in Equation 2.42 to obtain an expression for Q(jk) in a different
form, utilizing the parallel and perpendicular photon intensities. Measurement of these
intensities can yield a measurement of the effective cross section.
Q(jk) = 8π 3
Ik(jk) + 2I⊥(jk)
n(g)I (2.47)
q(jk, θ) = J(jk, θ)e
n(g)I (2.48)
This can be simplified by defining an a(jk) with the total intensity term,Ik+I⊥, as
a(jk) = (Ik+I⊥)e
n(g)I (2.49)
Then, in conjunction with the far right term in Equation 2.44, the differential cross section
can be rewritten as
q(jk, θ) = a(jk)(1−P cos2θ) (2.50)
Note that a(jk) = q(jk,90◦), the differential cross section at 90◦, as from Equation 2.44,
P cos(90◦) = 0, and J(jk, θ) is simply the sum of the intensities.
Integrating the differential cross section over a 4π solid angle yields the effective cross
section:
Q(jk) =
ˆ
4π
q(jk, θ)dω (2.51)
Q(jk) = 4πq(jk,90◦)
1− P 3
(2.52)
This equation states that the effective cross section can be obtained if one measures the
differential cross section at 90◦. In our work, we use a diffraction grating to measure radiation
at this angle.
The sensitivity of an optical detector may depend on the polarization of the radiation
as well as the wavelength. We define kk and k⊥ as the detection efficiencies for polarized
radiation with parallel and perpendicular electric fields, respectively, to the entrance slit of
a monochromator (as in our experiment) that leads to some photon detecting system. Clout
and Heddle [42] have shown how to eliminate instrumental polarization for measurements.
We consider radiation that is observed at an angle θ to the electron beam axis and also at
simplicity; the expression for the signal, S(θ, α) that is measured, is given as:
S(θ, α) = Ik(kkcos2αsin2θ+k⊥sin2αsin2θ)
+I⊥[kk(sin2α+cos2αcos2θ) +k⊥(cos2α+sin2αcos2θ)] (2.53)
Appropriate values of α and θ will greatly simplify this expression. If we chooseθ = 90◦
andα = 90◦, so that radiation is observed orthogonal to the electron beam axis with a plane
of detection also orthogonal to the plane of the electron beam, then the equation reduces to
S(90◦,90◦) = Ikk⊥+I⊥kk (2.54)
In this experiment, we assumed that the radiation due to electron-biomolecule collisions
had no polarization, i.e., P = 0, due to the random orientation of the constituent molecules
of the thermally sublimated molecular beam. This means that I⊥=Ik =Is, and the signal
that is measured, S(90◦,90◦) can be shown to be proportional to the effective cross section
Q(jk).
S(90◦,90◦) = (k⊥+kk)Is (2.55)
S(90◦,90◦) = (k⊥+kk)J(jk,90 ◦)
2 (2.56)
S(90◦,90◦) = (k⊥+kk)n(g)Iq(jk,90 ◦)
2e (2.57)
S(90◦,90◦) = (k⊥+kk)n(g)IQ(jk)
8πe (2.58)
Rearranging now for Q(jk):
Q(jk) = 8π (I/e)n(g)
S(90◦,90◦) (k⊥+kk)
(2.59)
can be used to absolutely determine the Q(jk) in question, assuming current and target
density have been normalized to be the same for both the target and the standard target:
Q(jk)
Q(jk)std
= S(90 ◦,90◦)
S(90◦,90◦)
std
k⊥std+kkstd
k⊥+kk
(2.60)
This procedure can be performed to obtain absolute cross section measurements for a
transition. This was used in earlier work with pyrimidine [8] where absolute data for
Lyman-α production was obtained by comparing with known data for Lyman-α production from
H2.
In this work, absolute cross section measurements were not possible as the vapour pressure
of the molecular beam could not be measured, nor could we pass a calibrating gas through
the capillary tube of the oven that was used to sublimate the biomolecule sample targets.
Despite this, Equation 2.59 indicates that the current of the electron beam must be
measured simultaneously as measurements are made on the cross section during excitation
studies. Without correcting for the electron beam current for a given excitation study,
measurements made on the relative emission cross section are incomplete.
Additionally, the vapour pressure is not expected to deviate greatly once a steady-state
temperature is achieved for the oven. A brief discussion of the steady-state temperature
behaviour of the oven is given in Chapter 3.3 while the relationship between the temperature
of the sample target loaded in the oven and the corresponding vapour pressure is described
in Appendix B. Significant changes in the measured signal of the emission cross section,
i.e., excitation function, across the utilized energy range are therefore expected due to the
electron beam current, which were corrected for in this work by dividing the measured photon
flux signalS(90◦,90◦) by the electron beam current, I.
During measurements taken across a spectral range, the electron beam current is still
measured despite using a constant electron impact energy for such measurements. For
Chapter 3
Experimental Apparatus
3.1
Introduction
Electron collisions are performed inside the main chamber kept under a vacuum of 3 to
5×10⁻⁷ Torr. Inside this chamber, an electron beam collies with a beam of sublimated target molecules at right angles. Excited atomic and ionic species resulting from this collision
spontaneously emit radiation in all directions. The main chamber is connected to a half-metre
Seya-Namioka VUV spectrometer which intercepts the resultant radiation that is mutually
orthogonal to the crossed beams. The diffraction grating in the spectrometer allows different
wavelengths of radiation to be picked out and sent to a photon detection apparatus.
The experimental apparatus was designed to accommodate two modes of data acquisition.
In the first mode, the electron beam is kept at a constant energy of 100 eV while timing
electronics rotate the diffraction grating inside the spectrometer to measure the intensity of
radiation over an arbitrary wavelength range. During such measurements, the wavelength
could sweep from 80 nm to 140 nm. The second mode of data acquisition instead keeps
the diffraction grating fixed on one wavelength but allows the electron beam to vary in
energy while measuring the intensity of the radiation. This allows us to acquire a so-called
impact energy. The excitation function can be related to the cross section for the transition
being observed. The electron beam’s energy can vary from 0 eV to 400 eV for this mode of
measurement.
Both modes of data acquisition are used for these collisional experiments. The first
method, where the diffraction grating is rotated to sweep across an arbitrary wavelength
range, is used to determine the sort of transitions that are occurring and to link these
radia-tive transitions with species that are relevant, i.e., the possible fragments from the collision.
After identifying radiative transitions over the wavelength range, the second method is
em-ployed to acquire the excitation function. Data was acquired by a Multi-Channel Scaler
(MCS) program on a computer, which would bin data from the detection electronics.
Figure 3.1: An overview of the experimental apparatus. Key features are the interaction region in the centre of the chamber, where a target sample is sublimated from an oven inside and crossed with an electron beam that is emitted from the electron gun. The molecular beam is shown in the centre of the interaction region and is oriented out of the page. The photons that emit at right angles to both beams enter the VUV spectrometer. A diffraction grating picks out the wavelength of light that enters the detector.
Figure 3.1 provides an overview of the main experimental apparatus, which includes the
electron-collision chamber, the VUV spectrometer, and the photon detection arm. The ion
the chamber to an approximate pressure of 5×10⁻⁵ Torr with a gas used for calibration. The electrical feedthrough is a flange that allows power supplies from outside the chamber to be
connected to resistive wiring that is wrapped around an oven in the centre of the chamber
and around the Faraday cup.
3.2
Vacuum Chamber
The main vacuum chamber is made of stainless steel and consists of three pairs of mutually
orthogonal ports. Each port has a diameter of 8” and is sealed by a Viton O-ring. The
entire apparatus is evacuated with roughing pumps connected to the system with
Kwik-Flange ISO KF stainless steel tubes and valves. An Edwards E2M12 vacuum pump is
attached to the main collision chamber and an Edwards Speedivac ED100 is attached to
the VUV spectrometer. The roughing pressures are measured by a Kurt J Lesker KJL 6000
Thermocouple Gauge and a Granville-Phillips Series 340 Vacuum Measurement Controller
for each of these roughing pumps respectively. The chamber’s pressure is reduced to about
20 mTorr with these roughing pumps, which is necessary for the efficient operation of turbo
pumps that further reduce the pressures inside the main chamber.
Two turbo pumps are used in conjunction to quickly acquire a low background
pres-sure in the chamber. A Varian TV 701 Navigator turbo pump is fastened underneath the
spectrometer chamber and is typically operated at 28 kRPM. A Varian Turbo-V1000 turbo
vacuum pump is attached underneath the electron collision chamber. Operating background
pressures were 3 to 5×10⁻⁷ Torr. If a gas was introduced into the chamber for a study, the pressure was maintained on the order of 10−6 Torr or a low 10−5 Torr. These pressures
were measured by a Veeco RG1000 Ionization Gauge, which is mounted to a supplementary
compartment of the main chamber.
The sample oven is perched inside the main chamber directly above the Varian
oven and is heated to create a sublimated molecular beam that diffuses upwards to the top
of the chamber, which is sealed by a plain flange. Most of the sample’s beam deposits on
this top flange but some of the sample deposits on the sides of the chamber.
An electron gun and Faraday cup are situated opposing each other as is shown in Figure
3.2. Their mutual axis is perpendicular to the axis of the molecular beam sublimated from
the oven. An electron beam produced by the electron gun intercepts the molecular beam
orthogonally and radiation is produced from the collisions between the electrons and the
sublimated sample. This radiation is measured by the detection arm after it passes through
the VUV spectrometer system.
Figure 3.2: A representation of the main chamber provided by Jeff Hein. The oven sits on a ceramic piece that is fixed on two interleaved stainless steel cradles, which are held up by the sides of the chamber. The sample is heated in the body of the oven where it diffuses out as a beam from the stem and intercepted with the electron beam.
The electrical components of the Faraday cup, electron gun, and biomolecule oven are
all connected to external power supplies via feedthroughs in a number of the mounting
flanges. Resistive wiring wrapped around the oven and Faraday cup is connected to Variac
power supplies outside the chamber. There is also a thermocouple connected via this same
A gas inlet system with a needle-nose valve allows low pressure calibration of gases to
be introduced into the main chamber. Additionally, it is often used as a vent to bring the
pressure of the chamber to atmospheric pressure so that the chamber may be cleaned or to
reload the oven.
3.3
Biomolecule Oven
The biomolecule oven, as pictured in Figure 3.3, is a stainless steel barrel and outfitted with
an array of capillary tubes in its stem. The oven’s body is sealed by a removable metal plug
situated on a threaded base-bolt on the bottom. The sample is loaded into the oven from
the bottom before the oven is inserted into the chamber which is then vented and kept under
vacuum. Aerorod heating wire is wrapped around the oven’s 1” diameter body and 0.25”
diameter stem and connected to a Variac AC supply outside the chamber via an electrical
feedthrough. The Variac supply provides current to the heating wire to warm the oven.
When enough heat is supplied to the sample inside the oven, the sample sublimates and the
oven emanates a molecular beam vertically upwards..
The main body is typically maintained around 170◦C to 190◦C . The capillary tube is
kept at a higher temperature than the body to prevent clogging in the tube and is about
50◦C higher than the body’s temperature. The Variac supply typically supplies 35 V to 40
V to heat the oven to temperatures that will sublimate the sample.
A thermocouple is attached to the oven’s stem and to the oven’s body, and it is wired
through an electrical feedthrough to outside the chamber. The wiring connects to a switch
box and a multimeter to display the temperature. The switch box allows selective monitoring
of the oven body’s temperature or the oven stem’s temperature.
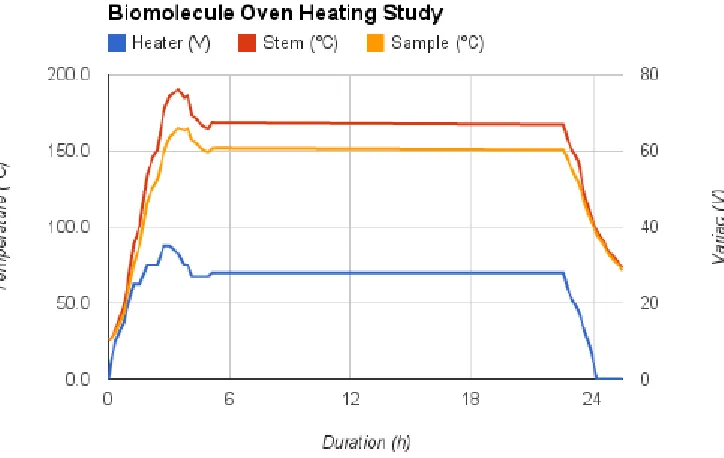
Figure 3.4: An oven heating study. The blue line indicates the voltage of the heater, and its appropriate units are on the right axis. The orange line indicates the oven body temperature and the red line indicates the oven stem temperature. The units for temperature are indicated on the left axis.
An oven heating study is shown in Figure 3.4. In it, the voltage of the Variac power
supply for the heater was allowed to vary and the corresponding temperature of the oven’s
body and the oven’s stem were recorded. During this study, the oven was empty. The oven
was heated from room temperature and as can be seen in Figure 3.4, the temperature of the
much later when the the power supply is turned down. At a voltage of about 30 V, the oven’s
body reaches 150◦C while the stem reaches a steady-state of about 175◦C . The temperature
at which the oven is held is related to the vapour pressure of the sublimated molecular beam
in an exponential fashion—small deviations in the oven temperature can drastically affect
the vapour pressure of the beam. The oven must be held at steady temperatures during
data-taking for a consistent molecular beam vapour pressure. A discussion on this relationship is
given in Appendix B where estimations of the vapour pressure for thymine and adenine are
provided for temperatures relevant to this experiment.
3.4
Electron Beam System
The electron gun supplies a magnetically collimated monoenergetic beam of electrons from
a tungsten filament along an axis othogonal to the molecular beam. The beam enters the
Faraday cup, a positively biased metal needle on the other end of the chamber, and the
current to the Faraday cup is measured by a picoammeter.
During spectrum measurements, the gun energy was kept at a constant 100 eV. During
excitation measurements, the gun energy was ramped from 0-400 eV by the ramping power
supply. The MCS program on the computer could not only bin data during measurements
but could also direct the ramping power supply to supply a specific energy range for the
electron gun. An initial energy to begin an excitation scan, a final energy to end it on,
and the energy resolution per channel could all be specified in the MCS. During excitation
measurements, the gun was increased by 0.5 eV per channel.
The tungsten filament for the electron gun is manufactured by Soquelec and sits on a
ceramic base, which itself is mounted on a stainless steel tube, as seen in Figure 3.5. This
mounting tube has threading on its top where the filament sits so that a filament housing can
be secured over the mounted filament. The filament housing is a stainless steel covering with
three electron lens plates that are independently supplied with voltage from a power supply.
The lens plates are interleaved with ceramic pieces and fastened to the filament housing by
screws secured through the ceramic pieces. The bottom of the mounting tube has a screw
aligned along its longitudinal axis that is inserted into an outer chassis and the
filament-lens conglomerate is tightened to the outer chassis by a nut. The outer chassis is screwed
into a flange. Three electrically insulating but thermally conducting washers separate the
outer chassis from the mounting tube and allow heat from the hot filament to dissipate.
A magnetic solenoid coil is placed around the filament housing and mounting tube to help
collimate the electron beam.
The Faraday cup sits on the opposite side of the chamber from the electron gun and
consists of a stainless steel needle biased up to 50 V and an earthed outer cup. The needle
head, which is also called the inner cup, has a threaded base that is inserted through a hole
at the bottom of the outer cup and suspended by a ceramic sheath to avoid direct electronic
contact with the outer cup. The threaded base is partly wrapped with Kapton tape as an
additional measure to avoid electronic contact between the cups. The thread base of the
outer chassis with a screw through a threaded ceramic piece.
A power supply is used to keep the current through the tungsten filament at 2.20 A to
2.30 A, as this results in a current of about 50 µA across the Faraday cup. The body of
the filament housing, in conjunction with the sequential two plates, form an Einzel lens;
this focuses the beam while also accelerating it. The third lens, at the tip of the gun, is
grounded to shield the beam from external fields. Electrons are thermionically emitted from
the tungsten filament and accelerated by the lens plates. The filament housing and the plates
held at a bias separately from the filament and are wired to adjustable resistors so that the
voltage across the plates can be changed. This is done because it affects the focusing of the
beam; when the gun is operational under vacuum, the voltages across the plates are adjusted
to optimize the current through the Faraday cup.
The electrons attracted to the positively biased needle are passed to ground via a
pi-coammeter that measures the collected current. Currents could range from 40 µA to 100
µA. The inner cup was positively biased to stop electrons from being back-scattered into the
interaction region. The picoammeter is also connected to a Voltage-to-Frequency (V-to-F)
converter; this device outputs a signal to a port on the computer to the MCS program that
is proportional to the current measured by the picoammeter. In this way, the current
be-haviour can be measured along with the ramping energy of the ramping power supply and
divided from the acquired excitation function.
Figure 3.6 shows the electronics circuitry for the electron gun and Faraday cup. A switch
controls the choice of power supply for spectrum measurements (Constant Energy supply) or
for excitation measurements (Ramping Energy supply). Also pictured is the lens supply to
optimize the current in the chamber. The cathode is connected to the filament supply near
the lenses. The Faraday cup is shown connected to its bias and a switch controller that allows
Figure
3.6:
The
circuitry
for
the
ele
ctronics
of
the
electron
gun
and
F
arada
y
cup.
Repro
duced
from
[3
3.5
VUV Spectrometer
A McPherson 1/2 m Seya-Namioka Vacuum Ultraviolet (VUV) spectrometer is connected
to the main chamber by one arm and connected to the detector system on the other arm.
Radiation from the main chamber that is orthogonal to the crossed-beam system travels
through an adjustable entrance slit into the spectrometer to a diffraction grating. The
diffraction grating is rotated by a stepper motor so that a chosen wavelength of light is
directed through an exit slit so that it is detected by the channel electron multiplier (CEM)
or photomultiplier (PMT).
A slit and shutter mechanism is included at the end of each arm of the spectrometer
to collimate light. The slits are adjustable and provide up to a 2 mm opening and can
be adjusted in increments of microns. During spectrum measurements, where resolution
is critical to distinguish features, the slits are kept at 0.2 mm which results in 0.8 nm at
full width half maximum (FWHM) for a feature. During excitation measurements, where
intensity is more important than resolution, the slits are opened to 1 mm.
The diffraction grating in the VUV Spectrometer has 2400 lines/mm and is rotated on
a Seya-Namioka mounting by a stepper motor. On the instrument, there is a counter that
linearly corresponds to the rotation of the grating. A gas like He, H2, or N2 with well-studied
features is used to calibrate the counter reading on the instrument with the wavelength of
radiation.
The stepper motor is responsible for the rate of rotation of the diffraction grating. It
rotates a finely threaded shaft in discrete steps. A threaded block envelopes the threaded
shaft; rotation of the shaft causes the block to translate along the shaft. This block is
connected to a mechanical gear system that rotates the diffraction grating inside the vacuum,
which in turn is connected to a counter dial. The stepper motor is controlled by a BNC555
unit, and each pulse from this unit instructs the stepper motor to turn one step corresponding
to 1/8th of a full turn on the counter.
the spectrometer’s reflection efficiency.
3.6
Photon Detection System
A Burleigh CEM model 4028 was used to detect radiation in the VUV range of 50 nm to
150 nm and was supplied with 3.2 kV from a Ortec model 569 Bias Supply. The CEM was
coated with CsI so that it had greater sensitivity at higher wavelengths.
The CEM produces pulses that are sent through signal processing electronics arranged
on a NIMbin. A pulse is first sent to a preamplifier and then to the Ortec 474 Timing Filter
Amplifier (TFA) which amplifies and shapes the signal. The pulse is sequentially sent to the
Ortec 584 Constant Fraction Discriminator (CFD) to minimize recorded noise. The output
from the CFD is sent to the Ortec 775 Counter and to the Multichannel Scaler (MCS) on
the computer. The MCS hardware is a card attached to the inside of the computer with
BNC ports for multiple uses. Spectrum scans and excitation scans are recorded using the
MCS-32 software and are saved as MCS files and as ASCII files. Figure 3.7 illustrates this
sequence.
Figure 3.7: A block diagram of the electronics sequence for data collection. The signal is sent to an electronic counter device and to the MCS simultaneously.
The detector housed inside the detection arm of the vacuum chamber is connected to a
small box external from the chamber. The circuit diagram for this box is given in Figure
and the Pre-Amp. The 3 kV power supply directly supplies the detector with voltage for its
operation to develop a signal, which itself is passed on to the Pre-Amp and the rest of the
signal processing electronics as indicated in Figure 3.7.
Figure 3.8: The circuit for the detection box. The triangles in this diagram indicate ground.
3.7
Timing System
A BNC 565 Pulse/Delay Generator was used during spectrum measurements to create a
pulse sequence that controlled the stepper motor and instructed the MCS program to collect
and bin data appropriately. During spectrum measurements, the BNC565 unit sends a
pulse to a control box, which in turn sends the pulse to the stepper motor. Each pulse
causes the stepper motor to rotate the diffraction grating in equal increments. This rotation
corresponds to the counter reading on the spectrometer - each discrete turn by the stepper
motor increases the counter by a factor of 1/8. The counter reading corresponds to a sweep
over wavelengths - when the counter reading increases by 1, the spectrometer has sweeped
over 0.5 nm. This means that 8 pulses must be sent by the BNC565 unit to rotate the
stepper motor by 1 on the counter and therefore sweep over 0.5 nm.
of the BNC565 unit sends an initial pulse at t0 to the MCS, instructing it to begin recording
data. Att1, Channel C sends a pulse to the stepper motor so that the spectrum measurement
begins on the initial counter reading, c0. Channel C then sends pulses in equal intervals of
∆t to the stepper motor. Once the counter has increased by 1, to c1, a pulse sent by Channel
B collects the data and records it in the first bin, Ch0, of the MCS software.
Before a spectrum measurement is performed, a timeT, called the dwell time, is decided
for the width of each bin. A dwell time of 60 s was typical for spectrum measurements.
∆t corresponds to 1/8th of the dwell time; this ∆t was typically 7.5 s. A sweep over some
interval of wavelengths, along with the dwell time, would be decided before a scan. This
would instruct the number of bins to use in the MCS software and for the counter sweep
for the spectrometer. This would be performed after using a calibration gas to relate the
counter reading to wavelength.
Figure 3.9: Timing diagram for spectrum measurements. Channel A corresponds to the initiating pulse. Channel C corresponds to the pulses sent to the stepper motor to rotate the diffraction grating. Channel B corresponds the times in which data was binned. The separation time between Channel C pulses, ∆t, is 1/8th of the dwell time, T. Note that ∆t is not the difference between t0 and t1—the interval between these t0 and t1 is 100 µs and has been exaggerated for this diagram.
The control box for the stepper motor can receive pulses from the BNC565’s Channel C
and pass them along to rotate the diffraction grating during spectrum measurements, but it
![Figure 3.5: The electron gun and Faraday cup units. Reproduced from Abdellatif [3].](https://thumb-us.123doks.com/thumbv2/123dok_us/1344106.1167277/46.612.85.546.434.674/figure-electron-gun-faraday-cup-units-reproduced-abdellatif.webp)
![Figure 3.6: The circuitry for the electronics of the electron gun and Faraday cup. Reproduced from [3].](https://thumb-us.123doks.com/thumbv2/123dok_us/1344106.1167277/49.612.165.447.78.640/figure-circuitry-electronics-electron-gun-faraday-cup-reproduced.webp)