EXPERIMENTAL STUDY ON EFFECT OF TEMPERATURE AND
REACTANT GAS VELOCITY ON OXIDATION OF
NUCLEAR GRAPHITE FOR HTGR
Ximing Sun1, Yujie Dong1, Yangping Zhou1*, and Zhengcao Li 2
1
Institute of Nuclear and New Energy Technology, Collaborative Innovation Center of Advanced Nuclear Energy Technology, Key Laboratory of Advanced Reactor Engineering and Safety of Ministry of Education, Tsinghua University, Beijing 100084, China
2
School of Materials Science And Engineering, Tsinghua University, Beijing 100084, China
*
Corresponding author: +86-10-62783555, [email protected]
ABSTRACT
The oxidation of nuclear graphite is inevitable as a result of impurities in helium coolant, and it will become more serious when air or steam ingress accident occurs in High Temperature Gas-cooled Reactor (HTGR). To investigate the oxidation behavior of a selected nuclear graphite (IG-110) used in HTGR, samples are oxidized at reaction temperatures from 400ºC to 1100ºC and reactant gas flow from 125ml/min to 500ml/min. Relationships between oxidation conditions and surface properties of the graphite are also elaborated by means of scanning electron microscopy and gas chromatography.
Keywords: Oxidation; HTGR; Nuclear graphite; IG-110
INTRODUCTION
It is one of the major problems for a High Temperature Gas-cooled Reactor (HTGR) that the nuclear graphite will be oxidized while being used as moderator, reflector and structural materials. Due to the impurities in helium coolant, graphite will be inevitably oxidized at temperature higher than 400ºC, and the oxidation will be accelerated when air or steam ingress accident occurs. Among the numerous reactions being concerned, the most important two reactions are indicated by IAEA (2012):
O2+ C= CO2 !H=-394.4kJ/mol (1)
C+ CO2= 2CO !H=171.5kJ/mol (2)
The prior experiments relevant to oxidation behaviour of nuclear graphite could be categorized as two types: investigation was performed in a Thermo Gravimetric Apparatus (TGA) allowing the weight loss to be measured directly during oxidation (Hinssen et al., 2008; Chi and Kim, 2008), or a chamber being coupled with an on-line mass spectrometer with the ability to analyze the components of exhaust gas (Story and Fruehan, 2000). It was reported that the samples with the weight of several milligrams could be accommodated by most commercial TGA instruments (Contescu et al., 2008), but it is difficult to predict the oxidation behaviour of monolithic graphite blocks based on the obtained results by using the powdered specimens. Because of the above reason, the latter method by using small pieces of graphite as it samples has been accepted as a reliable technique to study the oxidation behaviours of the monolithic graphite.
was much slow in comparison with diffusion process through the pore, and therefore the oxidation rate was mainly determined by the chemical reaction (the chemical kinetic controlled regime). At high temperature, the boundary layer controlled regime, the chemical reactivity is so high that almost all oxidation happens at the surface of the graphite. At intermediate temperature, the oxidation rate was determined by both chemical reaction and gas diffusion (the in-pore diffusion controlled regime).
Moreover, O’Brien et al. (1988) pointed out that the transition temperature among the regimes was also affected by the density, microstructure of the graphite and the size of the specimen, and therefore some factors, such as the length of oxidation time, should be considered since the microstructure of the graphite will be changed during oxidation.
In this work, the oxidation behaviour of the small pieces of graphite IG-110 was investigated by changing oxidation temperature and inlet gas flow rate. In order to obtain an exhaustive understanding of the oxidation of the graphite, the microstructure of graphite and the activation energy for oxidation were taken into account. The microstructures of graphite are observed with scanning electron microscopy (SEM), and the on-line gas chromatography was applied to evaluate the contents of CO2 and CO in outlet
gas under various oxidation conditions.
MATERIAL AND APPARATUS
Graphite sample
The test material, nuclear graphite IG-110, was provided by Toyo Tanso Co., Ltd. The graphite with a dimension of 28.5mm×28.0mm×1.95mm was used for the oxidation tests, which could be easily machined to fit the test section of our apparatus (29mm in diameter). The main properties of nuclear graphite IG110 are shown as Table 1, which are different from those of IG11 used in HTR-10 (Luo et al., 2004).
Table 1: Main properties of nuclear graphite IG110
Property Density [g/cm3]
Elastic modulus [GPa]
Compression strength [MPa]
Thermal conductivity [W/(m·K)]
Impurity rate [ppm]
Porosity [%] IG110 10.62 88.29 4.73 0.98 <20 21.6%
Experiment facility
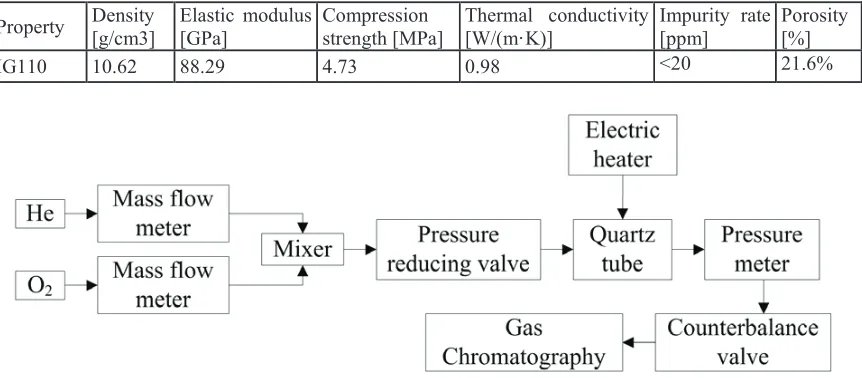
The sketch of the experiment facility designed for multi-component analysis is shown as Figure 1. The Helium and Oxygen are mixed in the mixer after flowing through the mass flow meter. The pressure of mixed gas is reduced by a pressure reducing valve before entering the quartz tube which is heated by two electric heaters. The components of the exhaust gas produced by oxidation reaction will be measured in an on-line manner after flowing through a counterbalance valve. In this experiment facility, reaction temperature ranges from 400-1200ºC while the flow rate of inlet reaction gas with O2 volume
concentration of 20% streams from 125-500ml/min under ordinary pressure. Before the oxidation experiment, the quartz tube is filled with helium.
RESULTS AND DISCUSSION
Effect of oxidation time
Usually, the oxidation happens not only on the outer surface of the graphite but also in the inner pores of it. The increase of graphite consumption with the oxidation process will change the outer surface and the inner pores of it, which finally have effect on the rate of oxidation. This change can be divided into two aspects: the oxidation will generate pores resulting in the increase of the effective reaction area and then the wall of pores will be oxidized resulting in the decrease of the effective reaction area. At the beginning of the oxidation, the generation rate of small channels is faster than the extinction rate of them and therefore the oxidation of graphite will be accelerated because of the increase of effective reaction area. And then, the extinction of small channels will be the dominant position making the oxidation slowly. Usually, the time point when the generation rate is approximately equal to the extinction rate is chosen as the sample time because the changes of oxidation rate are small and a kind of stable state is achieved at that time.
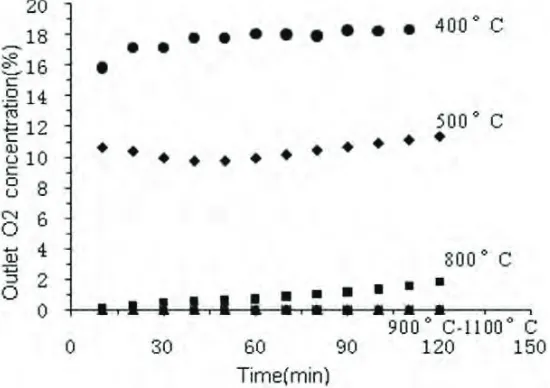
Fig.2 shows the volume concentration of O2 in the exhaust gas from the quartz tube at different
temperatures when the total flow of the inlet mixed reaction gas (O2 and He) is 200ml/min. The
temperatures of 400, 500, 800, 900, 1000 and 1100°C are selected to express different control regimes. At low temperatures, 400 and 500°C, the consumption of O2 by reaction is so small that O2 remained as
excess supply. Accordingly, the oxidation of the graphite is only determined by the chemical reaction itself. At higher temperatures from 800 to 1100°C, very few O2 existing in the exhaust gas indicates that
gas diffusion limits the oxidation rate in the boundary layer controlled regime. In general, it can be found that the change rates of the concentration of O2 in the exhaust gas are small at the time point of 60
minutes after the beginning of these experiments, which means the generation and the extinction of the small channels because of reaction (1) are in a temporary near balance, and therefore it is chosen as the sample time. In other parts of this paper, all experiment data are quoted at the time point of 60 minutes unless extra statements.
Effect of temperature on oxidation resultants
Fig. 3 shows the volume concentration of O2, CO and CO2 in the exhaust gas at different reaction
temperatures when inlet gas flow is 200ml/min. It can be found that the oxidation rate increases with the increase of temperature. At low temperatures from 400°C to 550°C, the oxidation reaction (1) increases greatly with the increase of temperature while O2 is excess and CO2 is the main resultants of the oxidation
reaction whose volume concentration increases from 1.9051% to 16.6854%. The volume concentration of CO is very small (0.7108% at 550°C). At intermediate temperatures, from 600 to 900°C, the depletion of O2 limits the oxidation rate and the volume concentration of CO2 at 900°C is almost same as that at 600°C.
At 900°C, CO begins to increase because the beginning of reaction (2). At the oxidation temperatures above 900°C, the chemical reaction (2) becomes faster which increase the volume concentration of CO in the exhaust gas. As a result, CO can be up to about 30% by volume concentration at 1200°C.
In summary, the oxidation of graphite can be divided into three categories similar to previous
study (Luo et al., 2004):the chemical kinetic controlled regime (400°C to 550°C), the boundary layer
controlled regime (above 900°C) and the in-pore diffusion controlled regime (600°C to 900°C).
Activation Energy of reaction (1)
The oxidation reactivity of graphite can be defined as follows:
dt t dW W
K 1 ( )
0 !
" (3)
where W0 is the initial weight of the sample, W(t) is the weight of the sample at time t.
It is well known that graphite oxidation rate follows an Arrhenius-type equation in the chemical kinetic controlled regime, and the reactivity K of carbon can be obtained according to the release rates of CO and CO2 resultants (Wu and Radovic, 2005). The relationship between K and T is defined as follows (Lim et
al., 2008): ) exp( 0 RT E A K a ! #
" (4)
0
ln
ln A
RT Ea
K "! $ (5)
where T is the absolute temperature, A0 is the pre-exponential factor, Ea is the activation energy, and R is
the gas constant.
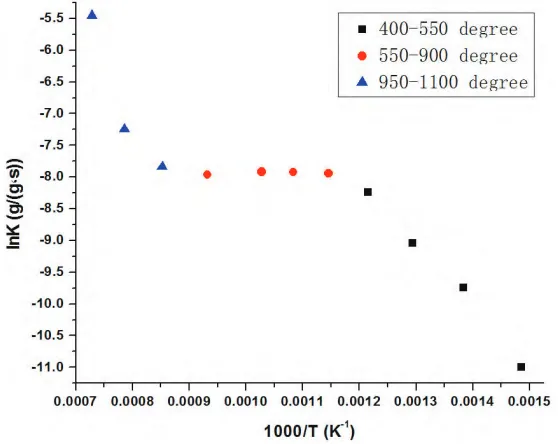
Figure 4. Relationship between temperature and oxidation reactivity
According to Figure 3, the relationships between lnK and 1000/T are obtained which are shown as Figure 4. From 400°C and 550°C, the slope of the fitting line is -10.4319 and Ea is 86.735kJ/mol. Analysis of experiment results from 600ºC to 900ºC shows oxidation reactivity keeps almost in stable in the intermediate temperatures where the reaction (1) is limited by the supply of O2 and reaction (2) needs
chemical reaction (1) and (2) which does not obey the linear Arrhenius-type relation for the elementary reaction model.
Effect of flow rate on graphite oxidation
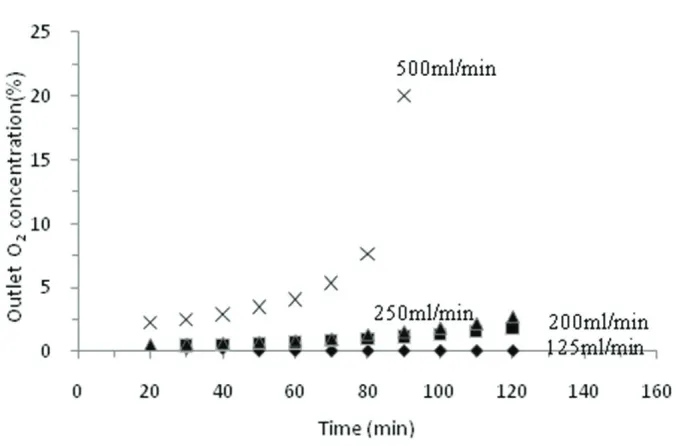
Figure 5 (a), (b) and (c) show the outlet gas concentration versus temperature at inlet gas flow rates of 125, 250 and 500ml/min. The oxidation of graphite will be obviously accelerated with the increase of the inlet gas flow rate which has two main effects on it. On the one hand, the increasing of flow rate will reduce the thickness of the boundary layer between the gas and graphite, which promotes the diffusion of gas to the inner of graphite, and therefore the start of the boundary layer controlled regime is postponed. In Figure 6, the fitting start temperatures of the boundary layer controlled regime are 986ºC (1258.85K), 1027.52ºC (1300.52K) and 1064.61ºC (1337.61K) corresponding to different inlet gas flow rates, 125, 250 and 500ml/min. On the other hand, the increase of inlet flow increases the O2 for reaction which
postpones the start of the in-pore diffusion controlled regime. Figure 7 shows the concentration of O2 in
the exhaust gas with the reaction time. It indicates that the O2 becomes excess quickly at the inlet flow
rate of 500ml/min in which the graphite is almost burned out within 100 minutes.
(b) Inlet gas flow of 250ml/min
(c) Inlet gas flow of 500ml/min
Figure 6. Change of concentration of O2 in exhaust gas
SEM observation of graphite oxidation
Figure 7 shows the change of surface of IG-110 graphite after corrosion by micrographs when the inlet gas flow is 200ml/min. It can be found that oxidation corrosion happens not only on the outer surface
of the graphite but also in the inner of it. The pores become obviously widening and deepening at
450ºC and 650ºC. The surface at 1000ºC does not have obvious difference with that at 650ºC indicating the effective reaction areas from 650 to 1000ºC are close.
(c) 650ºC (d) 1000ºC
Figure 7. SEM micrographs of surface of IG-110 graphite with different reaction temperatures
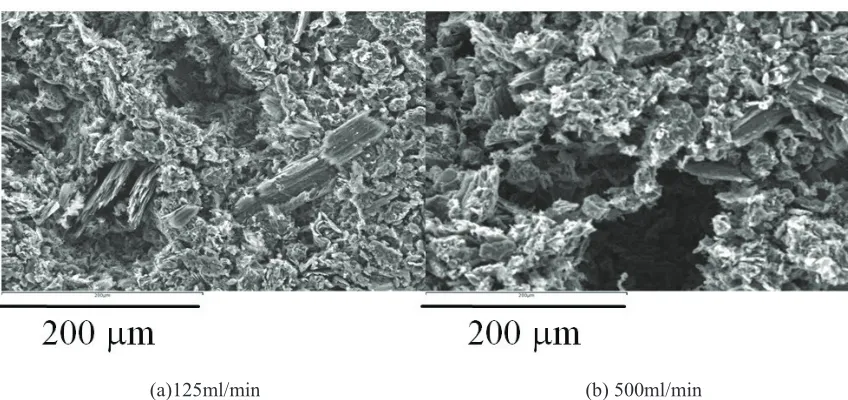
The effects on graphite surface with different inlet gas flow rates are compared for the validation of the agreement between test data and microstructure results. Figure 8 shows the graphite surfaces after corrosion at different inlet gas flow rates (125ml/min and 500ml/min) which confirms the previous analysis that the larger flow can aggravate the surface of graphite. The various graphite surfaces result in different effective reaction areas which is one of the reasons why the corrosion rates are quite different at different inlet gas flow rates.
(a)125ml/min (b) 500ml/min
CONCLUSIONS
The influences of temperature and inlet gas flow rate on the oxidation corrosion behaviour of nuclear graphite IG-110 are investigated:
At the low temperature of the chemical kinetic controlled regime, the oxidation reaction that mainly is reaction (1) will be accelerated by the increase of temperature. At the high temperature of the boundary layer controlled regime, the oxidation reaction that is the combination of reaction (1) and (2) will also be accelerated by the increase of temperature. Within the range of the intermediate temperature of the in-pore diffusion controlled regime, the oxidation reaction that mainly is reaction (1) keeps almost stable when increasing the reaction temperature.
The increase of the inlet gas flow rate in a certain range will accelerate the graphite corrosion in all three control regimes. Under the situation of the related small flow rate, there is an obvious in-pore diffusion controlled regime. The increase of inlet gas flow will weaken the in-pore diffusion controlled regime.
Further studies are needed to investigate the mechanisms of above phenomena by using scanning electron microscopy and gas chromatography.
AKNOWLEDGMENTS
The work of this paper is sponsored by Chinese Major National S&T (ZX069).
REFERENCES
Chi, S.H. and Kim, G.C. (2008). “Comparison of the oxidation rate and degree of graphitization of selected IG and NBG nuclear graphite grades,” Journal of Nuclear Materials, UK, 381(1-2) 9-14. Contescu, C.I., Azad, S., Miller, D., Lance, M.J., Baker, F.S. and Burchell, T.D. (2008). “Practical
aspects for characterizing air oxidation of graphite,” Journal of Nuclear Materials, UK, 381(1-2) 15-24.
Fuller, E.L. and Okoh, J.M. (1997). “Kinetics and mechanisms of the reaction of air with nuclear grade graphite: IG-110,” Journal of Nuclear Materials, UK, 240 241-250.
Hinssen, H. K., Kühn, K., Moormann, R., Schlögl, B., Fechter, M. and Mitchell, M. (2008). “Oxidation experiments and theoretical examinations on graphite materials relevant for the PBMR,” Nuclear Engineering and Design, UK, 238(11) 3018-3025.
IAEA. (2000). “Irradiation damage in graphite due to fast neutrons in fission and fusion systems,” IAEA-TECDOC-1154. IAEA, Vienna, 207-213.
Lim, Y.S., Chi, S.H and Cho, K.Y. (2008). “Change of properties after oxidation of IG-11 graphite by air and CO2 gas,” Journal of Nuclear Materials, UK, 374 123-128.
Luo, X.W., Robin, J.C. and Yu, S.Y. (2004). “Effect of temperature on graphite oxidation behavior,” Nuclear Engineering and Design, UK, 2004(27) 273-280.
O’Brien, M.H., Merrill, B.J. and Ygaki, S.N. (1988). “Combustion Testing and Thermal Modeling of Proposed CIT Graphite Tile Materials,” EGG-FSP-8255, Idaho National Engineering and Environmental Laboratory, Idaho Falls, Idaho, USA.
Story. S.R. and Fruehan, R.J. (2000). “Kinetics of oxidation of carbonaceous materials by CO2 and H2O between 1300°C and 1500°C,” Metallurgical and Materials Transactions B: Process Metallurgy and Materials Processing Science, 31(1) 43-54.