Soil Properties Prediction using Ensemble
Regression Technique
Smriti Singhatiya1, Dr.Shivnath Ghosh2
P.G. Student, Department of Computer Science and Engineering, MPCT, Gwalior, India1
Associate Professor, Department of Computer Science and Engineering, MPCT, Gwalior, India2
ABSTRACT: It is practically impossible to measure soil properties continuously at each location across the globe. Therefore, it is necessary to have robust systems that can predict soil properties at a given location. That is needed in many tropical countries where the dearth of soil property measurements is large. For prediction of soil property an algorithm is designed in which data is first of all normalized by mean normalization and then soil properties are forecasted using random forest ensemble technique. The results showed that the stepwise regression models based on ensemble technique and the spatial distributions of the soil properties such as ph level, calcium carbonate, electric conductivity and organic carbon.
KEYWORDS: Soil Properties, Soil Fertility, PH, Calcium Carbonate, Machine Learning.
I. INTRODUCTION
Soil is very important for plant life. It consists of solids (minerals and organic matter), liquids (water and solutes) and gases (mainly oxygen and carbon dioxide) and contains living organisms. All these elements provide their physical and chemical properties. To maintain fertility, achieve better yield and protect the environment, it is necessary to nurture the soil properly. On the other hand, soil tests are essential to manage it properly. A soil test is the study of a soil sample to discover an additional substance, its composition and various attributes. As a general rule, soil tests are performed to determine the wealth and indicate the gaps to be corrected [3]. The analysis of soil nutrients is very useful for the farmer in determining the type of yield to be grown in a particular soil condition.
Soil fertility, which refers to the intrinsic capacity of the soil to provide essential nutrients to plants in sufficient and adequate proportions for optimal growth, is one of the key elements for determining soil productivity. The management of Indian soil fertility requires sustainable high-level production to produce adequate food for the growing population. Good soil fertility management requires careful identification of the limits of current nutritional deficiencies and monitoring of changes in soil fertility to predict their shortage [4]. These gaps must be mitigated by sound and best practices in terms of nutrients, water, plants and energy for soil management, in order to maintain food production at a reasonable level to ensure high productivity at the same time. future. Therefore, managing soil fertility at optimal levels is one of the key factors for achieving high and sustainable productivity [5,6].
cultivation. Fluctuations in nutrient intake are a natural phenomenon and some of them may be sufficient while others are inadequate [6].
Data Mining (DM) becomes popular in the field of agriculture for soil classification, wasteland management and crop and pest management. In [1] assessed the variety of association techniques in DM and applied into the database of soil science to predict the meaningful relationships and provided association rules for different soil types in agriculture. Similarly, agriculture prediction, disease detection and optimizing the pesticides are analyzed with the use of various data mining techniques earlier [2].
In [3] analyzed J48 classification algorithm in high accuracy for predict the soil fertility rate. In4 investigated the uses of various DM techniques for knowledge discovery in agriculture sector and introduced different exhibits for knowledge discovery in the form of Association Rules, Clustering, Classification and Correlation.
In [5] predicted the soil fertility classes using with classification techniques were Naïve Bayes, J48 and K-Nearest Neighbor algorithms.
In [6] used Adopted data mining techniques to estimate crop yield analysis. Multiple Linear Regression (MLR) method was used to find the linear relationship between dependent and independent variables. K-Means clustering approach was also use to form four clusters considering Rainfall as key parameter.
In [7]analyzed the vegetative factors of landslides in the Shimen reservoir watershed in northern Taiwan. Decision tree, Bayesian Network data mining techniques and the non-linear approaches were implemented. Optimization based Bayesian Network approach was considered as better than non-linear.
In [8] analyzed the virtual significance of soil fertility and the crop management factors to predict the maize yields and in determining the yield variability and the gap between farmers. Classification and regression tree analysis was used to predict the result. In [9] investigated two comprehensive methods to calculate the production related yield gap and a soil fertility related nutrient balance. The methodology allows knowledge from micro-scale to higher-scale levels and determines land quality.
In [10] predicted soil attributes and analyzed soil data using classification techniques. Soil properties such as pH value, Electrical Conductivity (EC), Potassium, Iron, Copper, etc. were classified using classification algorithms like Naïve Bayes, J48 and JRip. Among the algorithms, J48 was considered as simple classifier and produced better result.
Data Mining is essential to discover the agricultural relatedknowledge such as soil fertility, yield prediction and soilerosion. Soil prediction helps to for soil remedy and cropmanagement. Classification algorithms involve findingrules that partition the data into disjoint groups. A set ofclassification rules are generated by such a classificationprocess, which can be used to classify future data [11].
II. SOILPROPERTIES
Soil Properties that are determined in this paper are discussed below:
Soil Ph
Soil pH of studied area was found in the range of 7.2 - 8.6 under different villages with the average value of 8.0. Higher Phof the samples indicate towards the fact that the soils are infested with alkalinity.
Electrical conductivity
In the present study conductivity values shows a considerable variation with type of topography of soils. The normal EC may be ascribed to leaching of salts to lower horizons.
Organic carbon
The low organic carbon content in these soils may be attributed to the poor vegetation and high rate of organic matter decomposition under hyperthermic temperature regime which leads to extremely high oxidizing condition. Removal of the surface soils containing high organic carbon due to erosion was responsible for the lower organic carbon.
Calcium carbonate
Calcium carbonate content in the surface soil samples of different blocks of Ashoknagar district was distributed in varied from 0.5 to 3.5% with a mean value of 1.8 %, In semi-arid regions, since rainfall is less as compared to annual evapo-transpiration, less water in available for the leaching of insoluble carbonates and bicarbonates of calcium.
III.PROPOSED METHODOLOGIES
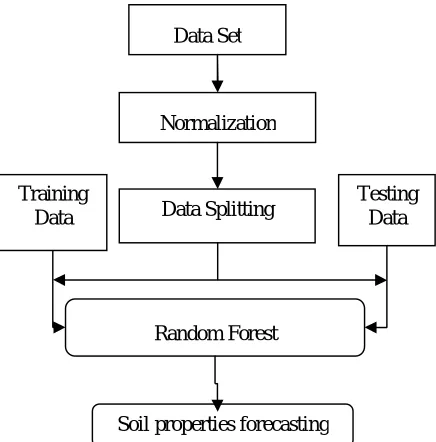
In this paper, an algorithm is proposed which provide a way to predict the soil property forecasting. Figure 1 shows the overall architecture for prediction of soil property. The proposed work is designed for forecasting the soil property using Random Forest (RF). Following diagram describes flow of soil property forecasting System.
Normalization Data Set
Data Splitting Testing Data Training
Data
Proposed Flow Chart
Input: D {load data};
Output: forecast properties of soil
Step1: Normalization of data, D
Step2: For each entity in D, do
Find feature vector (V) from D
Step 3: For each V do
Predict using Ensemble regression technique
Step 4: Determine the error
Find Performance Parameters i.e. MSE, RMSE, MAE, MAPE
end for
Random Forest
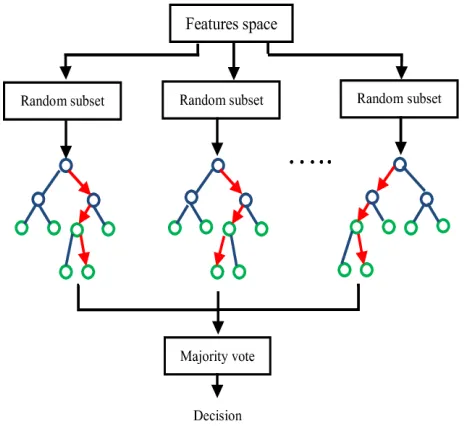
Random Forest machine learning algorithm is capable of performing both regression and classification tasks. In random forest technique several decision trees are formed and algorithm combines the rules of these decision tree and produces an ensembled learning rules for prediction. By using ensemble of these decision trees the model produces the accurate and precise results because it is intended with deep and different experienced learnings of several decision tree. As random forest is collection of different weak classifier and combinedly forms strong classifier which can produce prediction and deep insight into the dataset.
For training purpose the algorithm is given with random samples of dataset from which all weak decision trees learn and generates learning rules. Further by combining these rules the random forest generates a strong classifier that is combination of all these weak classifiers.
The prediction is made on testing dataset. The algorithm predict the results by applying the learning rules and generates the output in form of class or label.
After making different decision trees then voting is performed among them to generate strong learner. This process is termed as “bagging”. In growing strong decision tree, exhaustive searches across all possible weak decision trees is conducted to find the possible path in the tree. Before applying training data there is automatically available holdout data termed as “Out of Bag(OOB)” data. Every decision tree that are generated have different OOB because every tree has a different training samples. Keeping track of for which trees a specific record was OOB allow as to easily and effectively evaluate Random Forest performance.
IV.RESULT ANALYSIS
A. Performance Evaluation
The relationship between available nutrients with different soil properties were performed using ensembled regression (ER) is analysed. The performance measures are discussed below:
Mean Square Error (MSE)
MSE of any estimator (classifier) measures the average squares of errors or deviations, i.e. the difference between the estimator and what is estimated. MSE is a risk function corresponding to the expected value of the squared error loss.
= 1( − ) (1)
Root Mean Square Error (RMSE)
RMSE is a parameter that determines the difference in squares between the output and the input.
=√ (2)
Mean Absolute Error (MAE)
MAE measures the average size of errors in a series of forecasts regardless of their direction. This is the average of absolute differences between prediction and actual observation, in which all individual differences are also weighted.
=1 − (3)
Mean Absolute Percentage Error (MAPE)
The mean absolute percentage error (MAPE) is a measure of the predictive accuracy of a forecasting method in statistics, for example in estimating the trend. It usually expresses the precision in percentage and is defined by the formula:
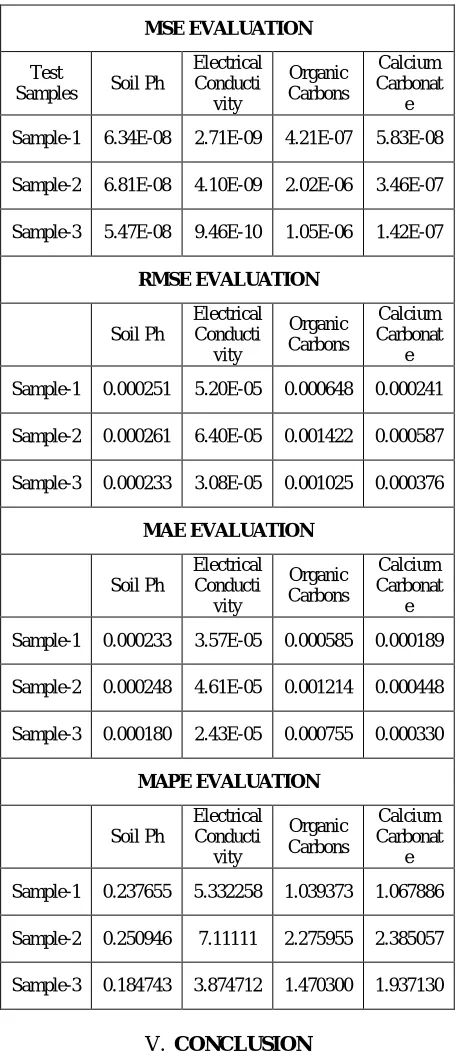
Table 1: Performance Evaluation for Soil Properties Prediction
MSE EVALUATION
Test
Samples Soil Ph
Electrical Conducti vity Organic Carbons Calcium Carbonat e
Sample-1 6.34E-08 2.71E-09 4.21E-07 5.83E-08
Sample-2 6.81E-08 4.10E-09 2.02E-06 3.46E-07
Sample-3 5.47E-08 9.46E-10 1.05E-06 1.42E-07
RMSE EVALUATION Soil Ph Electrical Conducti vity Organic Carbons Calcium Carbonat e
Sample-1 0.000251 5.20E-05 0.000648 0.000241
Sample-2 0.000261 6.40E-05 0.001422 0.000587
Sample-3 0.000233 3.08E-05 0.001025 0.000376
MAE EVALUATION Soil Ph Electrical Conducti vity Organic Carbons Calcium Carbonat e
Sample-1 0.000233 3.57E-05 0.000585 0.000189
Sample-2 0.000248 4.61E-05 0.001214 0.000448
Sample-3 0.000180 2.43E-05 0.000755 0.000330
MAPE EVALUATION Soil Ph Electrical Conducti vity Organic Carbons Calcium Carbonat e
Sample-1 0.237655 5.332258 1.039373 1.067886
Sample-2 0.250946 7.11111 2.275955 2.385057
Sample-3 0.184743 3.874712 1.470300 1.937130
V. CONCLUSION
conductivity. The result analysis is performed with different test samples. Three different test data samples are analysed. From result analysis it has been concluded that ensembled regression technique with respect to MSE, RMSE, MAE and MAPE.
REFERENCES
[1] Geetha MCS. Implementation of association rule mining for different soil types in agriculture. International Journal of Advanced Research in Computer and Communication Engineering. 2015 Apr; 4(4):520–2.
[2] Solanki J, Mulge Y. Different techniques used in data mining in agriculture. International Journal of Advanced Research in Computer Science and Software Engineering. 2015 May; 5(5):1223–7.
[3] Bhuyar V. Comparative analysis of classification techniques on soil data to predict fertility rate for Aurangabad District. International Journal of Emerging Trends and Technology in Computer Science. 2014 Mar-Apr; 3(2):200–3.
[4] Fathima NG, Geetha R. Agriculture crop pattern using data mining techniques. International Journal of Advanced Research in Computer Science and Software Engineering. 2014 May; 4(5):781–6.
[5] Suman, Naib BB. Soil classification and fertilizer recommendation using WEKA. International Journal of Computer Science and Management Studies. 2013 Jul; 13(5):142–6.
[6] Ramesh D, Vardhan VB. Data mining techniques and applications to agricultural yield data. International Journal of Advanced Research in Computer and Communication Engineering. 2013 Sep; 2(9):3477–80.
[7] Tsai F, Lai JS, Chen WW, Lin TH. Analysis of topographic and vegetative factors with data mining for landslide verification. Ecological Engineering. 2013 Dec; 61:669–77.
[8] Tittonell P, Shephered KD, Vanlauwe B, Giller KE. Unravelling the effects of soil and crop management on maize productivity in small holder agricultural systems of Western Kenya - An application of classification and regression tree analysis. Agriculture, Ecosystems and Environment. 2008 Jan; 123(1-3):137–50.
[9] Bindraban PS, Stroorvofel JJ, Jansen DM, Vlaming J, Groot JJR. Land quality indicators for suitable land management: Proposed methods for yield gap and soil nutrient balance. Agriculture, Ecosystems and Environment. 2000; 81:103– 12.
[10] Gholap J, Lngole A, Gohil J, Shailesh, Attar V. Soil data analysis using classification techniques and soil attribute prediction. 2012 Jun; 9(3):1– 4.