75
Export market diversification and export performance of Sri Lanka: a cointegration
analysis
T. Bhavan
Department of Economics, Faculty of Commerce and Management, Eastern University, Sri Lanka.
ARTICLE HISTORY:
Received: 29-Mar-2017 Accepted: 24-April-2017 Online available: 10-May-2017
Keywords:
Market diversification, Export performance, Cointegration analysis, Herfindahl index, Sri Lanka
ABSTRACT
This paper aims to investigate the existence of geographical export market diversification and its relations with export performance of Sri Lanka. The paper identifies the existence of geographical export market diversification by using Herfindahl Index, and empirically investigates the long run and the short run relationship between market diversification and export performance. The time series data extracted from the World Bank database are used to construct Index and appropriate variables. Johansen’s co-integration analysis was performed to investigate the relationships between export market diversification over a period 1999 to 2015. The trend of the Herfindhal Index reveals that market diversification exists in the structure of export patterns. The findings derived from the analyses further suggest that the existence of geographical export market diversification of Sri Lanka has long run relationship with export performance.
Contribution/ Originality
The major contribution of this paper is that it classifies export market share to reveal structural changes among export partnering countries of Sri Lanka and detects the degree of geographical export market diversification. Furthermore, the findings of this paper add new knowledge to the existing literature in Sri Lankan perspective, and this would be useful to trigger off sound policies to come out from the trade deficit trap.
DOI: 10.18488/journal.1007/2017.7.4/1007.4.75-83 ISSN (P): 2306-983X, ISSN (E): 2224-4425
Citation: T. Bhavan (2017). Export market diversification and export performance of Sri Lanka: a cointegration analysis. Asian Journal of Empirical Research, 7(4), 75-83.
© 2017 Asian Economic and Social Society. All rights reserved
Asian Journal of Empirical Research
Volume 7, Issue 4(2017): 75-8376
1. INTRODUCTION
Sri Lanka has been experiencing trade deficit since 1977 where the trade liberalization policy was materialized. Of course, the trade deficit is not always problematic, but however Sri Lanka’s trade deficit has drawn much concern because of its trend, causes, composition and size, and becoming extremely crucial for last two decades, alarming policy makers to pay immediate attention to sound policies to recover the external sector. The indicators of external sector of Sri Lanka are not producing favorable and constructive information over the recent decades. Especially, for the last two decades, the trend and prognosis of trade balance, tariff and non-tariff barriers, the extent of product and market concentration, and productivity of the resource and factors are becoming a vitally debatable topic in the Sri Lankan context. As a whole, the present and past trend, and the forecasted trade balance have not given any hope for the external sector of Sri Lanka.
The export performance of goods and services as a percentage of GDP has considerably declined from 35% in 1995 to 21% in 2009. After 2009 the trend was manageable to seem stable with minor fluctuation between 21% and 23%. However, the balance of trade has been significantly increased in negative term for last two decades with the record of the average trade deficit is 475.70 million USD from 2003 until 2016 that was peaked to 1100 million USD in 2011, and recorded at 922 million USD at the end of 2016. Moreover, Sri Lankan share in global export and share of GDP has been in decline (Saman, 2013) whereas imports in increase because inescapably the government revenue, post war growth and exports are heavily dependent on imports. Thus, it is seriously noted that the expansion between export and import has been increasing after 2009, alarming to see more concentration over this sector.
Asia has a low degree of export concentration despite it is identified as a region with the highest export dependency. However, the case of Sri Lanka draws much attention with opposite characteristics. Export market structure and products are labeled as highly concentrated. Though, the concentration pattern can be identified in both production and export market, the objective of this study is only focusing on export market diversification but excludes investigation on product diversification. Sri Lanka’s exports were highly depended on the EU and North-American markets recorded at 69.6% in 1999, of which market shares for USA and UK were 39.9 % and 13.4%, and later in 2000 which were 41.2% and 13.70%, respectively. Others were shared among other EU member countries. The export is partnering countries in this market are UK, Germany, Belgium, Netherlands, France, Italy, Turkey, Canada, and the USA. The rest of the market share is recorded of some Arabic, Asian, and other countries. However, the motivation of this study was triggered because of the notable change in the geographical export market share of Sri Lanka since 2000. That is the market share for the USA market has declined from 41.2% in 2000 to 21.28% in 2010, and then has a slight improvement to 27.7% in 2015, whereas the market share of UK declined from 13.7% in 2000 to 10% in 2015. At the same time, market share of Asian, Arabic, and other number of countries that have very less market share each, together have an improvement during this period. Further, it should be noted here that while the overall export performance of Sri Lanka is on the decline there is a change in the structure of market share. Therefore, this study measures the degree of geographical export market diversification and investigates whether this export market diversification can be motivated to be used as a one of the strategies by policy makers among other policy moves such as investment promotion, import substitution, trade liberalization etc.
77
trade literature (Jerzy et al., 2012) because the countries that have more diversified export (Horizontal and vertical product) will have stable export revenue and which would lead to long-run growth (Dierk and Felicitas, 2007; Fahim, 2010; Sheila and Michael, 1997; Manuel, 2008). On the contrary, highly concentrated market or product would lead vulnerable condition in export performance and export revenue stream (Federico and Kiichiro, 2003). On the other hand, the countries that have a high concentration in export also have much deviation in export earnings. At the same highly concentrated product structure naturally set the country to move towards highly concentrated in export market. Sri Lanka has to factor endowment to be characterized to have concentration over a less number of products. This structure associates with the theories of Devid Ricardo and Heckscher-Ohlin models, implying that factor endowment accelerates international trade but not about diversification. Therefore, the characteristics of concentrated export market structure are also streamlined with factor endowment and export product mix of Sri Lanka. Not surprisingly, a wide range of product only would lead to have the opportunity to get a wide range of international markets (Michael et al., 1997). When exports are more diversified the country can enjoy knowledge spillover, productivity improvement, efficient management, low risk, and technical and technology enhancement (Gutierrez-Pineres and Ferrantino, 2000; Chan et al., 1993). Export diversification also reduces exposure to external shocks, macroeconomic volatility (Manuel et al., 2011). Moreover, market diversification will enable export firms to make use of excess manufacturing capacity by fully exploit available economies of scale and finally achieve stabile status (Craig and Yunus, 2009). In addition, increasing levels of diversification will have positive effects on performance due to economies of scope and scale, market power effects, risk reduction effects and learning effects (Michael et al., 2000). Ade (1993) also emphasized that market diversification strategy produces better performance in the case of MNEs than market concentration strategy. According to Jean-Emile and Daniel (1985), based on U.S market, slow expansion exporters have the characteristics on the high concentration market whereas moderate and rapid exporters are characterized by greater market diversification. Craig and Yunus (2009) have concluded that chances to diversify into new markets being a significant predictor of export marketing performance. According to Michael et al. (2000) diversification strategy has significant effects on the performance of Japanese multinational companies. Opinion of Craig and Yunus (2009) is that micro and macro level of export of goods and services are becoming important for the survival of domestic firms and to overcome trade deficit issues. In contrast, Sheila and Michael (1999) found that export diversification does not cause growth in the case of Colombia. Adding to that George (2001) has also classified diversification into three, such as product, functional and geographic diversification and concluded that diversification and the direction of diversification collectively explain a higher proportion of the export and sales stability only for unrelated product diversification but not for geographical or functional diversification.
The rest of the paper is organized as follows. Section 2 measures and discusses existence of export market diversification. Section 3 presents analytical methods and briefly discusses empirical findings. The final section summarizes the main results and concludes with policy suggestions.
78
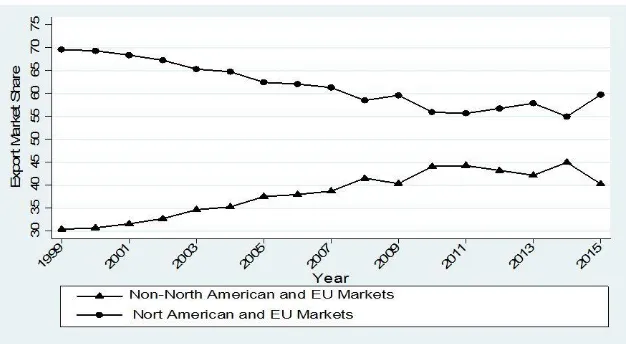
Figure 1: Change in market share of Sri LankaSource: World Bank World Development Indicators
The annual time series data, running from 1999 to 2015, were extracted from the World Bank Development Indicators database to measure market share and index, and construct variables. The whole export market share for Sri Lanka can generally be classified as EU, North American, Asian, Arabic, and other countries. However, this study classifies the whole export market into two (North American and EU Market, and Non-North American and EU market) to avoid complication in figures and to have a clear disclosure of the structural change in export market pattern. The first category includes North American and EU countries that played a major role entertaining Sri Lankan products, and ensured stable export revenues to Sri Lankan exporters. Thus, North American and EU market include USA, Canada, UK, Italy, German, Belgium, Netherland and France. The second category includes Asian, Arabic, Australia and other countries. The Figure 1 shows the horizontal bottle shaped curves that disclose how market concentration get diversified among the above said two groups of markets over the period of 1999 to 2015. The upper boundary curve continuously falls till 2010 and takes stable with minor volatile. The lower bound curve has a synchronized move upward. Thus, this trend clearly shows that due reasons market concentration of a less number of countries, particularly
USA and UK is getting diversified over a relatively wide range of Asian and Arabic countries.
For more in detail, the Herfindahl Index (HI) which is commonly used for concentration studies, sometimes called as Hirschman-Herfindahl index (HHI) (Manuel et al., 2011), is used to measure the existence of market diversification and its trend. The formula used is the following:
HI = ∑(Si2) 𝑛
𝑖=1
79
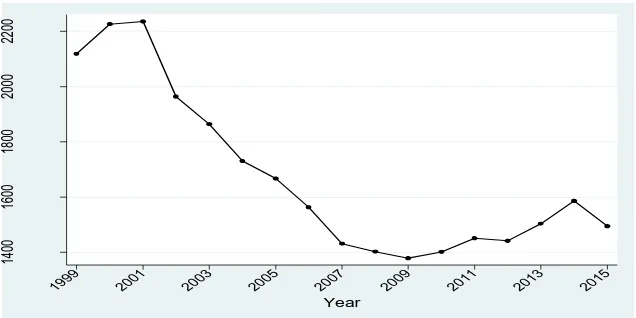
Figure 2: Trend of herfindahl indexThe Figure 2 shows the trend of Herfindahl Index that indicates transformation in market concentration. A steady decline of the Index value from 2100 to 1500 over the period indicates declining in concentration and move towards market diversification.
3. ECONOMETRIC METHODS
Though the index has clearly defined that Sri Lanka’s export market is streamlined with diversification, however, the relevant econometric techniques are required to test whether the export market diversification has any relationship with export performance because though the export performance is on decrease, the market diversification may serve as one of the pushing factors of export performance. Therefore, this paper employs Co-integration analysis to test long run as well as short run dynamic relations.
3.1. Model Specification
In this paper the empirical model form for the specification can be formed as follows:
𝑙𝑛𝑒𝑥𝑔𝑑𝑝𝑡= 𝛽0+ 𝛽1𝑙𝑛ℎ𝑒𝑟𝑓𝑖𝑛𝑡+ 𝛽2𝑙𝑛𝑤𝑝𝑐𝑖𝑛𝑡+ 𝛽3𝑙𝑛𝑖𝑚𝑝𝑡+ 𝛽3𝑙𝑛𝑖𝑛𝑓𝑡+ 𝜀𝑡 …………. (1)
where, lnexgdp islogarithm of export as a percentage of GDP, lnherfin is logarithm of Herfindhal Indexserves as a proxy variable of market diversification , lnwpcin is logarithm of weighted average of per capita income of export partnering countries, lnimp is logarithm of imports, lninf is logarithm of inflation, and ε and t are error term and time respectively.
3.2. Unit root test
The Augmented Dickey-Fuller (ADF) was performed in order to test stationary properties of time series data because OLS technique with the non stationary property will result in a spurious regression. The ADF test here consists of estimating the following regression.
∆𝑌𝑡= 𝛷 + 𝛽𝑡+ 𝛿𝑌𝑡−1+ ∑𝑚𝑗−1αi∆Yt−i+ εt …………. (2)
where, ∆ is the first difference operator, m is lag, t indicates trend, 𝛷,β,δ and α are parameters to be estimated and ε denotes a stochastic error term. A series Ytissaid to be integrated of order ddenoted
by Yt ~I(d) if it becomes stationary after differencing d times and thus Yt contains d unit roots. A series which is I(0) is said to be stationary. The optimum lag length was selected using Schwarz Bayesian Criterion (SBC).
14
00
16
00
18
00
20
00
22
00
H
er
fin
da
hl
In
de
x
1999 2001 2003 2005 2007 2009 2011 2013 2015
80
Table 1: Unit root analysis resultsVariables
Test statistic at Level
Test static at first difference
Lag
Deterministic Critical Values
Order of Integration
Term 1% 5% 10%
lnexgdp -0.474 -3.331 0 Constant -2.65 -1.771 -1.35 I (1)*** lnherfin -1.424 -2.666 0 Constant -2.65 -1.771 -1.35 I (1)*** lnwpcin -0.05 -9.51 4 Trend -4.38 -3.6 -3.24 I (1)*** lnimp -1.387 -3.939 1 None -3.75 -3 -2.63 I (1)***
lninf -3.584 -- 0 None -- -- -- I (0)***
*, **, *** indicate 10%, 5% and 1% significant levels, respectively
The Table 1 shows the results of the unit root analysis of the variables incorporated into the study. According to the results, the null hypothesis that no unit root can be rejected for the variables lnexgdp, lnherfin, lnwpcin and lnimp as they are non stationary but become stationary at first difference I (1). Null hypothesis cannot be rejected for the variable lninf as it is stationary I(0).
Co-integration Analysis
Johansen (1988) proposed a general framework for considering the possibility of multiple cointegrating vectors. Johansen’s methodology begins with the point in the Vector Auto Regression (VAR) of order p given by
𝜡t = 𝛷 + 𝛶1𝜡t-1 + 𝛶2𝜡t-2+……+ 𝛶p𝜡t-p + εt ………. (3)
where, 𝜡t is an n x1 vector of the variables that are integrated of order one denoted as I (1), εt is an
n x 1 vector of innovations while 𝛶1 through 𝛶p are m x m coefficient matrices. The VAR (p) can be reformulated in a vector error correction model as follows:
∆𝜡 = 𝛷 + Γ1∆𝜡t-1 + Γ2∆𝜡t-2+…..+ Γp-1∆𝜡t-p+1+ Π𝜡t-1 + εt ………. (4)
where, the matrix Π contains information on the long run relationships. Hence, the cointegration analysis is employed to test the long run relationship among the variables. The Johansen’s multiple-trace test method was adopted in determining the number of cointegrating equations. The Schwarz Bayesian Criterion (SBC) method was used to select an optimum lag length.
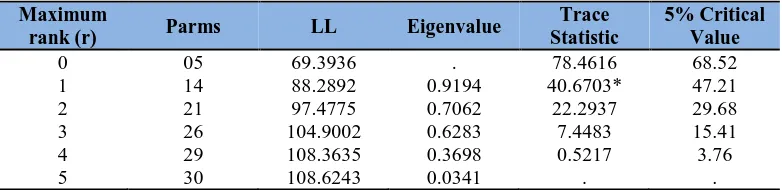
Table 2: Johansen tests for cointegration
The trace statistics in Table 2 at r = 0 of 78.4616 exceeds the critical value of 68.52, leads to reject the null hypothesis that no integrating equations among the variable, but at r = 1 results that one co-integrating vector exists between the variables. Since the variables are found to have a coco-integrating relationship, the Vector Error Correction method (VECM) is employed to describe the dynamic interrelationship among the stationary variable.
Maximum
rank (r) Parms LL Eigenvalue
Trace Statistic
5% Critical Value
0 05 69.3936 . 78.4616 68.52
1 14 88.2892 0.9194 40.6703* 47.21
2 21 97.4775 0.7062 22.2937 29.68
3 26 104.9002 0.6283 7.4483 15.41
4 29 108.3635 0.3698 0.5217 3.76
81
Table 3: Normalized cointegration coefficientsVariables coefficients Standard Error t-value p-value
lnexpgdp 1 - - -
lnherfin -0.702 0.274 -2.560 0.010
lnpcinw -4.294 0.883 -4.860 0.000
lninf 0.393 0.036 10.810 0.000
lnimp -0.248 0.105 -2.360 0.000
cons 0.031 - - -
The Table 3 shows the results of normalized cointegration coefficients. The results disclose that all variables are statistically significant at the 1% level. Hence, the model can be formed by reversing the signs according to Johansen’s method as follows:
𝑙𝑛𝑒𝑥𝑝𝑔𝑑𝑝 = 0.0313 + 0.7019 𝑙𝑛ℎ𝑒𝑟𝑓𝑖𝑛𝑡+ 4.2942 𝑙𝑛𝑝𝑐𝑖𝑛𝑤𝑡− 0.3937 𝑙𝑛𝑖𝑛𝑓𝑡+ 0.2485𝑙𝑛𝑖𝑚𝑝𝑡 .. (3)
Since all variables are in logarithm, the coefficient values explore elasticity values of each variable. Except inflation other variables are positively associated with export performance. Thus, the coefficient for Herfindhal Index shows that if market diversification is 10% there will be a 7% increase in export, revealing that market diversification for Sri Lankan export will stimulate export volume. The coefficient value of the weighted average of per capita income of the people in the export partnering country is relatively high and indicating 40% export increase in association with a 10% increase in per capita income. Further, a 10% increase in import is likely promoting export by 24%. Obviously, the association between export performance and inflation found to have negative, indicating that 3% export declines can be in association with 10% of inflation.
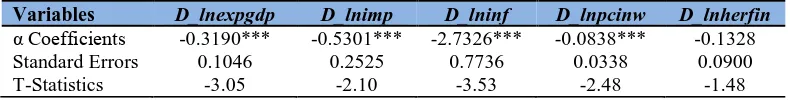
Table 4: Error correction model
*, **, *** indicate 10%, 5% and 1% significant levels, respectively
The Table 4 shows the results of the Error Correction model of Johansen’s method. According to the results, except the variable of Herfindhal Index, all other variables are found to have statistically significant at 1%, revealing that they have a significant effect on export performance in the short run where as the Herfindhal Index does not have a short run effect. The coefficient for D_dlnexpgdp discloses that the speed of adjustment to the long run equilibrium is significant and can be concluded that 31% of deviation would be eliminated annually.
4. CONCLUSION AND POLICY RECOMMENDATION
The principle objective of this study was to investigate whether export market diversification can promote export performance in Sri Lanka. The results detected the existence of diversification among the export partnering countries of Sri Lanka. The results obtained from econometric analyses suggest that there is optimism for Sri Lanka’s external sector to enhance trade performance by concentrating on market diversification strategies. However, export market diversification is a slow process and this process need to be sustained by appropriate strategies (Federico and Kichiro, 2003). The important thing is what sort of strategies likely promotes export market diversification and how the strategies are listed of government priorities are much more questionable (Olivier et al., 2013). Further, though the export growth is certainly caused by market diversification, it also depends on the foreign market mix (Jean-Emile and Daniel, 1985). While Patrick (2007) and Manuel (2008) recommend quality of
Variables D_lnexpgdp D_lnimp D_lninf D_lnpcinw D_lnherfin
α Coefficients -0.3190*** -0.5301*** -2.7326*** -0.0838*** -0.1328
Standard Errors 0.1046 0.2525 0.7736 0.0338 0.0900
82
infrastructure, resource endowments, tariff, non-tariff and diplomatic tie policies of export seeking and partnering countries, Paul et al. (2009) noted three required critical elements in shaping a country to reap success of market diversification that reallocation of resource among the sectors based on their performance, accelerating backbone services to have potential support international trade and pro-active policies to overcome government and market failure. (Manuel et al., 2011) suggest from a large set of data of countries that exchange rate volatility, human capital development and remoteness of the country are positively associated with market diversification. Allen and Ben (2011) suggest that trade facilitation that emphasizes reducing export, market entry and international transport costs can be highly effective promoting export diversification. Therefore, with the development of appropriate instrument Sri Lanka has to find the ways to materialize appropriate strategies to capture a wide range of market share in the global market.
Funding: This study received no specific financial support.
Competing Interests: The author declares that s/he has no conflict of interests.
Contributors/Acknowledgement: All the designing and estimation of current research done by sole author.
Views and opinions expressed in this study are the views and opinions of the authors, Asian Journal of Empirical Research shall not be responsible or answerable for any loss, damage or liability etc. caused in relation to/arising out of the use of the content.
Reference
Ade, O. S. (1993). Market concentration versus market diversification and internationalization: implications for MNE Performance. International Marketing Review, 10(2), 40-59. view at
Google scholar/ view at publisher
Ali, R., Alwang, J., & Siegel, P. B. (1991). Is export diversification the best way to achieve export growth and stability? a look at three African Countries. World Bank Working Papers, No. 729.
view at Google scholar
Allen, D., & Ben, S. (2011). Trade facilitation and export diversification. The World Economy, 34(01), 101-122. view at Google scholar/ view at publisher
Berthelemy, J. C., & Chauvin, S. (2000). Structural changes in Asia and growth prospects after the Crisis. CEPII Working Papers, No.00-09. view at Google scholar
Chan, K. W., Peter, H., & Willem, P. B. (1993). Multinationals’ diversification and the risk-return trade-off. Strategic Management Journal, 14, 275-286. view at Google scholar / view at publisher
Craig, C. J., & Yunus, M. A. (2009). Incentives to export for Australian export market ventures. Journal of Small Business and Enterprise Development, 16(3), 418-31. view at Google scholar
/ view at publisher
Dierk, H., & Felicitas, N. D. (2007). What does export diversification do for growth? An econometric analysis. Applied Economics, 38(15), 1825-1838. view at Google scholar/ view at publisher
Fahim, M. (2010). Export diversification and growth: an empirical investigation. Applied Economics Letters, 7(9), 559-562. view at Google scholar/ view at publisher
Federico, B., & Kichiro, F. (2003). Export diversification in low-income countries: an international challenge after Doha. OECD Developing Centre Working Paper, ISSN: 1815-1949, No.209.
view at Google scholar/ view at publisher
George, I. B. (2001). The relationship between diversification and performance in export intermediary firms. British Journal of Management, 12, 67-84. view at Google scholar/ view at publisher
Gutierrez-Pineres, S. A., & Ferrantino, M. J. (2000). Export dynamic and economic growth in Latin America: a comparative perspective. Asgate Publication, London. view at Google scholar
Jean-Emile, D., & Daniel, D. (1985). Market knowledge, diversification and export expansion. Journal of International Business Studies, 16(3), 77-89. view at Google scholar / view at publisher
83
Johansen, S. (1988). Statistical analysis of cointegration vector. Journal of Economics and Control, 12(2-3), 231-254. view at Google scholar/ view at publisher
Manuel, de, H. C. C. (2008). Export diversification and technological improvement: recent trends in the Portuguese economy. GEE Paper. Departamento de Economia, Universidade do Minho.
view at Google scholar
Manuel, R., Agosin, R. A., & Claudio, B. (2011). Determinants of export diversification around the world: 1962-2000. The World Economy, 35(03), 295-315. view at Google scholar/ view at publisher
Michael, A. H., Robert, E. H., & Hicheon, K. (1997). International diversification: effects on innovation and firm performance in product-diversified firms. Academy of Management Journal, 40(4), 767-798. view at Google scholar/ view at publisher
Michael, G. J., Stephen, T., & David, M. O. (2000). Product and international diversification among Japanese multinational firms. Strategic Management Journal, 21, 51-80. view at Google
scholar/ view at publisher
Olivier, C., Céline, C., & Vanessa, S. (2013). Trade diversification, income, and growth: what do we know?. Journal of Economic Surveys, 27(4), 790-812. view at Google scholar / view at publisher
Patrick, N. O. (2007). Foreign aid, resources and export diversification in Africa: a new test of existing theories. MPRA Paper, No. 2228. view at Google scholar
Paul, B., Richard, N., & Peter, W. (2009). Avenues for export diversification: issues for low-income countries. MPRA Paper, No. 22758. view at Google scholar
Salomon, S. (2010). A primer on export diversification: key concepts, theoretical underpinnings and empirical evidence. Growth and Crisis Unit, World Bank Institute. view at Google scholar
Saman, K. (2013). Export sector in Sri Lanka: issues and challenges. Presented at the18th AGM, National Chamber of Exporters of Sri Lanka, Sri Lanka.
Sheila, A. G. P., & Michael, F. (1997). Export diversification and structural dynamics in the growth process: the case of Chile. Journal of Development Economics, 52(2), 375-391. view at Google
scholar/ view at publisher