Scholarship@Western
Scholarship@Western
Electronic Thesis and Dissertation Repository
11-23-2018 2:00 PM
Prognostic Predictive Model to Estimate the Risk of Multiple
Prognostic Predictive Model to Estimate the Risk of Multiple
Chronic Diseases: Constructing Copulas Using Electronic Medical
Chronic Diseases: Constructing Copulas Using Electronic Medical
Record Data
Record Data
Jason E. Black
The University of Western Ontario
Supervisor Lizotte, Daniel
The University of Western Ontario
Graduate Program in Epidemiology and Biostatistics
A thesis submitted in partial fulfillment of the requirements for the degree in Master of Science © Jason E. Black 2018
Follow this and additional works at: https://ir.lib.uwo.ca/etd
Part of the Epidemiology Commons
Recommended Citation Recommended Citation
Black, Jason E., "Prognostic Predictive Model to Estimate the Risk of Multiple Chronic Diseases:
Constructing Copulas Using Electronic Medical Record Data" (2018). Electronic Thesis and Dissertation Repository. 5926.
https://ir.lib.uwo.ca/etd/5926
This Dissertation/Thesis is brought to you for free and open access by Scholarship@Western. It has been accepted for inclusion in Electronic Thesis and Dissertation Repository by an authorized administrator of
i
Introduction: Multimorbidity, the presence of two or more chronic diseases in an individual, is a pressing medical condition. Novel prevention methods are required to reduce the incidence of multimorbidity. Prognostic predictive models estimate a patient’s risk of developing chronic
disease. This thesis developed a single predictive model for three diseases associated with multimorbidity: diabetes, hypertension, and osteoarthritis.
Methods: Univariate logistic regression models were constructed, followed by an analysis of the dependence that existed using copulas. All analyses were based on data from the Canadian Primary Care Sentinel Surveillance Network.
Results: All univariate models were highly predictive, as demonstrated by their discrimination and calibration. Copula models revealed the dependence between each disease pair.
Discussion: By estimating the risk of multiple chronic diseases, prognostic predictive models may enable the prevention of chronic disease through identification of high-risk individuals or delivery of individualized risk assessments to inform patient and health care provider decision-making.
Keywords
ii
Co
-
Authorship Statement
iii
Acknowledgments
The past two years have been filled with an abundance of growth, both personally and
professionally. It is my pleasure to acknowledge several individuals for the roles that they have played in my development.
To begin, I would like to thank the members of my thesis committee: Dr. Dan Lizotte, Dr. Amanda Terry, and Dr. Sonny Cejic. These individuals have pushed me to explore new avenues of research and apply research to where it has not previously been done before; yet, they have always brought me back to the “so what?”, the clinical interpretation. In doing so, these individuals have provided me with a strong foundation of knowledge and skills that I will draw on for years to come.
I would also like to thank several key mentors who have supported me greatly through my graduate career. These mentors included: Dr. Heather Maddocks, Dr. Moira Stewart, Dr. Stewart Harris, Alexandria Ratzki-Leewing, and Dr. Kelly Anderson. Each of these individuals have provided me the opportunity to further my skills and competencies and explore new and exciting areas of research. Additionally, I would like to thank the larger DELPHI team for supporting me in my research and providing perspectives that were essential to shaping this work into a relevant and timely piece of literature. I must also acknowledge both the Canadian Primary Care Sentinel Surveillance Network (CPCSSN) and Deliver Primary Health Care Information (DELPHI) project for providing the data for this thesis.
To my colleagues and classmates, I am grateful for your fellowship through our time here. In particular, I am grateful to the members of SHET for their support through the various challenges that came my way. Every brainstorming session, Kresge night, and coffee run has been
instrumental in getting me to this point.
iv
Table of Contents
Abstract ... i
Co-Authorship Statement ... ii
Acknowledgments ... iii
Table of Contents ... iv
List of Tables ... vii
List of Figures ... ix
List of Appendices ... x
Chapter 1 ... 1
1 Introduction ... 1
Chapter 2 ... 4
2 Literature Review ... 4
2.1 Chronic Disease ... 4
2.1.1 Definition ... 5
2.1.2 Prevalence ... 5
2.1.3 Risk Factors ... 5
2.1.4 Multimorbidity ... 7
2.1.5 Diabetes Mellitus ... 8
2.1.6 Hypertension ... 10
2.1.7 Osteoarthritis... 11
2.2 Prognostic Predictive Models ... 13
2.2.1 Overview ... 13
2.2.2 Conceptual Model ... 15
2.2.3 Settings of Prognostic Predictive Model Use ... 18
2.2.4 Prognostic Predictive Model Development ... 18
2.2.5 Prognostic Predictive Model for Multiple Diseases ... 20
2.3 Methodologies for Multiple Disease Risk Estimation ... 21
2.3.1 Joint and Marginal Distribution of Binary Random Variables ... 21
v
2.4 Electronic Medical Records ... 25
2.4.1 Overview ... 25
2.4.2 Uptake of EMRs in Canada ... 27
2.4.3 Use of EMRs for Research Purposes ... 27
2.5 Summary ... 29
Chapter 3 ... 30
3 Methods ... 30
3.1 Data Source ... 30
3.2 Measures ... 33
3.2.1 Outcome ... 33
3.2.2 Predictors ... 35
3.3 Participants ... 37
3.4 Sample Size Considerations ... 38
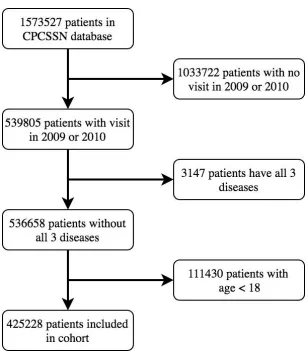
3.5 Cohort Construction... 38
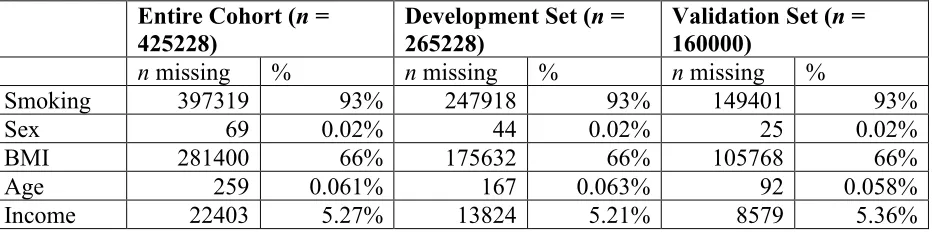
3.6 Missing Data ... 39
3.7 Statistical Analysis ... 40
3.7.1 Univariate Multivariable Logistic Regression ... 40
3.7.2 Analysis of Dependence ... 41
Chapter 4 ... 45
4 Results ... 45
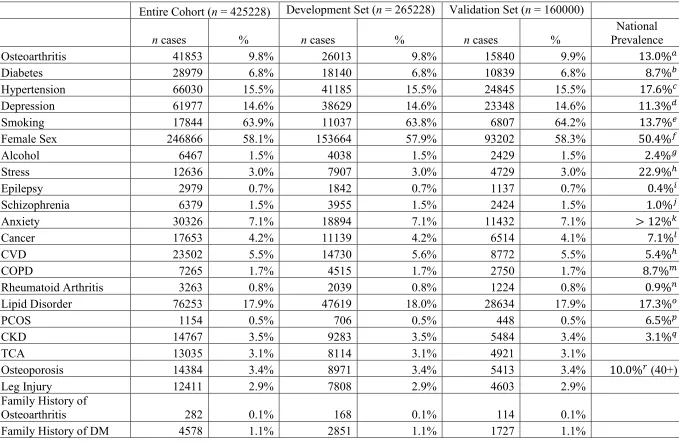
4.1 Descriptive Statistics... 45
4.2 Missing Data and Multiple Imputation ... 51
4.3 Univariate Results ... 52
4.4 Dependence Analysis ... 57
Chapter 5 ... 61
5 Discussion... 61
vi
5.2 Comparisons of Univariate Models with Existing Models ... 62
5.2.1 Diabetes ... 62
5.2.2 Hypertension ... 64
5.2.3 Osteoarthritis... 66
5.3 Comparison of Dependence Analysis with Existing Dependence Analyses ... 68
5.3.1 Diabetes and Hypertension ... 68
5.3.2 Diabetes and Osteoarthritis ... 69
5.3.3 Hypertension and Osteoarthritis ... 70
5.3.4 Multiple Disease Risk Estimation ... 71
5.4 Limitations ... 71
5.5 Implications ... 74
5.6 Future Directions ... 75
5.7 Conclusion ... 76
References ... 77
Appendices ... 103
vii
List of Tables
Table 1: Comparison of Data Sources ... 29
Table 2: CPCSSN Data Tables ... 32
Table 3: Disease Predictors ... 35
Table 4: Shared Risk Factors ... 35
Table 5: Incidence of Diabetes, Hypertension, and Osteoarthritis ... 47
Table 6: Descriptive Statistics ... 48
Table 7: Variables with Missing Data ... 51
Table 8: Risk Factors Available Within CPCSSN Database ... 52
Table 9: Diabetes Univariate Results ... 52
Table 10: Hypertension Univariate Results ... 54
Table 11: Osteoarthritis Univariate Results ... 56
Table 12: ϕ Coefficients ... 58
Table 13: Partial Correlation ... 58
Table 14: θ Estimates ... 59
Table 15: Trivariate Probabilities for Example Patient 1 ... 59
Table 16: Trivariate Probabilities for Example Patient 2 ... 60
Table 17: Comparison of Diabetes Univariate Model with Existing Models ... 63
Table 18: Risk Factors Included in Diabetes Risk Estimation ... 63
viii
Table 20: Risk Factors Included in Hypertension Risk Estimation ... 65
Table 21: Comparison of Osteoarthritis Univariate Model with Existing Models ... 66
ix
List of Figures
Figure 1: Conceptual Model for Risk Assessment ... 15
Figure 2: CPCSSN Structure ... 30
Figure 3: Cohort Construction ... 46
Figure 4: ROC Curve for Diabetes ... 53
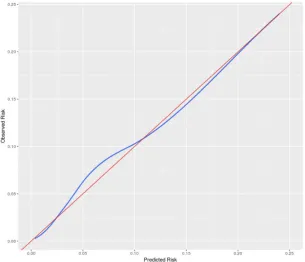
Figure 5: Calibration Plot for Diabetes ... 53
Figure 6: ROC Curve for Hypertension ... 55
Figure 7: Calibration Plot for Hypertension ... 55
Figure 8: ROC Curve for Osteoarthritis... 56
x
List of Appendices
Appendix A: Summary of Validation Results for CPCSSN Diseases (193) ... 103
1
Chapter 1
1
Introduction
Prognostic predictive models (PPM) estimate a patient’s risk for future disease development based on the patient’s current predictors of disease (1,2). Potential predictors, including patient demographics, family history, lifestyle factors, medical conditions, or genetic factors (3), are used to produce risk estimates of disease. These estimates can be used by primary care practitioners (PCP) in their primary prevention activities with patients (4,5). Many chronic diseases have been accurately predicted through risk estimation using prognostic predictive models (6–8), such as cardiovascular disease (7,9). These tools have been shown to improve
patients’ risk perception and knowledge (10), as well as to modify PCP care, including prescribing behaviours (11). The objective of a PPM is to inform patient and PCP decision-making by providing risk estimations and identifying high-risk individuals to target with risk-reducing interventions, thereby risk-reducing the future incidence of disease.
The occurrence of two or more chronic diseases within a single patient, or multimorbidity, is a growing concern in the health care community. Prevalence estimates vary due to inconsistent definitions of multimorbidity; levels in Canadian older adults range from 55 to 98% (12). Methods of preventing the development of multimorbidity are severely lacking (13); novel methods of prevention must be developed to reduce future incidence. One potential method that may aid in preventing future cases of multimorbidity is the use of prognostic predictive models aimed at informing patients and their care providers about multimorbidity risk.
A prognostic predictive model capable of estimating the risk of multiple diseases simultaneously would deliver a comprehensive risk assessment that could be used to identify patients at highest risk of disease in general. This model would incorporate aspects beyond risk factors for
2
diseases has been restricted by the lack of datasets large enough and rich enough to support the production of such estimates. Recently established large-scale electronic medical record (EMR) databases (14–17) represent a potential source of data of the size necessary to support efforts in multimorbidity risk modelling.
Primary prevention is one of the fundamental goals of primary care (18), making primary care an ideal setting to deploy such methods to reduce multimorbidity risk. Modelling risk of multiple diseases could impact clinical practice twofold. First, it would identify patients at highest risk, allowing the PCP to target these patients with risk-reducing interventions (19). Second,
practitioners and patients are often tasked with determining which risk factors are of the greatest importance, as these should be targeted first. Risk modelling of multiple diseases would identify risk factors that significantly contribute to the risk of multiple diseases to maximize the impact of risk factor modification and reduce intervention-burden on patients. It is hoped that these
targeted interventions will help prevent future incidence of multimorbidity.
Traditionally, risk is modelled for individual diseases under the assumption that disease develops independent of other diseases; however, we know from the study of multimorbidity that this assumption is often false. Occurrence of diseases in the same individual is not an independent event; disease processes influence the development or progression of other diseases leading to chronic diseases often occurring together (20–22). For this reason, the estimation of disease risk under the assumption that disease occurrences are independent events does not accurately reflect
a patient’s true risk of disease. Therefore, an understanding of the dependence that exists
between each disease is required prior to the construction of a prognostic predictive model for multiple chronic diseases. Given this, models can be built to describe the dependence between multiple diseases and estimate their risk of occurring in the same individual. The two main goals of this work are 1) to build a prognostic predictive model that both accounts for existing chronic disease and predicts the occurrence of multiple diseases simultaneously and 2) to examine the dependence that exists between three chronic diseases – diabetes, hypertension, and osteoarthritis
3
risk factors. The resulting model achieves both goals, since it can be used to make risk predictions and it can be used to assess dependence in disease development.
This thesis first explores chronic disease, namely multimorbidity, and the possibility of
4
Chapter 2
2
Literature Review
The following literature review first describes chronic disease, particularly multimorbidity, and its impacts. It continues by presenting prognostic predictive models as a potential method of supporting the primary prevention of chronic disease and multimorbidity. It then finishes by describing two requirements of multiple disease risk estimation: advanced statistical
methodologies and electronic medical record data.
2.1
Chronic Disease
As the leading cause of death worldwide, chronic disease represents one of the world’s largest
challenges (23). Disease is categorized into two distinct types: chronic and acute. Acute diseases are characterized by their short duration. Patients typically recover from their disease within a brief period of time (24); the length of this period is dependent upon the disease context. Acute diseases are most often communicable, or transmitted from person to person, and thus commonly
5
2.1.1
Definition
There is no single, agreed upon definition of chronic disease (26). Most definitions depend on either disease duration or disease transmission; however, these definitions will produce
inconsistent classifications of disease. As described above, HIV is a communicable disease for which no cure exists that results in lifelong health effects. Many organizations have constructed definitions of chronic disease and lists of diseases they consider chronic diseases. These
definitions are often non-specific; for example, the U.S. National Center for Health Statistics
defines chronic disease as “a disease lasting 3 months or longer” (27). Additionally, these definitions often disagree. The Public Health Agency of Canada considers five main groups of chronic diseases: cardiovascular diseases, cancers, chronic respiratory diseases, diabetes, and mood and anxiety disorders (28). By the U.S. National Center for Health Statistics definition, diseases such as epilepsy or chronic kidney disease would be considered chronic diseases, whereas by the Public Health Agency of Canada definition they would not.
Given this lack of a standard definition of chronic disease, it is not possible to use it as an
outcome for prediction without significant additional effort. However, this thesis was not subject to this issue as it simply selected three diseases for prediction that are managed in primary care and possess lifelong clinical implications. The methodology in the thesis is general and can be applied to any outcome of interest.
2.1.2
Prevalence
In Canada, greater than one fifth of Canadians age twenty or older live with at least one major chronic disease (CVD, cancer, chronic respiratory disease, and diabetes) (29). In Canadians aged 65 or older, this proportion of individuals living with at least one major chronic disease grows to over 40% (29).
2.1.3
Risk Factors
6
epidemiologic methods. For example, smoking has been shown to impart an increased risk for lung cancer (31), making it a risk factor. Identification of risk factors is important for two reasons; it allows for 1) risk assessments in which an individual’s risk factors are assessed to
enable risk estimation and 2) subsequent intervention upon modifiable risk factors. Most diseases are multifactorial (i.e., their development is influenced by multiple risk factors). Indeed, it is common for individuals to have more than one risk factor. When an individual possesses
multiple risk factors, these risk factors can have an additive or multiplicative impact on risk; this
effect is known as interaction. When risk factors interact in an additive manner, the individual’s
total risk is greater or less than the sum of the component risks (32). When risk factors interact in
a multiplicative manner, the individual’s total risk is greater or less than the product of the component risks (32). Risk factors are often targeted with interventions aimed at reducing a
person’s risk of developing chronic disease.
Risk factors can be modifiable or non-modifiable. Modifiable risk factors can be changed through some intervention. Interventions often include behavioural or lifestyle changes, medical procedures, or pharmaceutical treatments. For example, smoking is a risk factor for
cardiovascular disease, which can be modified by quitting smoking; studies have demonstrated that quitting smoking reduces the risk of developing cardiovascular disease (33,34). Non-modifiable risk factors cannot be changed. For example, family history is non-Non-modifiable risk factor for cardiovascular disease. Intervention upon risk factors is the focus of primary
prevention efforts, which aim to lower an individual’s risk of developing disease.
Many chronic diseases share common risk factors. For example, obesity is a known risk factor for diabetes (35,36), depression (37), and osteoarthritis (38–40). Where shared risk factors exist
(and are modifiable), targeting these first will have the largest impact on an individual’s risk of
7
2.1.4
Multimorbidity
Multimorbidity is an extremely common medical condition, especially among older adults (12). Although definitions vary, multimorbidity is commonly considered the presence of two or more chronic conditions within an individual (41). For example, a patient diagnosed with both asthma and diabetes has multimorbidity. Multimorbidity can be contrasted with comorbidity. Both of these terms refer to multiple chronic diseases within the same individual; however, when
examining comorbidities, there is always an index disease that is the primary focus, for which its care is modified when additional morbidities are considered. Multimorbidity, on the other hand, does not prioritize one disease over another.
Despite professional agreement that multimorbidity is a pressing health issue (12), there is no standard, consistently used definition of multimorbidity (42–44). The European General Practice
Research Network defines multimorbidity as “any combination of chronic disease with at least
one other disease (acute or chronic) or bio-psychosocial factor (associated or not) or somatic risk
factor” (45), without a list of diseases or conditions that should be considered. In contrast, the Public Health Agency of Canada considers multimorbidity to be two or more of the following diseases within the same individual: heart disease, stroke, cancer, asthma, COPD, DM, arthritis,
Alzheimer’s or other dementia, mood disorder (depression), and anxiety (29). A recent
systematic review by Fortin et al. examined the impact of including various numbers of diseases in a definition for multimorbidity on the prevalence of multimorbidity (42). Findings of this systematic review demonstrated that inclusion of at least 12 chronic conditions in the definition of multimorbidity resulted in stable prevalence estimates; including more conditions in the definition did not significantly alter the prevalence estimates. Fortin et al. suggest including the 12 most prevalent chronic conditions in a definition of multimorbidity.
Prevalence estimates in the literature are inconsistent due to varying definitions of
multimorbidity; however, estimates of multimorbidity prevalence in older adults range from 55 to 98% (12). According to the Public Health Agency of Canada definition of multimorbidity, the prevalence of multimorbidity in 2014 was 14.8% in Canadians aged 20 and older.
8
activities of daily living, and decrease self-rated health (46,47). An inverse relationship has been found between multimorbidity and health-related quality of life; as the number of multimorbid diseases increases, health-related quality of life has been found to decrease (48). Issues such as polypharmacy, fragmentation of care, and conflicting or competing health care recommendations may be faced by patients with multimorbidity (12), making treatment of these individuals
complicated. The economic burden of multimorbidity is massive; in 2009, nearly 80% of health care costs in Canada were due to individuals with multimorbidity (49). Wikström et al (50) examined risk factors specifically for multimorbidity. They found that smoking, physical activity, and BMI were significant contributors to risk of multimorbidity development. Additionally, systolic blood pressure and low education contributed to risk of multimorbidity among men. Dhalwani et al (51) examined the impact of physical activity on development of multimorbidity among an older English population; they found a dose-response relationship between levels of physical activity and multimorbidity: for those at higher levels of physical activity, fewer developed multimorbidity. Dankel et al. (19) examined the impact of strengthening activities on multimorbidity risk. Those who participated in the muscle-strengthening activities had 26% lower odds of developing multimorbidity. These studies demonstrate the importance of physical activity for the prevention of multimorbidity. Recently, there has been a focus on developing strategies to prevent multimorbidity as health policy makers and health care providers recognize the importance of multimorbidity (52). In 2015, the Public Health Agency of Canada published a report that stressed the importance of addressing chronic disease from a comprehensive, holistic approach, including consideration of
multimorbidity, rather than a single-disease-centred approach (53).
Three chronic diseases commonly associated with multimorbidity are diabetes mellitus, hypertension, and osteoarthritis.
2.1.5
Diabetes Mellitus
Diabetes mellitus (DM) is a group of metabolic disorders characterized by elevated blood glucose levels over prolonged periods (54). DM comprises two main conditions: type 1 DM, in which the pancreas is not able to produce enough insulin and type 2 DM, in which the pancreas
9
its onset typically occurs before adulthood, comprises approximately 10% of cases of DM (56). The most common cause of type 1 DM is an autoimmune attack on the insulin-producing beta cells of the pancreatic islets, resulting in insulin deficiency (57). Type 2 DM is the more common of the two, comprising approximately 90% of cases of DM (56). Its onset is typically in
adulthood; however, a growing proportion of younger individuals are developing type 2 DM (58). This is likely due to the increase in risk factors for DM, such as obesity, lack of physical activity, and poor diet, in youth.
Based on national survey data, the population prevalence of DM (both type 1 and type 2) is roughly 9.8% (29). Based on a Canadian study using electronic medical record data conducted by Greiver et al., the prevalence within primary care patients was 8.2% (59). When corrected using a corrected yearly contact group denominator, the population prevalence of DM was 7.6% (59).
Patients with type 1 DM must manage their glucose levels using insulin injections; this requires monitoring of blood glucose levels using repeated blood tests and administration of insulin injections (60). Patients with type 2 DM do not always require insulin. Lifestyle changes, such as proper diet and exercise, and medications (e.g., metformin), are used to manage patients with type 2 DM (60). Insulin injections may be added to treatment when the disease has progressed; however, most individuals do not initially require insulin (55).
Complications of DM are the same for both type 1 and type 2 DM and are minimized through proper control of glucose levels (61,62). DM leads to both microangiopathy and
macroangiopathy, often resulting in severe complications, both acute and chronic (54). Acute complications, such as hypoglycemia, hyperglycemia, and, less commonly, diabetic coma, can occur within patients with DM. Chronic complications include diabetic nephropathy (i.e., damage to the kidney that can lead to chronic kidney failure); diabetic retinopathy (i.e., growth of poor-quality blood vessels and swelling that can result in vision loss or blindness); diabetic cardiomyopathy (i.e., damage to the heart muscle that can lead to heart failure); cardiovascular disease; and foot ulcers.
10
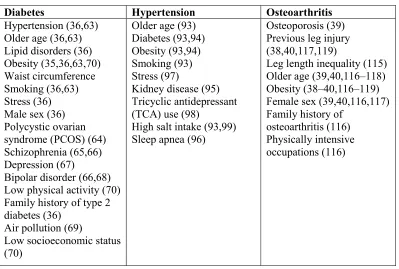
older age (36,63); male sex (36); polycystic ovarian syndrome (PCOS) (64); psychiatric
disorders such as schizophrenia (65,66), depression (67), bipolar disorder (66,68); family history of type 2 diabetes (36); air pollution (69); and low socioeconomic status (70). Modifiable risk factors for type 2 diabetes include obesity (35,36,63,70), waist circumference, lipid disorders (36), hypertension (36,63), smoking (36,63), stress (36), and low physical activity (70). The effectiveness of diet-and-exercise programs in reducing diabetes incidence through weight reduction and regular physical activity has been demonstrated in many randomized controlled trials (RCTs) (71–73). Bariatric surgery to facilitate weight loss has shown promise in preventing type 2 DM development (74). Several pharmacotherapies have been investigated for type 2 DM prevention. Metformin has been shown to significantly reduce risk of developing diabetes (71), even after medication discontinuation (75,76). Other medications have been investigated, including thiazolidinediones such as troglitazone (77), rosiglitazone (78), ramipril (79), and pioglitazone (80); alpha-glucosidase inhibitors (81); orlistat (82); and incretin-based therapies such as liraglutide (83); however, results remain indefinitive, limiting their use. Clinical practice guidelines published by Diabetes Canada (formerly the Canadian Diabetes Association) (84) recommend reduction of type 2 DM risk through a structured lifestyle modification program, including weight loss, physical activity and pharmacological therapy with metformin or acarbose, in patients with impaired glucose tolerance.
2.1.6
Hypertension
Hypertension is a condition in which blood pressure in the arteries is consistently elevated (85). Hypertension due to some identifiable cause, such as pregnancy, polycystic kidney disease, or
medication, is referred to as “secondary hypertension”; this form of hypertension comprises only 5-10% of cases (86). Hypertension due to unknown causes is referred to as primary (or essential)
11
Based on the Canadian Health Measures Survey (CHMS), the national prevalence of
hypertension in Canada was 22.6% in the years 2012-2013 (91). Based on a Canadian study using electronic medical record data conducted by Godwin et al., 22.8% of a primary care population had a diagnosis of hypertension as of 2012 (92). Of this primary care population, most patients (80%) diagnosed with hypertension were able to reach target blood pressure levels.
As hypertension does not result in symptoms (85), the burden of the disease itself on patients is low. However, hypertension has a large impact on individuals when considering its long-term complications; CVD, stroke, vision loss, and chronic kidney disease all have severe impacts on
an individual’s well-being.
Non-modifiable risk factors for hypertension include older age (93), diabetes (93,94), kidney disease (95), and sleep apnea (96). Modifiable risk factors include obesity (93,94), smoking (93), stress (97), tricyclic antidepressant use (98), and high salt intake (93,99).
Primary prevention of hypertension focuses on modification of its risk factors. For example, the DASH diet (Dietary approaches to stop hypertension) (100) aims to reduce salt consumption through modification of diet. Physical activity is commonly recommended to reduce risk of hypertension; many epidemiologic studies have demonstrated a consistent dose-response relationship between physical activity and development of hypertension, in which higher levels of physical activity were associated with lower rates of hypertension (101). Additionally, weight loss, even modest, has been shown to decrease risk of hypertension (102). Indeed, the Canadian Hypertension Education Program recommends the following (103) for the prevention of
hypertension: regular physical activity; maintenance of a healthy body weight; alcohol
consumption within the Canadian low-risk drinking guidelines (104); maintenance of the DASH diet (100); reduction of sodium consumption; and stress management.
2.1.7
Osteoarthritis
12
hands, neck, lower back, hips, and knees. Typical treatment of osteoarthritis involves lifestyle modification and medications (106–108). Weight loss has been shown to reduce pain and stiffness and improve function of the joint (109). Medications, such as non-steroidal anti-inflammatory drugs, are used for treatment of pain. In cases where the impact of osteoarthritis symptoms are severe and conservative forms of treatment are ineffective, joint replacement surgery may be recommended, in which the affected joint is replaced with an artificial joint. Replacement of hip and knee joints have been shown to be clinically (110,111) and cost effective (112,113).
The population-based prevalence of osteoarthritis was estimated to be 13.0% in Canadians aged 20 and older (28). Based on a study in Canada using electronic medical record data conducted by Birtwhistle et al., the prevalence of osteoarthritis within the primary care population was 14.2% in 2012 (114).
The impact of osteoarthritis on individuals living with the disease is dependent upon the joint(s) affected and the progression of disease. Osteoarthritis of the knee and hip can limit activities such as running or walking, whereas osteoarthritis of the hand joints can impede activities such as writing or typing. Degree of disease progression and an individual’s ability to manage symptoms affects how activities are affected.
Efforts surrounding osteoarthritis management typically focus on treatment of symptoms, rather than disease prevention. This is likely due to its slow, progressive nature with no clear point of disease onset. Non-modifiable risk factors for osteoarthritis include leg length inequality (115), older age (39,40,116–118), female sex (39,40,116,117), family history of osteoarthritis (116), and osteoporosis (39). The modifiable risk factors for osteoarthritis are obesity (38–40,116–119), previous joint injury (38,40,117,119), and physically intensive occupations (116). Suggested osteoarthritis prevention efforts concentrate on obesity. For example, a diet-and-exercise
13
2.2
Prognostic Predictive Models
2.2.1
Overview
Prognostic predictive models can be used to estimate the risk of developing a chronic disease. In particular, the objective of prognostic predictive models (PPMs) is to inform patients and care providers about patient risk, and thereby motivate the use of interventions that prevent future disease development. There are several levels of disease prevention, each used at different stages of disease progression. Primary prevention describes the efforts taken prior to disease
development to reduce risk of future disease development (122,123). Common primary
prevention interventions include eating a healthy diet, quitting smoking, or exercising regularly. Secondary prevention describes diagnostic efforts after disease onset but prior to clinical
manifestations (symptoms) of disease to detect the initial stages of disease, allowing for early treatment; for example, breast cancer screening is done to detect the disease earlier, when
treatments are more effective (122,124). Tertiary prevention describes the actions taken to reduce the impact and ease the burden of an on-going disease (122,125). One example of a tertiary prevention intervention is physiotherapy following a joint injury to improve joint function. PPMs are one tool used to support the primary prevention of disease.
Traditional primary prevention interventions include risk management. Risk management refers to the forecasting and evaluation of patient risk and practices aimed at reducing this risk (126–
128). Individual risk factor management is a specific type of risk management. According to this strategy, risk factors for chronic disease are individually assessed through risk assessments and subsequently intervened upon; however, recent research has demonstrated that risk assessments
that examine a patient’s global risk of disease by considering multiple risk factors
simultaneously have been more effective in risk reduction (129). A patient’s global risk takes
into account the impact of multiple risk factors to estimate the risk that the patient will develop disease within a given time period (130). One method of estimating a patient’s global risk of
disease is through the use of PPMs.
14
multiple risk factors (131). These models present estimated risk in the form of a risk score, usually a numeric value where a greater value denotes greater risk (132). Alternatively,
individuals are assigned to categories corresponding to varying degrees of risk. Common PPMs include the Framingham Risk Score for cardiovascular disease (9) and EuroScore to estimate risk of death after a heart operation (133).
Multivariable statistical methods are used in PPMs. A PPM estimates the risk of some outcome (future development of disease) based on a set of covariates (characteristics shown to indicate risk, or risk indicators). This is distinct from past risk estimation methods where individual risk factors were assessed independently then intervened upon. Compared to the use of a single predictor, the use of multiple predictors allows for more accurate estimation of a patient’s risk
(5), as multiple risk factors commonly coexist within an individual (130). Interaction between risk factors occurs when the joint effect on risk is greater than what would be expected by adding or multiplying the effects of each risk factor; these interactions can be modelled by PPMs by including an interaction term in the model (134). Characteristics of the patient, provider, or practice can be included as covariates in the model. Potential patient level covariates include patient demographics, family history, lifestyle factors, medical conditions, and genetic factors (3). Potential provider level covariates include specialization (if any), years in practice, and additional certifications. Potential practice level covariates include rurality, number of
practitioners, and geographic location. Inclusion of characteristics from multiple levels requires the use of advanced methods such as multilevel modelling (135).
15
2.2.2
Conceptual Model
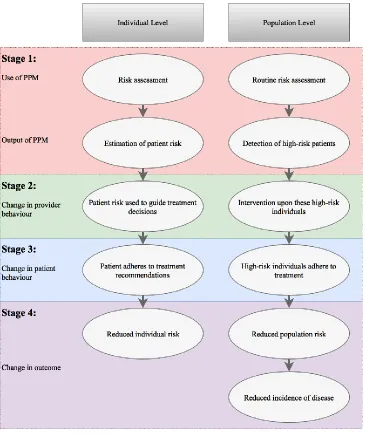
Two theories exist that drive the use of PPMs, one at the individual level and another at the population level. At the individual level, the theory driving the use of PPMs posits that knowledge of disease course enables patients and practitioners to make informed decisions to avoid or deter the development of disease (5). At the population level, the use of PPMs is driven by the need for identification of patients at high-risk of disease, enabling targeted interventions aimed at reducing risk within these patients (5). The following conceptual model describes the process of risk estimation via PPMs, from both the individual and population perspectives.
16
The four stages of risk assessment outlined in the conceptual model above will be discussed below.
2.2.2.1
Stage 1: Use of Prognostic Predictive Models
Risk assessments, which commonly include a PPM, can occur in two ways. In the first, either the patient or PCP is concerned about risk of future morbidity and the PCP actively performs a risk assessment. In this case, there must be some initiation or interest in risk assessment by either the patient or PCP. Alternatively, risk assessments can run passively in the background, assessing all
patients’ risks, and send an alert when a patient is classified as high-risk. In this case, the risk estimation model is run regardless of patient or PCP concern about future morbidity. Integration of risk assessments into electronic medical record (EMR) systems facilitates both these
strategies, as tools within an EMR are easily accessible to the PCP and are able to run in the background of the EMR. Building these tools into EMRs results in simple incorporation into clinical workflow to offer real-time recommendations.
2.2.2.2
Stages 2 & 3: Change in Provider and Patient Behaviour
PPMs can be used in primary care to inform PCP decision making regarding risk reduction. Most often PPMs are used as a part of a risk assessment. Studies examining the use and impact of PPMs in primary care in Canada are rare; most PPM studies focus on the development or validation of models, but do not evaluate how current models are used (137). However, many Canadian guidelines advocate for the use of risk assessments. The Canadian Cardiovascular Society recommends cardiovascular risk assessment using every 5 years for men and women between ages 40 and 75 using PPMs such as the modified Framingham Risk Score or
17
Many factors limit the use of PPMs in clinical practice. A qualitative study examined barriers cited by PCPs limiting their use of PPMs in clinical practice including lack of lifestyle
recommendations, legal and regulatory constraints, and lack of accuracy of risk scores (140). PCPs felt that predictive models focused more on non-modifiable risk factors, such as age, thus limiting their ability to give recommendations on more relevant, modifiable risk factors such as lifestyle. PCPs also expressed concerns over the current regulations that did not place a focus on disease prevention; no remuneration exists for time spent on risk assessment and prevention. PCPs feared that the estimated risk scores were not an accurate representation of individual
patient’s risks, and thus were less likely to use the PPM.
2.2.2.3
Stage 4: Change in Patient Outcomes
Similar to studies looking at their use, few studies in Canada have examined the impact of PPMs on clinical outcomes, such as impact on risk, disease incidence, or physician behaviours;
however, some studies exist examining their use. The National Health Service (NHS) Health Check is a health check-up for adults that includes a CVD risk assessment (141). All adults in England between the ages 40 and 74 without a pre-existing condition are invited by their PCP or local authority for a free NHS Health Check every 5 years in an effort to reduce risk of chronic disease. The introduction of the NHS Health Check was shown to be associated with significant reductions in CVD risk, as well as improvements in statin prescriptions (142). The
Multidisciplinary Risk Assessment and Management Program for Patients with Diabetes Mellitus (RAMP-DM) in Hong Kong had similarly promising results, finding that a risk assessment and management program (which included a risk assessment component) was associated with fewer cardiovascular complications and lower all-cause mortality after 3 years (143). In contrast, a systematic review conducted by Brindle et al. described several studies that observed no impact from PPM risk assessment on the observed outcomes, which included predicted risk of CVD, fatal or non-fatal CVD events, risk factor levels, prescription of risk-reducing drugs, and changes in health-related behaviour (144); however, this review frequently
18
2.2.3
Settings of Prognostic Predictive Model Use
Primary care is the first point of patient contact where, most often, patients are seen prior to disease development; once patients reach secondary or tertiary levels of care they have already developed disease, thus prognostic risk estimation is of little value in these clinical settings. For this reason, primary care is an ideal setting for targeted primary prevention efforts, including the use of PPMs. PPMs can be used to inform the PCP decision-making process surrounding risk management, such as whether or not to recommend risk lowering interventions. Many guidelines recommend the use PPMs to detect high-risk individuals for primary prevention efforts
(145,146). One common PPM used in primary care is the Framingham model for cardiovascular disease (CVD) (147), which estimates a patient’s risk of developing CVD in the next 10 years
based on risk factors including age, sex, cholesterol levels, and smoking status. PCP decisions such as whether or not to prescribe statins or to recommend lifestyle changes are informed by this model.
Additionally, PPMs are commonly used as online tools to deliver risk estimates to the general population over the internet (148,149). This method allows a larger population, beyond primary care patients, to access personalized risk estimates in a convenient manner and receive
recommendations on ways to reduce risk. Online risk assessments are based on established PPMs that have been empirically developed and validated; however, these models are sometimes modified to substitute covariates that are not commonly known by individuals. For example, personal blood cholesterol within the Framingham cardiovascular risk assessment may be replaced with an average value as most individuals will not likely know their blood cholesterol levels off-hand. Given the current status of PPM use in primary care, online risk assessments are able to reach a much greater proportion of the population. The deployment of online PPMs aims to reduce the overall incidence of disease within the community by informing individuals of their personal risk and subsequently recommending risk reducing interventions.
2.2.4
Prognostic Predictive Model Development
The development of a PPM is a complex process involving risk factor identification, data
19
Prognosis or Diagnosis (TRIPOD) Statement (150). Ideally, there are three stages in prognostic research: model development, validation, and clinical impact evaluation (5).
Model development requires knowledge of the relevant risk factors for the disease of interest; a review of the relevant literature will reveal risk factors for the disease. Also required for model development is a dataset from which to build the model. When developing a PPM, it is optimal to use a prospective cohort study conducted specifically to collect data to inform the PPM development (151). However, due to the high costs associated with primary data collection, development of PPMs may make use of data previously collected (retrospective data). Results from retrospective data are more prone to bias as predictor and outcome information is less systematically recorded (1). Common sources of retrospective data include previous
observational studies, randomized controlled trials, and health administrative data (6,152,153).
20
those most similar to them. While these models are sometimes more easily interpreted, they are not as frequently used as regression methods.
Following the development of the model, it must be validated to assess its accuracy. Model validation consists of internal and external validation (160). Internal validation is performed on data from the same source used to construct the model, either using a held-out portion of the data or methods such as cross validation (161) or bootstrapping (162). External validation applies the model to a different population that is similar to determine its accuracy (163). At a minimum, validation looks at discrimination and calibration. Discrimination is the ability to correctly assign higher risk to a patient who ultimately experiences the outcome compared to the patient who does not (4). Discrimination is commonly assessed via the c-statistic or an ROC curve (164). Calibration is a measure of how well a model fits the data (4); this describes how well the risk estimates the true proportion of patients that will develop disease. For patients assigned a given risk (probability), approximately the same proportion of patients should actually go on to develop disease in a model with high calibration. This can be assessed using the
Hosmer-Lemeshow test (155) or a calibration plot; however, the Hosmer-Hosmer-Lemeshow test has been shown to be over-sensitive when dealing with large datasets (3).
The final step in the development of a PPM is to assess its clinical impact (137). Rather than simply assessing performance of the model (i.e. how well the model predicts the outcome), this stage assesses the model’s impact on physician practices, patient care, and patient outcomes. Examples of impacts include modification of physician behaviours, such as prescribing patterns; modification of patient risk; and change in disease incidence. Most PPMs are internally validated at a minimum; however, few are validated on an external dataset, and even fewer have had their clinical impact assessed (165).
2.2.5
Prognostic Predictive Model for Multiple Diseases
Traditional PPMs estimate risk for individual diseases; however, many chronic diseases have been found to cluster in the same individuals, whether they occurred at the same time or
21
the development of PPMs for multiple diseases, advanced statistical methodologies and data that are numerous and highly descriptive, such as electronic medical record data, are required.
2.3
Methodologies for Multiple Disease Risk Estimation
To understand the methodologies required for the estimation of multiple disease risk, an understanding of the concepts related to joint distributions and dependence are first required. Subsequently, an overview of one method for the estimation of multiple disease risk is presented.
2.3.1
Joint and Marginal Distribution of Binary Random Variables
Consider two random variables 𝑋𝑑 and 𝑋ℎ, each of which can take the value 0 or 1. Let 𝑋𝑑 = 1
represent the event that an individual develops diabetes within a 5-year period and 𝑋𝑑 = 0 represent no development of diabetes within that interval. Let 𝑋ℎ be the analogous random variable, but for hypertension.
After waiting for the 5-year period, the values (𝑥𝑑, 𝑥ℎ) are observed, which are the realizations
of the two random variables. There are four possibilities: (0,0) if the patient develops neither disease; (0,1) if the patient develops hypertension but not diabetes; (1,0) if the patient develops diabetes but not hypertension; and (1,1) if the patient develops both diseases. Note that these four possibilities are mutually exclusive and exhaustive – the patient must fall into exactly one of these categories.
22
Suppose the development of diabetes and the development of hypertension were truly
independent of each other; that is, the occurrence of diabetes was not related to the occurrence of hypertension. In this case, the joint distribution of diabetes and hypertension would be no
different from what would be expected by multiplying the marginal probabilities of diabetes and hypertension. This is the null hypothesis commonly used when analyzing contingency tables with the 𝜒2 test or Fisher’s exact test.
The 𝜒2 test evaluates the null hypothesis that each disease is independent of the other by comparing the expected and observed disease frequencies (166). When sample sizes are small, Fisher's exact test should be used (166).
The same methods can be applied to the analysis of three diseases. In this case, the frequencies of each combination of the three diseases are considered. Again, the 𝜒2 test and Fisher's exact test can be used to evaluate the null hypothesis that each disease is independent of the others.
Dependence among the variables describing disease development may be observed in a
population because they have common risk factors. For example, higher BMI may be associated with development of diabetes and development of hypertension. If a contingency table is
analyzed using a sufficiently large population with a range of BMIs, dependence will be detected between 𝑋𝑑 and 𝑋ℎ. However, it may be that for any given value of BMI (or perhaps a small range) the development of the two diseases happens independently. Assessment of dependence after stratifying on a risk factor can be achieved by the Cochrane-Mantel-Haenszel test. The Cochrane-Mantel-Haenszel test accounts for confounding variables through stratification into discrete categories; however, this method does not directly make use of continuous variables.
Instead, a two-stage approach to model the joint distribution of disease development can be used. This approach first uses univariate multivariable logistic regression to model the marginal
23
A copula is a multivariate probability distribution used to describe the non-linear dependence between multiple outcomes where each univariate marginal distribution is uniquely defined (167,168). Copulas are defined by Sklar’s theorem, which states that every multivariate
cumulative distribution function of the variables considered can be expressed in terms of their univariate marginal distributions and a copula (169). The copula (meaning link in Latin) links the univariate marginal distributions together, forming the multivariate joint distribution.
2.3.2
Univariate Multivariable Logistic Regression
The first step in constructing a copula is the estimation of univariate multivariable logistic regression models. Univariate multivariable logistic regression seeks to understand the
relationship between multiple covariates and a single binary outcome (univariate: one outcome;
multivariable: multiple covariates) (155). Univariate logistic regression is based on the logistic function, which is used for modelling the probability distribution of binary data as its output only
takes on values between zero and one due to its S-shape. The logistic function (t) is defined as follows:
𝜎(𝑡) = 1
1 + 𝑒−𝑡
The logistic function applied to a linear function of several explanatory covariates gives a logistic regression function.
𝐹 (𝑥𝑖) =
1
1+ 𝑒−(𝛽0+𝛽𝑖𝑥𝑖) = 𝜎(𝛽0+ 𝛽𝑖𝑥𝑖)
Where 𝛽0 denotes some constant, 𝛽𝑖 denotes some constant(s) by which the explanatory
variable(s) will be multiplied, and 𝑥𝑖 denotes the explanatory variable(s). Given knowledge of all
explanatory covariates and estimates 𝛽̂𝑖 of the coefficients, the probability of experiencing the outcome is estimated by
𝐹̂(𝑥𝑖) =
1
1+ 𝑒−(𝛽̂ 0+𝛽̂𝑖𝑥𝑖) = 𝜎(𝛽̂0+ 𝛽̂𝑖𝑥𝑖).
24
Odds = 𝑒𝛽̂0+𝛽̂𝑖𝑥𝑖
The logistic regression coefficients were estimated using maximum likelihood estimation.
2.3.3
Copulas
Once univariate multivariable logistic regression models have been constructed, the copula is then constructed, which ties together the univariate models. There exist many copula functions, each with its own unique properties that allow it to model different dependence structures. For example, the Frank copula (170) exhibits weak dependence in both tails. One of the most common classes of copula functions, Archimedean copulas, is described below.
2.3.3.1
Archimedean copulas
Archimedean copulas encompass a variety of copula functions that can all be characterized by an explicit formula. Archimedean copulas are commonly the preferred method of dependence modelling due to their ability to model dependence in arbitrarily high dimensions with a single parameter that governs the strength of the dependence (167,168). Archimedean copulas follow the structure:
𝐶(𝑢1, … , 𝑢𝑑; 𝜃) = 𝜓[−1](𝜓(𝑢1; 𝜃) + ⋯ + 𝜓(𝑢𝑑; 𝜃); 𝜃)
where θ is a parameter within some parameter space Θ, ψis the generator function (a function
unique to the copula used), and 𝜓[−1] is its pseudo-inverse given as:
𝜓[−1](𝑡; 𝜃) = {𝜓−1(𝑡; 𝜃) if 0 ≤ 𝑡 ≤ 𝜓(0; 𝜃)
0 if 𝜓(0; 𝜃) ≤ 𝑡 ≤ ∞.
As seen, the generator function determines the copula function; θ must be estimated based on the dependence that exists between variables. Larger values of θ correspond to larger amounts of dependence between diseases.
For example, the generator function for the Gumbel copula is (171):
(− log(𝑡))𝜃
25
𝐶𝜃(𝑢, 𝑣) = exp [−((− log(𝑢))𝜃 + (− log(𝑣))𝜃)1𝜃]
where θ [1, )
The Gumbel copula (171) is an asymmetric copula that exhibits greater dependence in the positive tail than in the negative tail. Other examples include the Frank copula (170), which is a symmetric copula that is used to model weak dependence and the Clayton copula (172), which is an asymmetric copula function that exhibits greater dependence in the negative tail than in the positive. Many other copula functions exist, each with its own unique properties.
Copulas have been used commonly in finance, where financial distributions often are non-normal. For example, copulas have been used extensively in the area of financial risk
management (54). During a recession, investors who hold positions in riskier assets, such as real estate, may move their investments into safer alternatives, such as cash or bonds. This trend results in an asymmetric distribution, where correlations across equities are greater in the downward direction compared to the upward direction. Copulas aid by modelling the marginal distributions separately from the dependence structure. In this example, marginal models can describe the behaviour of individual investors. However, the actions of one investor are not independent of those of other investors; thus, copulas allow the modelling of the behaviour of investors while considering the actions of other investors. Copulas have also been used in the areas of engineering (55), neuroscience (56,57), and climate and weather research (58,59).
2.4
Electronic Medical Records
As mentioned, one potential source of data for the development of a PPM for multiple diseases is EMR data. Explained in greater detail below, these data sources contain the medical records, including diagnoses, prescriptions, treatments and laboratory results, of thousands of patients that may enable the estimation of the risk of multiple diseases.
2.4.1
Overview
26
has been a shift from using paper records for this purpose to using EMRs (173). The goal of an EMR is to support the delivery of quality care by providing accessible and structured storage of information. These digital records contain individual patient information describing
demographics, medical history, medications, allergies, laboratory test results, radiology images, vital signs, patient characteristics such as height and weight, risk factor information, and billing information (174).
Data are stored within an EMR in a variety of ways. Data can be stored in a highly structured manner, such as pick-lists or drop-down menus, or highly unstructured manner, such as free-text. For example, disease information such as a diagnosis of diabetes may be included in the EMR as an entry in the billing table or problem list with the corresponding International Classification of Disease (ICD) code. Alternatively, a diagnosis of diabetes could simply be noted in the free-text narrative portion. Indeed, there are often multiple ways to store the same information within the EMR (175); thus, data of interest may be found in multiple locations within the EMR. All data within the record have an associated date and time, allowing PCPs to look back in the record to observe changes over time.
EMRs support many functions beyond the mere storage and retrieval of information, including billing services, appointment scheduling, referral services, laboratory test requisitions, and medication prescriptions (173,174). Furthermore, EMRs often support other functions known as decision support tools. Examples of these tools include medication interaction tools, which alert PCPs to potential interactions between medications when prescribing (176); clinical guidelines, which provide easy access to evidence-based guidelines (177); and risk assessments, which estimate a patient’s risk of experiencing some future outcome (178).
27
2.4.2
Uptake of EMRs in Canada
The current rate of EMR use in Canada is more than twice that of 2009; thirty seven percent of PCPs used an EMR to store patient information in 2009, whereas 73% of PCPs reported doing so in 2015 (180). While this recent increase in uptake is promising, Canada still falls below the international average by 15% (180). Provincial rates were found to be quite variable, with Alberta at 85% adoption and New Brunswick at 40% adoption (180). Given their level of use and potential to support clinical care, the extent to which EMRs are being utilized has been examined. Only 41% of Canadian PCPs use EMRs to support quality of care decisions, such as drug interaction tools or reminders for regular care or screening tests, compared to 58%
internationally (180).
2.4.3
Use of EMRs for Research Purposes
EMRs represent a rich source of information describing a patient’s health and health care. EMR
databases can be linked together to form large repositories of patient information that allow for health surveillance to inform clinical and epidemiological research, public health interventions, health care planning, and quality assurance. For example, the Canadian Primary Care Sentinel
Surveillance Network (CPCSSN) is a collection of EMR databases from across Canada that contains primary care information on more than 1.5 million patients (181). This database has been used for surveillance of chronic diseases including hypertension (92), depression (182), and diabetes (59). Information are only recorded in an EMR where deemed clinically relevant by the EMR user; information such as physical activity, occupation, ethnicity, family history or other characteristics that may be important for research purposes are often not noted in EMRs.
However, an EMR is a great source of population-level data pertaining to patient characteristics including diagnoses, laboratory results, medication prescriptions, and referral patterns.
28
EMR data only describe the population receiving primary care, not necessarily the general population. A study looking at the representativeness of the CPCSSN national database found that, compared to data from the 2011 census, CPCSSN patients were somewhat representative of the Canadian population (185). CPCSSN patients were roughly 4 years older on average and less likely to be male, making it is necessary to adjust for age and sex to generalize results based on CPCSSN data to the general population. When applying EMR data to a primary care population, no adjustment is necessary.
EMR data are limited by their use of diagnostic codes as proxies for health events, such as disease development. For a symptom or disease to be successfully captured within an EMR, the patient or PCP must recognize and report the symptom or disease; subsequently, the practitioner must know the proper code and record this in the EMR. Any break in this stream of events will result in failure to capture the information. This has implications for research using EMR data, where the absence of a diagnostic code is often interpreted as the absence of disease. The extent to which this impacts results depends on how well diagnoses of disease are recorded in the EMR. Diseases with more significant and clearly defined diagnostic features, such as diabetes, are better recorded within the EMR (186). The use of diagnostic codes is also problematic as diagnostic codes are not always able to fully capture the complexities of chronic diseases.
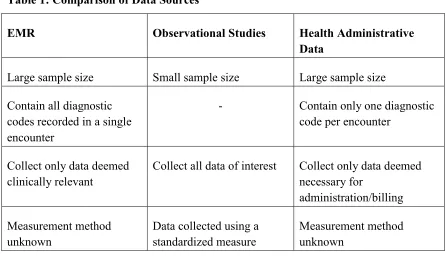
Compared to alternative sources of health information, such as health administrative data or primary data collection from observational studies, EMR data are both rich and numerous. Despite describing the health of the majority of the population in Canada, health administrative data are limited by what is captured; for example, only billing codes for the “most responsible diagnosis” are stored in health administrative databases (187). EMR databases can be used to
overcome this limitation as they contain a rich history of patients’ health, including past and
29
not describe the measure used (175). Primary data collection, however, requires significantly greater resources when compared to EMR data (188), where the data have been previously collected.
Table 1: Comparison of Data Sources
EMR Observational Studies Health Administrative
Data
Large sample size Small sample size Large sample size
Contain all diagnostic codes recorded in a single encounter
- Contain only one diagnostic
code per encounter
Collect only data deemed clinically relevant
Collect all data of interest Collect only data deemed necessary for
administration/billing
Measurement method unknown
Data collected using a standardized measure
Measurement method unknown
2.5
Summary
The current literature demonstrates the need for novel techniques aimed at the prevention of chronic disease. In particular, multimorbidity is a pressing concern for which prevention
techniques remain underdeveloped. Prognostic predictive models present an opportunity for such
30
Chapter 3
3
Methods
The following chapter describes the development of a prognostic PPM for multiple chronic diseases using data from EMRs. Logistic regression and copula modelling were used in model development.
3.1
Data Source
Data were derived from the Canadian Primary Care Sentinel Surveillance Network (CPCSSN) database (181). Initially formed in 2008 through funding provided by the Public Health Agency of Canada (PHAC), this nation-wide database contains patient information from EMRs of primary care practices across Canada (184). The objective of this network is to enable both the surveillance of chronic disease and primary care research at a national level. CPCSSN aims to accomplish these goals by collecting clinical data that provide insight into the health of Canadians from a primary care perspective through clinical and epidemiological research.
31
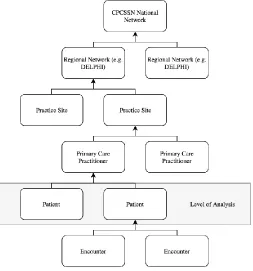
The CPCSSN database follows a hierarchical structure: individual patient encounters (visits with their PCP) are collected for each patient; these encounters are grouped by patients involved in these encounters; which are grouped by the PCP from which they receive care; which are grouped by the primary health care (PHC) site in which they practice; which are grouped by the network to which they contribute their data; which are then contained within the CPCSSN database. Originally involving 7 academic primary care research networks across 4 provinces (Newfoundland, Quebec, Ontario, and Alberta) (184), the CPCSSN database now involves 12 regional networks across 8 provinces and territories. Initial recruitment of practices occurred from 2008 to 2010, in which family practices (mostly those associated with academic or
university sites, as these were more likely to participate in research) were recruited to contribute their data to the CPCSSN database. Following this initial period, recruitment expanded to
include non-academic practices in various settings (urban, suburban, and rural). Past and ongoing patient consent was obtained via an opt-out system, in which patients who do not wish for their information to be contributed to the database may choose to opt out; all provinces operate under this system, except for Quebec, where an opt-in process is mandated by provincial law. Within these regional networks are 218 practices. Ontario, as one of the founding and most populated provinces, has the greatest number of participating practices. British Columbia and Quebec make smaller contributions as British Columbia is a relatively new network and legislative
requirements in Quebec deter the process. The CPCSSN database contains records from 1189 PCPs. Data describing the nature of PCP’s practice, such as profession (i.e. physician or nurse
practitioner) or payment model (e.g. fee-for-service or capacitation), are unavailable for most PCPs. CPCSSN contains deidentified records of more than 1.5 million patients, making it the largest source of primary care information available in Canada.
The CPCSSN database is comprised of several data tables containing information pertaining to either the practice, provider, patient, or patient encounter. For example, the Billing table contains all ICD-9 codes used by the provider to submit a billing claim; these data can be used to identify diagnoses made by the provider. Note, however, that providers are limited to one diagnosis per patient encounter, thus the diagnosis recorded is known as the most responsible diagnosis. The
32
patient demographics, billing codes, laboratory results, prescriptions, referrals, risk factor information, medical procedures, vaccinations, and allergies. For privacy reasons, the free-text narrative where PCPs record their notes is not available in CPCSSN. Tables were linked using an identifier unique to each patient.
Table 2: CPCSSN Data Tables
Table Name Contents Format Completeness
Billing Diagnoses ICD-9 Codes -
Health Condition Diagnoses ICD-9 Codes
Free text
-
Encounter Diagnosis Diagnoses ICD-9 Codes
Free Text
-
Patient Age Numeric 99.8%
Sex Text 99.9%
Patient Demographic Occupation Text 5.1%
Highest education Text 2.0%
Housing status Text 4.4%
Forward Sortation Area (FSA)
Text 95.4%
Language Text 14.1%
Ethnicity Text 1.0%
Lab Laboratory results Numeric -
Exam Examination results Numeric -
Medication Medication prescriptions Text -
Family History Reported family history Text -
Risk Factor Reported risk factors Text -
Medical Procedure Medical procedures Text -
Referral Referrals Text -
Vaccine Vaccines received Text -
Allergy/Intolerance Allergies and intolerances Text -
Disease Case Validated cases of disease Text -
Provider Age Numeric 87.8%
Sex Text 98.3%
(Provider) Group Info Group type Text 75.9%
Payment model Text 3.4%
Site Province Text 100%
33
participation (185). As of 2013, CPCSSN patients were older and more likely to be female compared to the overall Canadian population as reported in census data. Research has demonstrated that this trend is typical of primary care (189–191). Compared to practitioners responding to the National Physician Survey, CPCSSN practitioners were younger, more likely to be female (51.1 vs. 44.0%), and from an academic practice (19.3% vs. 7.8%) (185).
First, the construction of a PPM requires an understanding of what risk factors are known to increase the risk of disease development. Next, a cohort of people whose risk factor status at baseline and their subsequent disease outcome are known is needed. From this cohort, multivariable models are built to describe the associations between each risk factor and the disease outcome.
3.2
Measures
3.2.1
Outcome
The following diseases were predicted simultaneously: diabetes, hypertension, and osteoarthritis. These diseases were selected based on several criteria. First, the selected diseases are among the most prevalent in Canada (53,192). Previously validated case-detecting algorithms for use with EMR data exist for these diseases (described more fully below) (193). These diseases are often diagnosed and treated in primary care (54,85,105). Each of these diseases have modifiable risk factors, some of which overlap between diseases (35,36,63,70). Finally, expert consultation revealed that risk estimations for the selected diseases, in particular their co-occurrence, would be clinically useful. In this work, recovery from disease was considered not possible; once a patient has one of the diseases, they will always have the disease.
Chronic pain and asthma were also among the most prevalent diseases; however, neither have a validated case-detecting algorithm.
One initiative of CPCSSN researchers has been to develop and validate case detecting algorithms for several chronic diseases that can be used to identify cases of disease within the database (193). In an effort to facilitate quality research, CPCSSN has created disease case-detecting algorithms for osteoarthritis, depression, hypertension, diabetes, chronic obstructive pulmonary