Measuring Young’s Modulus of Low-Density Foam Concrete Using
Resonant Frequency
Yu Song 1,* and David A. Lange 2
1 Research Assistant, Department of Civil and Environmental Engineering, University of Illinois, IL 61801-2352, US
2 Professor, Department of Civil and Environmental Engineering, University of Illinois, IL 61801-2352, US; [email protected]
Correspondence: [email protected]
ABSTRACT:
Foam concrete is a construction material with controllable low strength and untraditional physical properties. Its highly crushable nature leaves it a niche as an engineered energy-absorbing material in many value-added applications; however, fundamental understanding of the material properties is crucial. As foam concrete is highly cellularized and ductile, conventional concrete testing methods such as compression test are insufficient to characterize the key material attributes of foam concrete, especially when the foam density is low. The resonant frequency test (ASTM C215) is specified for evaluating dynamic Young’s modulus of normal concrete. Inspired by the non-destructive feature of this test, we investigate the possibility of using the resonant frequency test to continuously monitor the modulus build-up of foam concrete with age. For the representativeness of the samples, three variables are considered in material design—bulk density ranging from 0.4 to 1.2 g/cm3, water to cementitious materials ratio of 0.42 and 0.47, and fly ash replacement of 10 and 30% by weight of cement. After examining the different vibration modes, the fundamental transverse frequency is determined most suitable for interpreting the foam modulus. The experimental results demonstrate good accuracy of using this approach for the measurement of different samples. It is also confirmed that, for a given foam concrete, the foam modulus can be predicted by knowing the foam density and solid modulus of its base cement paste, which provides an important insight for the further studies and real applications of foam concrete.
KEYWORDS: cellular material; cellular concrete; foam concrete; foam material; mechanical property; Young’s modulus; foam modulus.
Introduction
Foam concrete is a lightweight construction material with a highly cellularized microstructure. As compared with solids, it is a composite of air voids and hardened cement paste or mortar. In extremity, the air content can be higher than 85% [1]. Due to its high porosity, the foam concrete density ranges from 0.3 to 1.6 g/cm3 [2], leading to a low strength ranging between 30 and 1500 psi [3,4]. It is classified as low-density controlled low-strength material (LD-CLSM) according to ACI 229 [5]. As compared with conventional low-strength concrete, foam concrete consumes less solid materials including cement and aggregates. Furthermore, owing to its low-strength nature, foam concrete is an attractive use of high-volume recycled materials, such as fly ash and recycled fine aggregate. Potential applications of foam concrete exploit its unique lightweight and cellular features, such as temporary landfilling material, thermal isolation, and acoustic barrier [3,4]. Past studies on foam concrete have focused on general properties such as density, strength, thermal conductivity, and fire resistance. Comprehensive reviews of related research efforts are given by Ramamurthy et al. [6,7]. Advantages of using foam concrete for low-strength construction applications include ease of construction, improved affordability, such as material and labor costs, and enhanced engineering sustainability, such as inclusion of recycled materials [4,8,9]. However, current understanding of foam concrete mechanical property remains limited, which impedes its broader field applications. This issue is strongly related to a gap in our understanding of Young’s modulus of foam concrete, as this material dependent further relates to several critical mechanical properties. In particular, the crux lies in the measurement. Due to the low strength, most material testing methods used on normal concrete are destructive to the void structure in foam concrete, especially for low-density samples.
To address the above-stated problem, this research effort aims at estimating Young’s modulus of foam concrete using non-destructive resonant frequency test (ASTM C215). This test is specified for evaluating dynamic Young’s modulus of normal concrete based on the material’s fundamental vibration frequency [10,11]. This method was also used for indicating freeze-thaw durability of foam concrete [12]. However, the feasibility of using resonant frequency test for measuring Young’s modulus of foam concrete has not been comfirmed by any publication. In this study, we examined different foam concrete samples with bulk density ranging from 0.4 to 1.2 g/cm3, water to cementitious materials ratio of 0.42 and 0.47, and fly ash replacement of 10 and 30% by weight of cement. The experimental results of this study demonstrate good consistency on the frequency measurement and desirable accuracy for measuring Young’s modulus of foam concrete samples with different densities and material constituents. Furthermore, a prediction of Young’s modulus of the foam concrete based on that of hardened cement paste is proved to be successful.
Hypothesis
For typical cellular solids, Young’s modulus of solid cellular material is mainly controlled by two factors: porosity and property of the cell-wall material, as proposed by Ashby et al. [13,14] ,. the relationship between Young’s modulus of the cellular (foam modulus) and the solid (solid modulus) is provided in Eq.1 [13]:
where E is foam modulus of a cellular solid; Es is solid modulus, Young’s modulus of the solid the cell wall material; ρ/ρs is relative density, the density ratio between the bulk material and solid component; and the parameter c is a material dependent constant.
However, it has not been confirmed that if this rule is suitable for characterizing foam concrete, due to the complex quasi-brittle nature of cementitious materials. For the experimental side of this study, E of foam concrete was measured with the resonant frequency test, and ρ and ρs was determined by lab measurements. Thus, Es of the hardened cement in the foam concrete sample was obtained from calculation. Meanwhile, Es was obtained experimentally by testing the pure cement paste without foaming. If Ashby’s theory is applicable, the values of Es from the two approaches are expected to be closely matched, in spite of the density variation of the foam concrete; additionally, the Es obtained from the direct measurement can also be used to predict E of the foamed sample.
Materials and methods
1. Mixture design
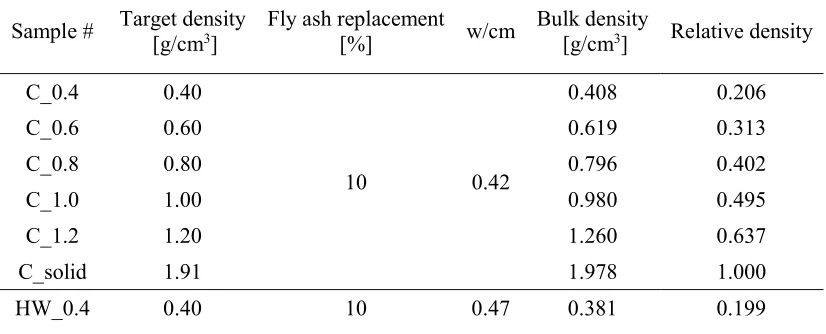
To study the performance of the resonant frequency test for various mixtures, three groups of foam concrete samples of different water to cementitious ratios, w/cm (0.42 and 0.47) and different fly ash replacements (10% and 30%) were compared. Five foamed samples with different densities ranging from 0.4 to 1.2 g/cm3 and a solid cement paste were prepared for each group, and two specimens were cast for each of the samples. Detailed information of the mixture design is given in Table 1. As a control group, samples of Group C had a w/cm of 0.42 and 10% fly ash replacement by weight of cement. In contrast, Group HW samples had a higher w/cm ratio of 0.47, and Group HF samples had a higher fly ash replacement of 30%.
For the convenience of the discussion, the name of the samples designates the mixture group and the target density, while “solid” is used for the paste samples. In each mixture, the dosage of the hardening accelerator was 8% by weight of the cement. Because a portion of the water was used for the foam, the effective w/cm for mixing the cement paste was lower. To maintain the same flowability of cement paste across all mixtures, different amounts of superplasticizer were dosed, depend on cement usage, w/cm of the whole mixture, and the effective w/cm of paste mixing.
Table 1—Mixture design and bulk density of the samples.
Sample # Target density [g/cm3] Fly ash replacement [%] w/cm Bulk density [g/cm3] Relative density
C_0.4 0.40
10 0.42
0.408 0.206
C_0.6 0.60 0.619 0.313
C_0.8 0.80 0.796 0.402
C_1.0 1.00 0.980 0.495
C_1.2 1.20 1.260 0.637
C_solid 1.91 1.978 1.000
4
HW_0.6 0.60 0.583 0.304
HW_0.8 0.80 0.786 0.410
HW_1.0 1.00 0.983 0.512
HW_1.2 1.20 1.160 0.604
HW_solid 1.85 1.919 1.000
HF_0.4 0.40
30 0.42
0.416 0.218
HF_0.6 0.60 0.568 0.298
HF_0.8 0.80 0.827 0.433
HF_1.0 1.00 1.023 0.536
HF_1.2 1.20 1.170 0.613
HF_solid 1.88 1.908 1.000
2. Sample preparation
The materials used for casting the foam concrete samples were Type I cement, class F fly ash, water, hardening accelerator (32% CaCl2), superplasticizer (Sika ViscoCrete 2100), and foaming agent (BASF MasterCell 30). The liquid chemical admixtures and the liquid phase in the foam were also considered as water sources for cement hydration. For the foam preparation, the volume ratio between foaming agent and water was 1:15, and the mixture was aerated to the maximum volume using a portable pail mixer. In addition to the foam preparation, the cement paste was prepared based the standard method specified in ASTM C305 [15], and preparation of the foam concrete mixtures followed the standard guideline specified in ASTM C796 [16]. Specifically, the foam was added to the cement paste progressively to control the total volume of the mixture. As such, the mixture density was regulated a narrow range. The final mixture was obtained when the total volume reached the target value and the mixture was evenly blended. The fresh mixture was then gently cast into 2×2×8 inch (50.8×50.8×203.2 mm) prism molds. A thin plastic film was used to seal the specimens to prevent moisture loss.
The specimens were demolded three days after casting, and then kept in 100% RH environment throughout the testing period. Following this, the specimens were then tested for the resonant frequency at the ages of 7, 14, and 21 days. The bulk density of each mixture was measured upon demolding, and the results are provided in Table 1. Any specimen that deviated more than 5% of the designed density was rejected, and the corresponding sample was recast. Additional measurements at later ages suggested little change in bulk density. For the “solid” samples that were pure cement paste, the density is equal to that of the solid phase in foam concrete (i.e., ρs), whereby the relative density of each sample was calculated.
3. Resonant frequency test
frequency in this test was set at 200 kHz, resulting in a 4-Hz signal resolution in the frequency domain.
During the measurement, all three fundamental vibration modes (longitudinal, transverse, and torsional) were excited by impacting the specimen with a small ball bearing impactor at different locations on the specimen, as specified in ASTM C215 [11]. The testing module transferred the mechanical vibrations detected by the sensor into time-domain signals, which were further transformed to frequency-domain spectrum using an FFT algorithm. The frequency of each fundamental vibration modes was then determined from the frequency-domain spectrum, based on location and intensity of the peak [10,11]. For each specimen, the measurement for each vibration modes was repeated three times, and the vibration frequency result was averaged from the three readings.
For each group of samples, the foam modulus results of the foamed samples were used to estimate the solid modulus using Eq.1. A well-matched comparison of the measured and predicted solid modulus is attainable only if the measurement is accurate and the relationship revealed by Eq.1 is applicable. This is to say, since the solid phases in the samples are identical, the predicted solid modulus of the foamed samples should be similar to that experimentally measured from the paste samples.
Results and discussion
1. Comparison of results from different fundamental vibration modes
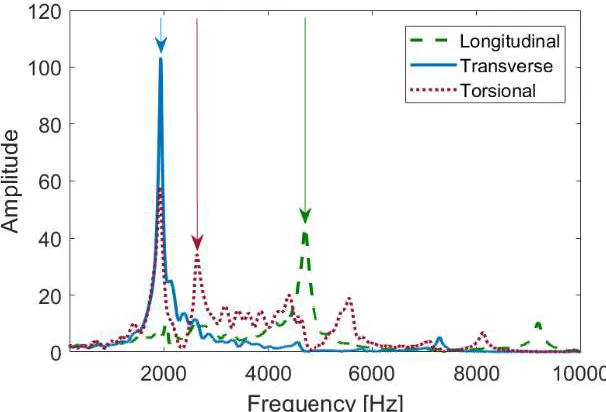
To investigate Young’s modulus of foam concrete, three groups samples with different densities were prepared and tested for bulk density and fundamental vibration frequency. According to ASTM C215, Young’s modulus of the samples can be calculated either using the longitudinal and transverse fundamental frequency[11]. However, it was found that the transverse mode was preferable, as illustrated with a simple example of the frequency measurement in Fig. 1.
FIG. 1—A typical result of the frequency spectrum of the three fundamental vibration modes,
6
The peak belonging to the transverse fundamental vibration mode was typically sharper, reaching to a greater amplitude; in contrast, the peak of longitudinal mode was relatively gentle, making the peak position easily affected by noise and leaving a more subjective measurement. Note that the secondary vibration modes were generated when the measurement was intended for the longitudinal and the torsional vibrations. With the same amount of impact force, it was easier to excite the transverse vibration in the specimens. Furthermore, the transverse peak was consistently found as the first major peak in the spectrum. Therefore, the transverse mode was more recognizable and accurate in practical terms. For each specimen and at all ages of testing in this experiment, the fundamental frequency of the transverse variation mode was found to vary in a small range of ±4 Hz. As a result, only the transverse frequency was used for the subsequent analysis of Young’s modulus.
2. Young’s modulus of foam concrete
After the measurement, the fundamental transverse vibration frequency was used to calculate foam modulus of the samples., and the equation for the calculation is provided in Eq.2 [11]:
𝐸 = 𝐶𝑀𝑛 (2)
where, E is Young’s modulus; C is a geometry parameter; M is the mass of the specimen; and n is the fundamental transverse vibration frequency.
After averaging the three readings of the transverse frequency, foam modulus of each specimen was obtained. The final foam modulus results of each sample took the average from the two specimens. Subsequently, solid modulus of each foamed sample was calculated by normalizing the foam modulus using Eq.1. By comparing the results with different constant c in Eq.1, it was found that a good fitting could be achieved when this parameter equaled to 1. This finding is agreed by the proposed value for cellular ceramics [13].
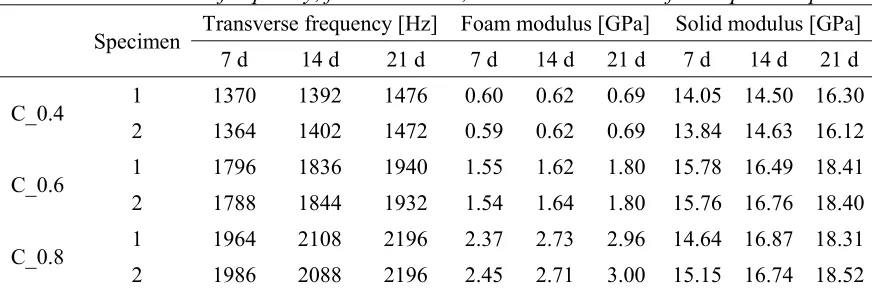
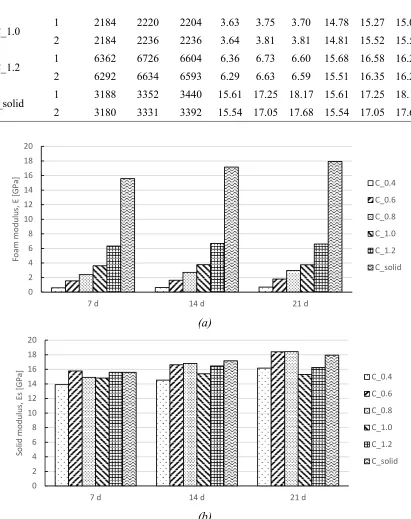
To study the feasibility of the proposed testing approach, the focus is placed on Group C results in this section. The transverse frequency, foam modulus, and solid modulus of each specimen of Group C samples are summarized in Table 2. For convenience of discussion, the averaged results of foam and solid modulus are compared in Fig. 2(a) and (b), respectively. As expected, foam modulus of the samples increased with the bulk density, ranging from 0.6 to 18 GPa. Sample C_0.4 had the smallest E value at all three ages, and that of Sample C_solid was the largest. Comparing the result for each sample, little difference was noticed from the two specimens. Meanwhile, the Es results were considerably close at the same age. On average, the Es results were gradually increased from 7 to 21 days, as cement paste in the samples continued to hydrate during this period.
Table 2—Transverse frequency, foam modulus, and solid modulus of Group C samples.
Specimen Transverse frequency [Hz] Foam modulus [GPa] Solid modulus [GPa]
7 d 14 d 21 d 7 d 14 d 21 d 7 d 14 d 21 d
C_0.4 1 1370 1392 1476 0.60 0.62 0.69 14.05 14.50 16.30
2 1364 1402 1472 0.59 0.62 0.69 13.84 14.63 16.12
C_0.6 1 1796 1836 1940 1.55 1.62 1.80 15.78 16.49 18.41
2 1788 1844 1932 1.54 1.64 1.80 15.76 16.76 18.40
C_0.8 1 1964 2108 2196 2.37 2.73 2.96 14.64 16.87 18.31
C_1.0 1 2184 2220 2204 3.63 3.75 3.70 14.78 15.27 15.05
2 2184 2236 2236 3.64 3.81 3.81 14.81 15.52 15.52
C_1.2 1 6362 6726 6604 6.36 6.73 6.60 15.68 16.58 16.27
2 6292 6634 6593 6.29 6.63 6.59 15.51 16.35 16.25
C_solid 1 3188 3352 3440 15.61 17.25 18.17 15.61 17.25 18.17
2 3180 3331 3392 15.54 17.05 17.68 15.54 17.05 17.68
(a)
(b)
FIG. 2—Results of Group C: (a) foam modulus; and (b) solid modulus.
Based on Fig. 2(a), there is a clear trend that the sample foam modulus increases exponentially with density at all three ages. This finding is encouraging, as the measured results follow the relationship revealed by Eq.1. Despite the small fluctuations in Fig. 2(b), the similar Es values indicate that the different samples had a highly similar solid phase. After all, same cement paste was designed for these samples. Hence, an accurate measurement of E of the samples must have been achieved so that the resonant frequency test is validated, which further supports applying Ashby’s theory for understanding foam concrete in this study [13].
0 2 4 6 8 10 12 14 16 18 20
7 d 14 d 21 d
Fo am m od ul us , E [G Pa ] C_0.4 C_0.6 C_0.8 C_1.0 C_1.2 C_solid 0 2 4 6 8 10 12 14 16 18 20
7 d 14 d 21 d
8
In terms of hydration age, marginal increments were found after 7 days, indicating cement hydration in the samples was almost stopped at this stage. This result may be explained by the fact that a high dosage of hardening accelerator was used during sample preparation, which significantly reduced the time length for cement hydration. One unanticipated finding was that E and Es of Samples C_1.0 and C_1.2 declined at 21 days. This result is likely related to shrinkage issue of the hydrated cement. This is partially supported by the crevices visually observed on the corresponding specimens. Although this decline was not identified for the samples of lower densities, the shrinkage issue may still exist due to the nature of cement hydration. Possibly, the shrinkage stress in the low-density samples is more evenly distributed due to the highly discontinuous solid phase so that the modulus results are less affected.
3. Influence of varying w/cm ratio and fly ash replacement on the measurement
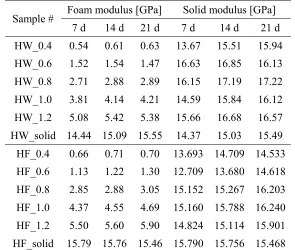
The influence of different material constitution of foam concrete on the testing is studied using samples in Groups HW and HF,which had a higher w/cm ratio of 0.47 and a higher fly ash replacement of 30%, respectively. The results of foam and solid modulus, averaged from two specimens of each sample, are summarized in Table 3. In general, the measured E values in both groups also followed a pattern of exponential growth as a function of density. Gradual increments of Es were seen from 7 to 21 days, but the results of Group HF were slightly higher than Group HW at the same ages. However, both the two groups of samples had smaller Es values as compared with Group C. This is expected, as the two changes in Groups HW and HF are intended to reduce Young’s modulus of the paste.
Table 3—Foam modulus and solid modulus of samples in Groups HW and HF.
Sample # Foam modulus [GPa] Solid modulus [GPa]
7 d 14 d 21 d 7 d 14 d 21 d
HW_0.4 0.54 0.61 0.63 13.67 15.51 15.94
HW_0.6 1.52 1.54 1.47 16.63 16.85 16.13
HW_0.8 2.71 2.88 2.89 16.15 17.19 17.22
HW_1.0 3.81 4.14 4.21 14.59 15.84 16.12
HW_1.2 5.08 5.42 5.38 15.66 16.68 16.57
HW_solid 14.44 15.09 15.55 14.37 15.03 15.49
HF_0.4 0.66 0.71 0.70 13.693 14.709 14.533
HF_0.6 1.13 1.22 1.30 12.709 13.680 14.618
HF_0.8 2.85 2.88 3.05 15.152 15.267 16.203
HF_1.0 4.37 4.55 4.69 15.160 15.788 16.240
HF_1.2 5.50 5.60 5.90 14.824 15.114 15.901
HF_solid 15.79 15.76 15.46 15.790 15.756 15.468
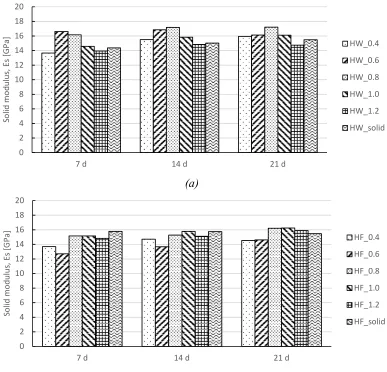
of the same group samples. On average, the Es values of Group HW and HF are noticeably lower than Group C. These results support that the resonant frequency measurement is not affected by the changes of material constitution and the measurement is still acceptably accurate.
However, the consistency of the Es results drops as the density reaches to the lower end, which is seen in all three groups. This phenomenon is mostly likely caused by the foam stability issue. As the sample density becomes smaller, the fresh foam is less stable and the foam structure in fresh foam concrete becomes more difficult to control. This observation is in accord with several studies indicating that aqueous foam structures vanish at a higher rate when density decreases [1,17,18]. For a given foam concrete, the foam modulus predicted by Eq. 1 is in fact the maximum value in theory, whereas the actual result can be largely influenced by the quality of its foam structure. During the sample preparation, a trade-off exists in the mixing of foam and paste. If the mixing is insufficient, the two phases cannot be mixed effectively. If the mixing is excessive, it is difficult to preserve the air bubbles in the mixture. Both the scenarios will result in degradation of the void structure. This problem of void instability is especially true when the foam density approaches to the lower limit.
(a)
(b)
FIG. 3—Comparisons of the solid modulus of samples in: (a) Group HW; and (b) Group HF.
0 2 4 6 8 10 12 14 16 18 20
7 d 14 d 21 d
So lid m od ul us , E s [G Pa ] HW_0.4 HW_0.6 HW_0.8 HW_1.0 HW_1.2 HW_solid 0 2 4 6 8 10 12 14 16 18 20
7 d 14 d 21 d
10
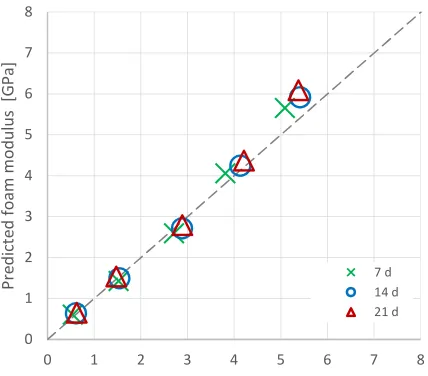
4. Predict Young’s modulus of foam concrete with that of hardened cement paste
As solid modulus of the paste samples was also obtained from the measurement, Young’s modulus of the foamed samples could be reversely predicted using Eq.1, with the constant c equals to 1. Following this idea, the measured and predicted results of E of the foamed samples are compared on a group basis in Fig. 4. Across the three comparisons, the data points are distributed closely to the line of equality at all three ages. Considering unavoidable measurement error related to experimental condition, limit of the testing instrument, as well as human judgment for peak identification, the prediction agrees considerably well with the measurement. This agreement is insensitive to density, hydration age, and change of cement paste constitution investigated in this study.
This strong correlation further supports the idea of using the solid modulus of the hardened cement paste to calculate the foam modulus of foam concrete, whereby the unknown of foam concrete is directly bridged with our well-established knowledge of solid cement paste. From a practical perspective, this encouraging finding is of special significance. As the hardened property of solid cement paste (i.e. solid modulus) has been studied extensively and can be measured using many different approaches, the foam modulus can be directly predicted with acceptable accuracy.
(a) 0
1 2 3 4 5 6 7 8
0 1 2 3 4 5 6 7 8
Pr
ed
ic
te
d
fo
am
m
od
ul
us
[
G
Pa
]
(b)
(c)
FIG. 4—Comparisons of the measured and the predicted foam modulus of samples in (a) Group C, (b) Group HW, and (c) Group HF.
Conclusions
A non-destructive approach to measure Young’s modulus of low-density foam concrete was shown to be feasible. Three groups of samples of different material constituents were cast for measurement of fundamental resonant frequency. For each group, the density of the foamed samples ranged from 0.4 to 1.2 g/cm3, and a paste sample was prepared for comparison. In terms of the vibration mode, it was found that the peak frequency of transverse mode was not only easier to identify but also more consistent. Therefore, the transverse fundamental frequency was used for calculating the foam modulus of the samples in this study.
0 1 2 3 4 5 6 7 8
0 1 2 3 4 5 6 7 8
Pr ed ic te d fo am m od ul us [ G Pa ]
Measured foam modulus for Group HW [GPa] 7 d 14 d 21 d 0 1 2 3 4 5 6 7 8
0 1 2 3 4 5 6 7 8
Pr ed ic te d fo am m od ul us [ G Pa ]
12
For all three groups of samples, the foam modulus increased exponentially as a function of density. The test method worked well for all mixtures and the mixing protocol used in this study. By comparing samples with different density, the results were consistent with Ashby’s formulation for Young’s modulus of the cellular material and its solid component. For samples that were composed of the same paste mixtures (i.e., solid constituents), the normalized solid modulus results were proved to be very similar in magnitude. In general, this method worked well for a wide range of bulk density, hydration age, material constitution of the foam concrete samples.
The results also showed that the foam modulus can be predicted with reasonable accuracy based on the solid modulus of hardened cement paste, unless the foam density becomes extremely low such that the void instability issue becomes prominent. This finding is insightful from a practical perspective for designing foam concrete products. Once the properties of a solid unfoamed cement paste is known, the properties of any foam concrete made with that paste can be predicted.
Acknowledgement: The authors would like to acknowledge funding from the University Transportation Center for REsearch on Concrete Applications for Sustainable Transportation (RE-CAST), the O’Hare Modernization Program, and the Chicago Department of Aviation (CDA). The authors also acknowledge laboratory contributions of Ivan Chung.
Reference
[1] Jones, M. R., Ozlutas, K., and Zheng, L., “Stability and Instability of Foamed Concrete,”
Mag. Concr. Res., Vol. 68, No. 11, 2016, pp. 542–549.
[2] Wei, S., Yunsheng, Z., and Jones, M. R., “Using the Ultrasonic Wave Transmission Method to Study the Setting Behavior of Foamed Concrete,” Constr. Build. Mater., Vol. 51, 2014, pp. 62–74.
[3] Jones, M. R., and McCarthy, A., “Behaviour and Assessment of Foamed Concrete for Construction Applications,” presented at the Use of Foamed Concrete in Construction:
Proceedings of the International Conference held at the University of Dundee, Scotland,
UK, July 5, 2005, Thomas Telford Publishing, pp. 62–88.
[4] Jones, M. R., and McCarthy, A., “Preliminary Views on the Potential of Foamed Concrete as a Structural Material,” Mag. Concr. Res., Vol. 57, No. 1, 2005, pp. 21–31.
[5] ACI Committee 229, "229R-13 Report on Controlled Low-Strength Materials," 2013, Farmington Hills, MI.
[6] Narayanan, N., and Ramamurthy, K., “Structure and Properties of Aerated Concrete: A Review,” Cem. Concr. Compos., Vol. 22, No. 5, 2000, pp. 321–329.
[7] Ramamurthy, K., Kunhanandan Nambiar, E. K., and Indu Siva Ranjani, G., “A
Classification of Studies on Properties of Foam Concrete,” Cem. Concr. Compos., Vol. 31, No. 6, 2009, pp. 388–396.
[8] Jones, M., and McCarthy, A., “Utilising Unprocessed Low-Lime Coal Fly Ash in Foamed Concrete,” Fuel, Vol. 84, No. 11, 2005, pp. 1398–1409.
[9] Nambiar, E. K. K., and Ramamurthy, K., “Influence of Filler Type on the Properties of Foam Concrete,” Cem. Concr. Compos., Vol. 28, No. 5, 2006, pp. 475–480.
[10] Hooton, R., Kolluru, S., Popovics, J., and Shah, S., “Determining Elastic Properties of Concrete Using Vibrational Resonance Frequencies of Standard Test Cylinders,” Cem.
Concr. Aggregates, Vol. 22, No. 2, 2000, pp. 81-89.
[12] Tikalsky, P. J., Pospisil, J., and MacDonald, W., “A Method for Assessment of the Freeze-Thaw Resistance of Preformed Foam Cellular Concrete,” Cem. Concr. Res., Vol. 34, No. 5, 2004, pp. 889–893.
[13] Ashby, M. F., and Medalist, R. F. M., “The Mechanical Properties of Cellular Solids,”
Metall. Trans. A, Vol. 14, No. 9, 1983, pp. 1755–1769.
[14] Gibson, L. J., and Ashby, M. F., Cellular Solids, Cambridge University Press, Cambridge, 1999.
[15] ASTM C305-14 Standard Practice for Mechanical Mixing of Hydraulic Cement Pastes and Mortars of Plastic Consistency, ASTM International, West Conshohocken, PA, 2014. [16] ASTM C796/C796M-12 Standard Test Method for Foaming Agents for Use in Producing Cellular Concrete Using Preformed Foam, ASTM International, West Conshohocken, PA, 2012.
[17] Boos, J., Drenckhan, W., and Stubenrauch, C., “Protocol for Studying Aqueous Foams Stabilized by Surfactant Mixtures,” J. Surfactants Deterg., Vol. 16, No. 1, 2013, pp. 1–12. [18] Feitosa, K., Halt, O. L., Kamien, R. D., and Durian, D. J., “Bubble Kinetics in a