An Evaluation-Driven Design Process for Exhibitions
Wolfgang Leister1,*, Ingvar Tjøstheim1, Göran Joryd2, Michel de Brisis2, Syver Lauritzsen2, and Sigrun Reisæter3
1 Norsk Regnesentral, Postboks 114 Blindern, NO-0314 Oslo, Norway; [email protected] 2 Expology AS, Postboks 5386 Majorstuen, NO-0304 Oslo, Norway; [email protected]
3 Engineerium, Snarøyveien 20, NO-1364 Fornebu, Norway; [email protected] * Correspondence: [email protected]; Tel.: +47-22852578
Abstract:Museums and Science Centres are informal education environments that intend to engage the visitors with their exhibits. We present an efficient design process that allows an improved working relationship between museum practitioners, exhibition designers, and visitors. We present the principles and a graphical representation based on the Engagement Profile from previous work. Elements of the design process are evaluated using a learning game at the science centre Engineerium. The evaluation is based on a study with over five hundred visitors to the science centre.
Keywords:design process; installations; science centres; museums; visitor engagement.
1. Introduction
Science centres and museums present exhibitions, installations, and educational programmes that are designed to engage visitors for self-education on a subject and to inspire the visitors to learn more. For exhibitions to be engaging, the exhibit design process needs to take care of the needs of the visitor. We propose an iterative design process that integrates mandatory assessments of visitor engagement parameters into the design process using theEngagement Profile, formerly denoted as the Visitor Engagement Installation (VEI) Profile [1] and real-time visitor engagement studies [1], [2]. An iterative design-process must include the museum practitioner, the designer, and the visitor. In today’s practice, the collaboration between these groups is, not formalised: the museum practitioner is in many cases unable to mediate the expectations to the designer; the designer intention are not understood by the visitor, and the effect of the design on the visitor is not evaluated. Only few of the available design methods include the concerns of all stakeholders, i.e., the curators, the desingers, and the visitors. Further, visitor testing is often conducted late in the development process or as a post-opening activity. Including the visitor in the design process seems, in many cases, to be done in an unstructured way.
Our contribution is a novel methodology for visitor-centered assessment. Further, we present a study of a learning game where visitors in a science centre were asked which dimensions of the engagement profile they wanted to change. The analysis was performed using survey data and a graphical tool based on the engagement profile.
First, we present an overview of related work about design processes for installations in science centres and museums, evaluation tools, and visitor characteristics (Section2). Then, our design process for installations is presented including the graphical visualisations (Section3). We show the viability of our approach (Section4) in a case study at the Engineerium outside Oslo. Further, we discuss the findings of the design process itself and the findings for the installations (Section5), before presenting our conclusion (Section6).
2. Related Work
exhibit designis the process of developing an exhibit from the early concept to the finalised installation. Although often used, this termexhibit designis, in most cases, implicitly defined. We have found a large research body of design approaches and design strategies, but less on the process itself.
Most approaches include exhibit evaluations and visitor studies at some point in the process, but these are not carried out systematically.
Roppola [3] noted that exhibition design remains one of the last museum disciplines ’for which no specific professional training is required or even available’. She posited that theoretical and empirical museum studies have not reached their potential in impacting exhibition design. She suggested the concepts of framing, resonating, channelling, and broadening as moment-by-moment transactions for the visitors.
2.1. Exhibit Design Processes
Doeringet al.[4] presented a high-level description of the exhibition making process, covering exhibition statement, exhibition plans, overall organisation, roles, and project management. They discussed exhibition making models suitable for diverse types of museums and suggested the stages of the exhibit design process: a) idea generation;b) concept development; c) design development; d) production, fabrication, and installation; ande) post-opening activities. Note thatDoeringet al.did not structure the single phases further nor did they emphasise the role of exhibit evaluations during exhibit design.
Bitgood [5] presented seven exhibit design approaches that describe which intention is in the foreground when developing an exhibit. More relevant for our research, he divided the design strategies into qualitative and quantitative approaches, the latter are subdivided into thevisitor perception strategy(using the visitors’ perception and reaction as a design goal) and theexperimental strategy(using the intended visitor behaviour as a design goal).
Bitgoodproposed three types of visitor measures of success:a) behaviour measures including
stopping (attracting power), viewing time (holding power), social impact, human factors impact, and trace or decay measures;b) knowledge acquisition (memory, comprehension); andc) affective measures (attitude change, interest level, satisfaction).
Skolnicket al.[6] gave an overview of exhibit design related to large exhibitions and fairs in terms of history, elements, process, and the role of the audience. They described a process that comprises of the following elements: a) concept phase, b) schematic design phase, c) design development, d) fabrication documents,e) fabrication, andf) installation. For audience involvement, they emphasise a) front-end evaluations during the concept phase,b) formative evaluations in the schematic design phase,c) prototype evaluations, andd) summative evaluations in the finished exhibition.
Several authors have presented exhibit design processes that include similar steps as described above, e.g., the work by Lin [7]. These design processes are often controlled by managers, curators, designers, etc., and they fail to involve the visitor the design process. In these approaches, evaluations are usually at the very end of the design process.
Young [8] has suggested that developers need to advocate for the visitors and think as a visitor; Young recommends a cyclical development process. She has presented the design approach suggested by McLean [9] that comprises of five phases: feasibility, preliminary design, detailed design, production planning, and production. Note that the post-opening activities are not included in this design model. In disciplines like software development, agile development processes have appeared that are not bound to traditional development phases. Instead, they advocate for iterative processes where diverse development tasks are performed in short iterations. These iterations include specification, implementation, and testing as mandatory elements. So-calledtest-driven development[10] requires that all development is aligned along written tests that developed software is checked against.
Since exhibit design often involves the development and implementation of complex hardware installations such agile processes cannot be implemented to its full extent. However, agile processes can be used in early steps and in the post-opening activities for incremental changes of exhibits.
analyse and foresee how users are likely to use a product. These assumptions are tested with users, thus involving the user into the design process.
2.2. Tools for Characterising Installations
A variety of methods are available for the evaluation of exhibits, including visitor observations [e.g.,12], video footage, and sensor-based methods [e.g.,13]. For the sake of brevity, we refer to a review of evaluation methods in our previous work [1, Section II].
As a practical approach for exhibit evaluation, Spegel [14] created theExpogon, a graphical tool used as a mind map for exhibit planners when going through a museum. It breaks down the exhibition medium into the six elements narrative, space, visitor, objects, time, and sender. Each element consists of fifteen hexagons representing categories, ten pre-filled and five empty for additional categories. The evaluator wanders through an exhibition and notes observations on the Expogon. It is a qualitative tool that gives hints to an evaluator on what to improve in an exhibition, but it does not reflect to what degree the six elements are fulfilled.
Schrandt [15] presented a design approach that focuses on the physical characteristics of the exhibits and their impact on visitors. This research studies characteristics, such as layout, atmospherics, ambient conditions, usage of space and media, and social interaction.
The engagement profile [1] was developed as a structured way of quantifying the characteristics in installations along eight dimensions, each dimension is given a value between zero and five according to the descriptions in a table. The dimensions of the engagement profile represent the degrees of competition(C),narrativeelements (N),interaction(I),physicalactivity (P),visitor (user) control(U),social aspects (S),achievementsawareness (A), andexplorationpossibilities (E). External influences are not taken into account in the engagement profile since these are not properties of the installation. Physical factors, such as noise, light or smell need to be handled separately. Further, properties that belong to the context, such as social factors, institutional factors, or recent incidents personally or globally, are excluded. However, these factors still need to be taken into account in the assessment process.
2.3. Characterising the Visitor
Most museums and science centres are targeted towards specific groups. Often, a segmentation based on the visitors’ situation is used in practice, identifying groups such as school classes, tourists, families, and weekend visitors.
Dierking and Falk [16] presented the Interactive Experience Model, which is a visitor-centric model. They defined the interactive experience influenced by the personal context, the physical context, and the social context. Falk [17] used the principle of identity-related motivation to place visitors into the five basic identity types:1) the explorer;2) the facilitator;3) the professional and hobbyist;4) the experience seeker;5) the recharger; as well as the two extra identities6) the respectful pilgrim, and 7) the affinity seeker. Variables, such as prior knowledge, experience, interest, visitor agenda, and social group are encapsulated in these identity types.
Note that the engagement for members of thefacilitatorgroup is not primarily related to an installation, but towards other visitors. Further, there are indications that the cardinality of the groups in this segmentation are uneven [18].
Tomiuc [19] has suggested to segment visitors intoa) the explorer;b) the analyst;c) the listener; d) the creator;e) the gamer; andf) the socialiser. However, this segmentation is not further outlined by the authors.
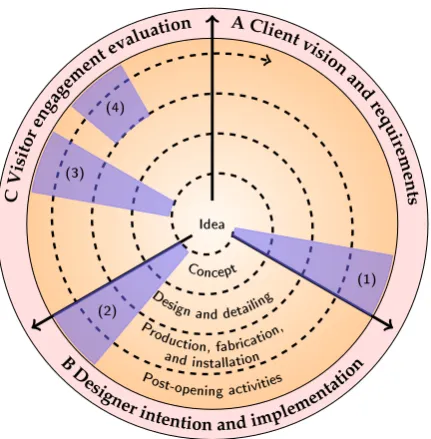
Idea
Concept Design and detailing Production, fabrication,
and installation Post-opening activities CV
isit or
enga gem
ent e valuati
on A Clien t vision
and req
u irem
en ts
B D
esig ner
intention and implement atio
n (4)
(3)
(2)
(1)
Figure 1.The design process for installations in science centres using the iterative model. The blue areas marked with numbers (1) to (4) indicate the parts of the evaluation activities.
cycle have been proposed [21]. The learning style for an individual can be determined by answering a questionnaire of 48 questions.
Manoliset al.[22] proposed the Reduced Learning Style Inventory (RLSI) with 17 items on a seven-point Likert scale. Note that the RLSI supports three factors, as RO and AE are expressed as one factor, denoted as AE.
3. A Design Process for Installations
The design of installations and exhibitions of a science centre or museum follows usually an iterative process. As outlined in Section2, the number of phases differs. We propose the following four phases: 1) concept, 2) design and detailing; 3) production, fabrication, and installation; and 4) post-opening activities. Each phase can be sub-divided into sub-phases, e.g., several iterations of one phase. The post-opening activities include a continuous process with regular and repeated evaluations of an exhibit. Figure1shows the design process as a spiral instead of emphasising on the distinct phases.
3.1. Phases of the Design Process
Each of the four phases consists of three stages:A) theclient visionrepresenting the functional and non-functional requirements set by the museum or science centre;B) thedesigner intentionrepresenting the creative processes; andC) thevisitor experience, represented by a visitor-centric assessment and evaluation process.
In the evaluation activity (3), the concept, design, or prototype is shown to a panel of visitors. The visitors are then asked for each dimension of the engagement profile whether this dimension should be changed using a scale of five values(−−,−, 0,+,++). Note that the visitors are assumed not to know the current engagement profile values.
While the median value from such an analysis can be directly added to the values from the designer intentiongiving the orange lines in the Engagement Design Diagram, we also suggest a more detailed visualisation of the visitor opinion in the Engagement Opinion Diagram as shown in Figures3 and4.
In evaluation activity (4), a measure for engagement is derived from the assessed data and observations. Different designs from the current and previous evaluations can be set against each other, and the design candidate with the highest score regarding engagement can be identified.
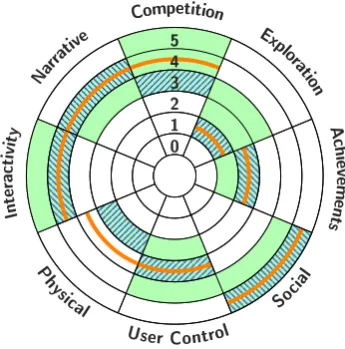
3.2. Presentation of the Engagement Profile
The exhibit design process is supported by graphical tools. As a further development to the spiderweb diagram for the engagement profile introduced by Leisteret al.[1], we use a representation of coloured arcs and areas that are placed in the respective slice for each of the eight dimensions. The reason for changing the representation is related to the slope of the lines in the spiderweb diagram visualising information that is not present in the real installation [23].
3.3. The Engagement Design Diagram
The engagement design diagram (see Figure2for an example) shows as green areas the client vision, as blue hatches the designer intention, and as orange lines the visitor experience. If the designer intention is outside the client vision, this should trigger a reflection with the stakeholders. Likewise, if the visitor experience is considerably outside the designer intention, this could be an indication that the visitors expect changes to the design. Thus, the engagement design diagram serves as a basis for discussions and an indication for changes to be made to the design in the next iteration.
3.4. The Engagement Opinion Diagram
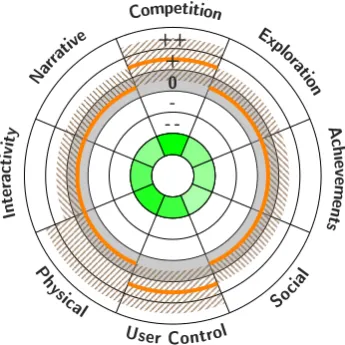
The engagement opinion diagram (see Figures3and4for examples) visualises the opinion of a group of visitors that are asked for each dimension whether they would prefer an installation with more or less points of each dimension. An orange line shows the median of the visitor responses while the shaded areas show the 10%-90% percentiles for the responses. The inner green colours indicate how many visitors want to keep a dimension as it is: the darker the green colour is the more visitors want a change.
4. Study Using Engineering Challenge
We tested elements of our proposed design process with installations atEngineerium, a science centre at Fornebu outside Oslo presenting installations about oil & gas, the art of engineering, technology, innovation, and energy. They also offer the interactive learning game Engineering Challenge for school classes as part of the curriculum for grades 8 to 13, i.e., lower and upper secondary school.
Competition
Narra tive
In
te
ra
ctiv ity
Ph ysical
User Control
Socia l
A ch
ievem
en
ts
Explo ration
0 1 2 3 4 5
Figure 2. The Engagement Design Diagram for Engineering Challenge showing the science centre vision (green), the designer intention (blue hatches), and the visitor responses (orange) of 492 lower secondary school students.
Table 1.Formulation of the questions and scales for visitor opinion.
For each of the eight dimensions of engagement, the following scale is used: -2 (much less), -1 (less), 0 (as now), 1 (more), 2 (much more).
QC Should there be more or less competition between groups and participants in the game? QN Should the storyline and roles in the game be more evident or less evident?
QI Should there be more or less feedback on the choices you did in the game? QP Should there be more or less physical activity in the game?
QU Should the story in the game be more or less influenced by what you did during the game? QS Should a considerable part of the game be done in a group or should there be more
individual tasks to solve?
QA Should there be more or less feedback on how well you are doing during the game? QE Should there be more or less possibilties to go in depth with extra content to solve the tasks
in the game?
First, we evaluated the science centre vision and the designer intention, which are both shown in Figure2.
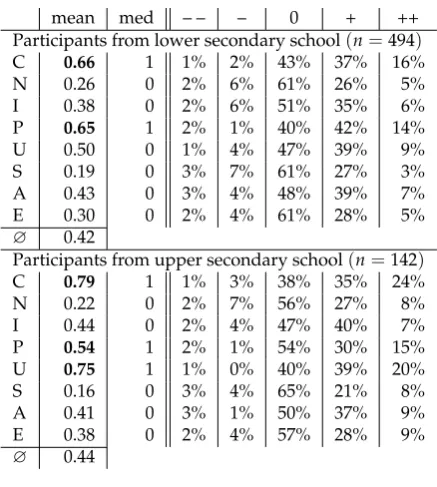
In a second step, we analysed the opinions of visitors recruited from high school classes: 494 students from lower secondary school and 142 students from upper secondary school. After the visit, the students were asked to answer two questionnaires: The questionnaire shown in Table1indicates changes to the engagement profile, while the questionnaire shown in Table2indicates how much the visitors liked the game and background about choosing to become an engineer.
We excluded responses with incompletes on the eight factors of the engagement profile. We did not remove outliers, although some of them seem obvious, such as answering -2 to all questions in Table1(n=3 in each of the groups). Note that answering 0 to these questions would make sense.
The results are shown in Table3and Table4, respectively. We present the results graphically in the Engagement Opinion Diagram in Figures3and4.
The responses are generally on the positive side, in the sense that the students want more of each dimension. However, the median values show that most of the dimensions should remain as they are, with the exception of C and P, followed by U (see Section2.2for the definitions of these dimensions). The upper secondary students want to increase the U dimension stronger than the lower secondary students.
Table 2.Formulation of the additional questions and scales.
Q1 How much did you like to participate inEngineerium Challenge? — Scale: 1 (disliked very much) to 5 (liked very much).
Q2 Do you recommendEngineerium Challengeto other visitors? — Scale: 1 (not at all) to 5 (very much).
Q3 I have made considerations which profession/education I want to choose. — Scale: 1 (none) to 4 (very much).
Q4 How much more do you know of the engineering profession after playingEngineering Challenge? — Scale: 1 (nothing) to 4 (very much).
Q5 How did the reputation of the engineering profession change by playingEngineering Challenge? — Scale: 1 (much worse), 2 (worse), 3 (as before), 4 (better), 5 (much better).
Table 3.Results from analysis with visitor participation. Mean values are printed in bold when above 0.5 or below -0.5. Bold values indicate that this dimension should be considered for a change.
mean med – – – 0 + ++
Participants from lower secondary school(n=494)
C 0.66 1 1% 2% 43% 37% 16%
N 0.26 0 2% 6% 61% 26% 5%
I 0.38 0 2% 6% 51% 35% 6%
P 0.65 1 2% 1% 40% 42% 14%
U 0.50 0 1% 4% 47% 39% 9%
S 0.19 0 3% 7% 61% 27% 3%
A 0.43 0 3% 4% 48% 39% 7%
E 0.30 0 2% 4% 61% 28% 5%
∅ 0.42
Participants from upper secondary school(n=142)
C 0.79 1 1% 3% 38% 35% 24%
N 0.22 0 2% 7% 56% 27% 8%
I 0.44 0 2% 4% 47% 40% 7%
P 0.54 1 2% 1% 54% 30% 15%
U 0.75 1 1% 0% 40% 39% 20%
S 0.16 0 3% 4% 65% 21% 8%
A 0.41 0 3% 1% 50% 37% 9%
E 0.38 0 2% 4% 57% 28% 9%
∅ 0.44
Table 4.Results from analysis with visitor participation. Answers from additional questionsQ1. . .Q5.
mean med 1 2 3 4 5 n
Participants from lower secondary school(n=494)
Q1 4.35 4 1% 1% 6% 45% 46% 450 Q2 4.39 5 3% 3% 4% 29% 60% 92 Q3 2.52 2 10% 43% 30% 17% – 418 Q4 2.75 3 3% 32% 52% 12% – 450 Q5 3.84 4 1% 2% 25% 53% 18% 448 Participants from upper secondary school(n=142)
Competition
Narra tive
In
te
ra
ctiv ity
Ph ysical
User Control
Socia l
A ch
ievem
en
ts
Explo ration - -
-0 + ++
Figure 3.Engagement Opinion Diagram for Engineering Challenge; 494 participants; students from lower secondary school. The brown hatches represent the values between the 10% and the 90% percentiles; the orange lines represent the median of the visitor opinion.
Competition
Narra tive
In
te
ra
ctiv ity
Ph ysical
User Control
Socia l
A ch
ievem
en
ts
Explo ration - -
-0 + ++
messages that they want more competition (C), more physical activity (P), and, to some extent, more user control (U).
The upper secondary students seem to be more critical towards the game, as can be seen in Table4. While most of the upper secondary students seem to like the game, they are not so positive to recommend the game to other visitors.
As a last step, we add the median of the visitor opinion to the current values of the engagement profile. This is shown as the orange line in Figure2.
5. Discussion
Using the experiences from applying our novel design process to installations, we were able to show one iteration of this process. From this, we gained experiences about the design process as such, as well as valuable information about the installations used in our case studies.
5.1. Discussion of the Design Process
So far, we have evaluated one iteration of the design process only. As it is a method based on best practice, adjustments to the method and its tools have been applied, and more will be needed. According to our experience, the engagement profile seems to be suitable for the evaluation of installations.
The tool set used in the design process, as well as the statistical methods used, do not give fine-grained results. Instead the tools are suited to give hints on what to adjust when further developing an installation. Currently, we assume that it is enough to interpret the rather coarse results that point out only few characteristics that visitors want to have changed.
While we, currently, need a large number of visitors to create an Opinion Diagram, we anticipate that we can use a panel with fewer participants in the future.
As we see in the results from the questionnaires, the answers are on the positive side; this might have psychological reasons. For instance, it might be easier to consider elements that one would like more of than elements that one would like less of. However, it is too early to conclude whether and how this fact needs to be taken into account.
5.2. Discussion of Results from Engineering Challenge
In our study, the science centre vision and the designer intention were drawn post-opening, as was the evaluation step with visitors. Thus, the study can be used to get an indication of changes to the game that could increase engagement. The evaluation of the game gave the following indications, based on the fact that the game is mainly intended for students in lower secondary school:a) The visitors want a stronger competition element than currently offered. Increasing the competition element during the game could be challenging since this could interfere with the current way of voting for the best presentation. However, including an additional step with a quiz, e.g., Kahoot [24], could increase the competition factor.b) The visitors want more physical activity during the game than both science centre vision and designer intention suggested.c) The visitors want more user control, i.e., make decisions that have an influence on the course of the game. This is most evident for visitors from upper secondary schools which are not in the main target group.
As major changes to the game and the installations used during the game could be costly for Engineerium, the suggested changes need to be carefully considered, as the budget allows larger changes only if goals change, e.g., as a consequence of changes in the curriculum. The analysis shows that the game receives good reputation among the visitors. Adjustments like introducing an additional quiz to the learning game seem suitable to increase the competition element.
5.3. Discussion of Significance
We have indications that the visitor opinion is dependent on both the installation (or game) and the target group. Further studies with different engagement profile characteristics will be necessary to get further evidence for this.
As a further note, the evaluation of the visitor opinion shows that average of all eight dimensions is on the positive side with about 0.4. We need to investigate whether this is specific to the installation or is more an indicator for the engagement of the visitors. As a measure to avoid this bias to the positive side, we considered that the sum of the positive opinions should be forced to be close to 0. However, as we did not observe negative effects of this bias, we decided against this measure.
6. Conclusion
We have presented a novel design process for installations in science centres and museums. This design process has as a goal to increase the visitor engagement. The study performed at Engineerium shows promising results. Further, the study resulted in hints that are of value for Engineerium.
We are about to implement the graphical tool on an app to support the design process interactively. Further, tools to assess the visitor opinion with electronic questionnaires and analysis tools are under development.
Acknowledgments:The work presented here has been carried out in the project VISITORENGAGEMENTfunded by the Research Council of Norway in the BIA programme, grant number 228737. The authors thank Trenton Schulz for comments on earlier versions of the manuscript.
Author Contributions:W.L., I.T., G.J., M. de B., and S.R. conceived and designed the concept and the experiments; M. de B. and G.J. prepared the installations for the experiments; I.T. and S.R. performed the experiments; I.T. and W.L. analysed the data; W.L. and S.L. developed the graphical tool for the experience profile; W.L. and I.T. wrote the paper.
Conflicts of Interest:The experiments were performed at Engineerium where one of the authors (S.R.) is employed. The installations used in the experiments were developed by Expology where three of the authors (G.J., M. de B., and S.L.) are employed. Beyond these facts, the authors declare no conflict of interest.
Abbreviations
The following abbreviations are used in this manuscript:
VEI profile Visitor Engagement Installation profile
References
1. Leister, W.; Tjøstheim, I.; Joryd, G.; Schulz, T.; Larssen, A.; de Brisis, M. Assessing Visitor Engagement in Science Centres and Museums. Journal on Advances in Life Sciences2016,8, 49–63.
2. Tjøstheim, I.; Leister, W.; Larssen, A.; Schulz, T. The Role of Emotion and Enjoyment for QoE – a Case Study of a Science Centre Installation. Proc. QoMeX 2015, The 7th Intl. Workshop on Quality of Multimedia Experience; Skodras, A., Ed. IEEE, 2015, pp. 1–6.
3. Roppola, T.Designing for the museum visitor experience; Routledge New York, 2012; pp. xii, 321 pages :. 4. Doering, Z.D.; Watriss, W.; Pekarik, A.; DiGiacomo, K.; Kaufmann, C.; others. The Making of Exhibitions:
Purpose, Structure, Roles and Process. white paper, Smithsonian Institution, 2002.
5. Bitgood, S. Designing Effective Exhibits: Criteria for Success, Exhibit Design Approaches, and Research Strategies. Visitor Behaviour1994,IX, 4–15.
6. Skolnick, L.H.; Marwit, D.; Secor, J.A. Exhibition Design. InEncyclopedia of Library and Information Sciences, Third Edition; CRC Press, 2009; pp. 1797–1807.
7. Lin, C.H. Mapping the Design Criterion Framework for Museum Exhibition Design Project. Undisciplined! Design Research Society Conference 2008; Sheffield Hallam University, , 2008.
8. Young, D.L. A phenomenological investigation of science center exhibition developers’ expertise development. PhD thesis, The University of North Carolina at Chapel Hill, 2012. 174 pages.
10. Fraser, S.; Beck, K.; Caputo, B.; Mackinnon, T.; Newkirk, J.; Poole, C. Test Driven Development (TDD). Proc. 4th Int’l Conf. on Extreme Programming and Agile Processes in Software Engineering; Springer-Verlag: Berlin, Heidelberg, 2003; XP’03, pp. 459–462.
11. ISO 9241-210:2010. Ergonomics of human-system interaction – Part 210: Human-centred design for interactive systems. international standard, ISO, 2010.
12. Pierroux, P.; Steier, R. Making it Real: Transforming a University and Museum Research Collaboration into a Design Product. InDesign as Scholarship in the Learning Sciences; Svihla, V.; Reeve, R., Eds.; Routledge: London, 2016; chapter 9, pp. 115–126.
13. Yoshimura, Y.; Sobolevsky, S.; Ratti, C.; Girardin, F.; Carrascal, J.P.; Blat, J.; Sinatra, R. An analysis of visitors’ behavior in The Louvre Museum: a study using Bluetooth data.Environment and Planning B2014. 14. Spegel, D. Expogon, 2014.
15. Schrandt, B. Designing Experiencescapes. poster session: Designing for emotion: impact and evaluation, ECSITE, 2017.
16. Dierking, L.D.; Falk, J.H. Redefining the museum experience: the interactive experience model. Visitor Studies1992,4, 173–176.
17. Falk, J. Viewing the Museum Experience through an Identity Lens. InVisiting the Visitor: An Enquiry Into the Visitor Business in Museums; Davis, A.; Smeds, K., Eds.; transkript Verlag, 2016; pp. 71–88.
18. Falk, J.; Storksdieck, M. Using the contextual model of learning to understand visitor learning from a science center exhibition.Science Education2005,89, 744–778.
19. Tomiuc, A. Navigating Culture. Enhancing Visitor Museum Experience through Mobile Technologies. From Smartphone to Google Glass. J Media Research2014,7, 33.
20. Kolb, D.A.Experiential Learning as the Science of Learning and Development; Prentice Hall: Englewood Cliffs, NJ, 1984.
21. Kolb, D.A.; Kolb, A.Y. The Kolb Learning Style Inventory 4.0: Guide to Theory, Psychometrics, Research & Applications; Experience Based Learning Systems, 2013.
22. Manolis, C.; Burns, D.J.; Assudani, R.; Chinta, R. Assessing experiential learning styles: A methodological reconstruction and validation of the Kolb Learning Style Inventory.Learning and Individual Differences2013, 23, 44 – 52.
23. Leister, W.; Aursand, P.; Tjøstheim, I.; Lauritzsen, S.; Joryd, G. The Graphical Expression of the Visitor Engagement Installation (VEI) Profile Revisited.Norsigd Info2017, pp. 9–10.