Progress in ITER ECE Diagnostic Design and Integration
V.S. Udintsev1,*, S. Danani2, G. Taylor3, T. Giacomin1, J. Guirao1, S. Pak1, S. Hughes1, L. Worth1, G. Vayakis1,
M.J. Walsh1, M. Schneider1, H.K.B. Pandya2, R. Kumar2, V. Kumar2, S. Jha2, S. Thomas4, S. B. Padasalagi2, S. Kumar2, P. E. Phillips4, W. L. Rowan4, M.E. Austin4, A. Khodak3, R. Feder3, H. Neilson3, A. Basile3, A. E. Hubbard5, A. Saxena6, C. Nazare6, P. Maquet7, N. Gimbert7
1
ITER Organization, Route de Vinon-sur-Verdon, CS 90 046, 13067 St. Paul Lez Durance Cedex, France
2
ITER-India, Institute for Plasma Research, Bhat, Gandhinagar-382 428, India
3
Princeton Plasma Physics Laboratory, Princeton, NJ 08543, USA
4
Institute for Fusion Studies, University of Texas at Austin, TX 78712, USA
5 Plasma Science and Fusion Center, MIT, Cambridge, MA 02139, USA 6
Fircroft France, 4 rue du Bailliage, 78000 Versailles, France
7Bertin Technologies, 155 rue Louis Armand, CS 30495, 13593 Aix-en-Provence Cedex 3, France
Abstract. The ITER Electron Cyclotron Emission (ECE) diagnostic is progressing towards its Preliminary Design Review (PDR). In parallel, the diagnostic integration in the Equatorial Port is ongoing. Port Integration has to address the structural integrity to withstand various loads, maintenance and the safety aspects of ECE diagnostic. The ITER ECE system includes radial and oblique lines-of-sight. Recently, a successful peer-review of the in-port plug Hot Calibration Source has taken place and its performance and integration feasibility has been demonstrated. Four 45-meter long low-loss transmission lines are designed to transmit mm-wave power in the frequency range of 70- 1000 GHz in both X- and O-mode polarization from the port plug to the ECE instrumentation room in the diagnostic building. Prototype transmission lines are being tested [1]. A prototype polarizing Martin-Puplett type Fourier Transform Spectrometer (FTS) operating in the frequency range 70-1000 GHz, has a fast scanning mechanism and a cryo-cooled dual-channel THz detector system. Its performance has been tested as per ITER requirements. Assessment of the instrumentation and control requirements, functional and non-functional requirements, operation procedures, plant automation are ongoing for the PDR. The current status of the diagnostic, together with integration activities, is presented.
1 Introduction
The Electron Cyclotron Emission (ECE) diagnostic design in ITER has to address the specifications defined in the project measurement requirements. Several requirements are specified with different spatial, temporal and spectral resolution and accuracy. Even for the same measurement, the electron temperature profile, the ECE measurement requirements can be different for advanced machine control and for physics. The relativistic downshift at high temperatures, which in ITER is substantial, will strongly influence the access to the plasma for ECE. Integrated performance for the temperature measurement is, however, adequate when all electron temperature (Te) systems (ECE and two
Thomson scattering systems) are considered together [2]. A prioritization has been given to the core electron temperature measurement and to Neoclassical Tearing Modes (NTMs) detection [3, 4]. For the temperature perturbation caused by NTMs, ECE is the only diagnostic that can deliver this measurement. There is a functional requirement for the broadband measurement system to measure the total radiated power due to ECE.
The specified frequency for the broadband measuring system is from 70 GHz up to 1 THz. The design should take into account the physics and technical constraints that may affect, on one hand, the layout of the transmission line and the back-end instrumentation and, on the other hand, the performance of the system for priority measurements, such as the core electron temperature profile and the NTM amplitude and localization.
This paper updates the status of ITER ECE design and discusses current and future activities.
2 ITER ECE requirements
As stated in the ITER Project Requirements, the measurements shall be delivered by the suitable set of diagnostics with certain spatial and temporal resolution and accuracy. Clearly, depending on the physical principles of each diagnostic, some systems are more appropriate for a particular measurement than others. ECE has a primary role (which means that it is well suited to the measurement) in the delivery of the core electron temperature profile and detection of NTMs (δT/Te; 100 ms integration time). The system has a backup role (which means it provides similar data to primary role, but has some limitations) in the measurement of pedestal in the H-mode, Edge Localized Modes (ELMs) and L-H mode transition indicator. The ECE diagnostic has a supplementary role (which means that diagnostic validates or calibrates the measurement, but is not complete in itself) in the delivery of plasma energy, radiated power, runaway electrons, edge electron temperature profile and high frequency instabilities (i.e. TAEs δT/T).
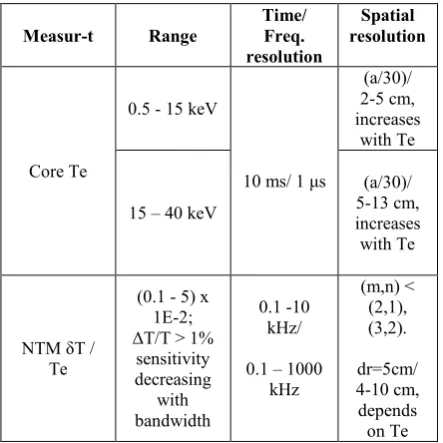
Based on the measurement requirements, a prioritization analysis and flow-down has been performed using a limited set of criteria, to establish diagnostic measurement specifications. Prioritization is important in establishing a focus for development of a system design as well as accommodating constraints set by physics and integration limitations. It should be noted that assessments were performed for both the early lower performance operating phase, as well as for operation during the planned Q = 5 to10 burning plasma phase. Table 1 gives an overview of specifications for primary role measurements after the completion of requirements flow-down.
The spatial resolution required for electron temperature profiles is specified at 67 mm (or a/30); however, depending on the plasma parameters and physical principles, some diagnostics that measure Te may provide better or worse values. For core electron temperature profile measurement by ECE, the high temperatures foreseen in ITER (30 – 40 keV) will affect the spatial resolution, due to the large relativistic and Doppler broadening, which will lead to a widening of the radial extension from which a given frequency in the ECE spectrum is emitted. It should be noted that the target of a/30 would be possible only in regions with a low enough value of Te (typically r/a > 0.5 for Te(0) = 30 keV on ITER). The relativistic downshift at the high temperatures in ITER is substantial and will strongly limit the access to the plasma. It is important to remark that the high temperature scenarios considered for ITER (Te(0) up to 40 keV) will degrade the spatial resolution of Te due to a further widening of the emission layer. Further methods to improve spatial resolution of the diagnostic by deconvolution will be investigated in coming years as a part of diagnostic performance
assessment. It is also advisable to get some support from ECE diagnostics in operating fusion devices to testify the applicability of methods to enhance the spatial resolution at higher Te.
Table 1. Expanded table of ITER ECE diagnostic specifications for primary role requirements.
Measur-t Range
Time/ Freq. resolution Spatial resolution Core Te
0.5 - 15 keV
10 ms/ 1 μs
(a/30)/ 2-5 cm, increases
with Te
15 – 40 keV
(a/30)/ 5-13 cm, increases with Te
NTM δT / Te
(0.1 - 5) x 1E-2; ΔT/T > 1%
sensitivity decreasing with bandwidth 0.1 -10 kHz/
0.1 – 1000 kHz (m,n) < (2,1), (3,2). dr=5cm/ 4-10 cm, depends on Te
ECE will play a key role in the targeting of the Electron Cyclotron Heating (ECH) to control neoclassical tearing modes (NTMs). The ECH deposition widths for the NTM stabilization are in the range of 30 – 70 mm. An island with the width of w > 20 mm is detectable by ITER ECE (Fig. 1). Thus, assumption for ECE channel separation of 20 mm or smaller at NTM radii is adequate for the mode detection and localization. The response time of the feedback system once the mode is tracked is in the order of tens of ms. It is anticipated that it will take about 20 ms to begin moving the ECH steering mirror and then some time to lock onto the mode. The total response time might be 30 – 50 ms or even longer to lock onto the mode and begin suppressing it with Electron Cyclotron Current Drive (ECCD), depending on how far the mode rational surface is away from where the mirror is pointing at the time. The growth time of the NTM is of the order of 100 ms, and the target resolution of the diagnostic expressed in terms of sampling rate could be in the range of 0.1 – 1000 kHz. Response to the NTM in ECE measurements is limited by the intrinsic resolution of the instrument that includes the relativistic broadening and the antenna pattern. Also, the signal-to-noise ratio limits the minimum island size to about 2 cm for a dTe/Te ~1%. The latency needed for the NTM
employed to enhance the signals relative to the noise. This is a technique that has been proven to be efficient in other tokamaks where NTM detection and stabilization is routinely performed [5].
Fig. 1. Expected ΔTe/Te from rotating MHD islands. Correlation technique could be used to get even better resolution. Note: ITER plasma major radius is 6.2 m.
Details of backup and supplementary measurements and their specifications for ITER ECE are given in [3] and are not being repeated here.
3
Diagnostic instrumentation
To enable measurements discussed in the previous section, the following design and instrumentation are being designed:
Two lines-of-sight from Equatorial Port #9; one perpendicular and another oblique at ~10 degrees (used for redundancy in primary measurements and also for non-thermal electron population detection);
Frequency coverage: 70 GHz – 1000 GHz; both X- and O-modes; ensured by polarization splitters near the port plug
One 2X-mode radiometer, 220 – 340 GHz, and one 1O-mode radiometer, 122 – 230 GHz -> @ Bt = 5.3 T;
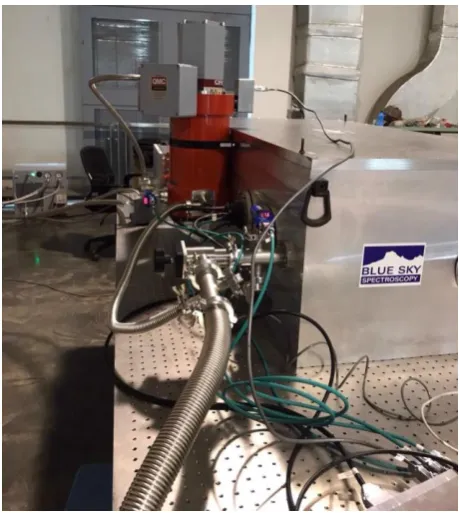
Two, high throughput, reciprocating Martin-Puplett Fourier Transform Spectrometers, 70-1000 GHz, a frequency resolution ≤ 5 GHz, instrument transmittance > 70 % and a scanning repetition rate ≤ 20 ms.
Figure 2 shows the prototype Polarizing Fourier Transform Spectrometer (FTS) developed and tested at ITER-India Lab and supplied by the Blue Sky Spectroscopy. The tests are ongoing; parameters already achieved are quite close to the measurement
specifications for FTS instruments planned to be used in ITER during operation.
Fig. 2. Prototype Polarizing Fourier Transform Spectrometer being tested at ITER-India Lab.
4
Operations at 1.8 T
There are several stages for ITER operations currently assumed. Recently, the ITER research plan [6] has been modified to include the option of operation at 1.8 T. The exploitation of this option offers the possibility of access to H-mode operation at lower injected powers, implying that H-modes (and ELM control) may be studied at an early stage of the research program where the available levels of heating power will be lower than the baseline of 73 MW. ITER ECE diagnostic performance has been assessed for compatibility with 1.8 T operations. As an input, the data was provided for He- H-modes with a magnetic equilibrium, EQDSK file representing an ITER plasma at 1.8T along with electron density (ne) and Te profiles coming from the METIS 0.5D transport code [7] and from the ASTRA code for the L-mode [8]. The GENRAY ray tracing code was used to simulate ECE. Figure 3 shows a plot of ECE frequencies, multiple harmonics, versus major radius for the 1.8 T case. The low frequency radiometer (115-220 GHz) would be able to measure the low-field-side Te profile with 3rd harmonic frequencies. However, the best coverage in terms of spatial resolution would be for the 2nd harmonic
radiometer as such has limited capability to measure at 1.8 T. Although 3rd harmonic X-mode profile
measurement is possible with current instruments, a better coverage with better spatial resolution can be ensured with the 2nd harmonic X-mode ECE. If the system will be needed to operate at 1.8 T magnetic field, a radiometer instrument for 2nd harmonic X-mode (75 –
120 GHz) will have to be developed to ensure Te measurements with better resolution, including the pedestal region. The 75-120 GHz coverage would be implemented by replacing the RF section of the 220-340 GHz radiometer, using the same IF and video bands as the 220-340 GHz radiometer.
Fig. 3. Simulated frequencies and radial coverage by presently designed radiometers for 1.8 T ECE operation assuming recent METIS 0.5D kinetic profiles for Te and ne.
5
Integration
in
the
tokamak
infrastructure
ECE diagnostic integration in the tokamak is interfacing with port infrastructure, buildings and services, such as vacuum, electrical and remote handling. The general layout of ECE system is shown in Fig. 4. Many components are located in the inner, Port Interspace and outer, Cell, areas. These two areas of the Port Cell are radiation zones with substantially different (~ factor of 10) exposure levels but common atmosphere. The design of the diagnostic has to make a provision for minimizing worker’s presence there for maintenance operations.
Various parts of ITER ECE systems will experience different load conditions, arising from electromagnetic events (during disruption), thermal and neutronic heating, and seismic events. There are other accidental loading cases, such as fire hazard in the port cell or gallery, which have to be taken into account during design, too. Finally, ECE in ITER has to be protected from microwave stray radiation by the ECH installation
(170 GHz) and by other millimeter wave emission, like Collective Thomson scattering, planned to operate at 60 GHz.
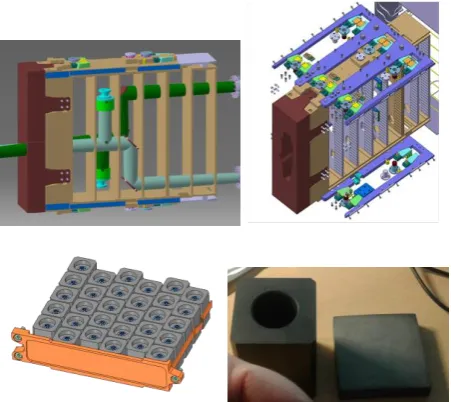
The diagnostic front-end is being currently integrated in Equatorial Port #9. Integration is compatible with the latest modular Diagnostic Shield Module (DSM) design that is proven to provide the required neutron shielding performance and fulfil maintenance requirements. The ECE front end is fixed on the vertical plates as shown in Fig. 5 and is surrounded by Boron Carbide (B4C) blocks for neutron absorption, which reduces the Shutdown Dose Rate (SDDR) on the port closure plate and in the Port Interspace - Port Cell. Work is continuing together with integration of the port itself with other tenant diagnostics in the same port.
Fig. 4. Schematic layout of the ITER ECE diagnostic from port plug to the tokamak building boundary.
Fig. 5. Integration of ECE front-end in the modular DSM (top row; different colors represent two different lines-of-sight); B4C shielding trays and single units to stop neutrons (bottom row).
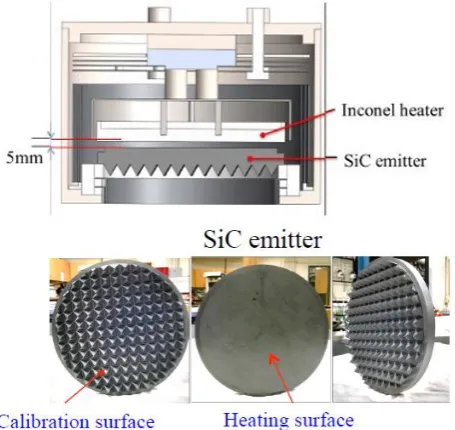
like steam/ water leak event compatibility, are still ongoing. The heated Silicon Carbide (SiC) emitter has reached the temperature > 700 C in the test prototype, and outgassing tests in vacuum have demonstrated compliance with ITER requirements. Figure 6 shows the prototype test layout provided by the US ECE Team. The design of the shutter/ switchable mirror to orient the ECE beam towards the plasma or towards the Hot Calibration source is still being developed; a few concepts ranging from mechanical rod actuators to a piezoelectric motor were considered. More development work is expected in the coming months for the design and integration of the shutter mirror; also, integration of lessons learned about ECE shutters operation from existing machines would be beneficial.
Fig. 6. Hot Calibration Source basic design (top) and SiC emitter (bottom).
The development of the primary diagnostic window assemblies for ECE (Fig. 7) is progressing towards the Final Design. Lessons learned during the Preliminary Design phase indicate that windows design must be updated to be fully compliant with structural and performance needs and to fulfil safety requirements. It is important to ensure that no additional loads or stresses on the primary windows are introduced by the compliance seal box located on the atmospheric side of the port closure plate next to the window assemblies, but not reacting on windows mechanically.
Fig. 7. The ECE primary window design (left) and a typical window assembly prototype (right).
The design is being considered to avoid excessive loading of the window assembly. In parallel, several prototyping/ Research and Development (R&D) activities are being undertaken to demonstrate the feasibility of novel window assemblies design in ITER, or to validate specific features of the design.
Transmission lines outside the port plug are integrated in the port interspace and port cell support structures and routed through the gallery and building penetrations to the dedicated area in the diagnostic building where back-end instrumentation is installed. The transmission lines are then safety important as they contribute to the tritium confinement as a secondary barrier of the tokamak infrastructure. Waveguides are attached to the supports connected to embedded plates in the ceiling of the building. The design of supports is entering its final phase, and it is being in close collaboration with ITER construction team; the completion of installation of captive supports is a priority task to be completed to ensure that the building’ infrastructure is ready for the First Plasma operations in ITER, even if ECE is not meant to be operational for the First Plasma. Figure 8 shows the layout of the ECE transmission lines and their supports in the tokamak building complex.
Fig. 8. Ex-Port Plug transmission lines layout and zoon into the waveguide supports attached to the ceiling of the tokamak building.
6
Ongoing
R&D
activities
on
transmission lines characterization
over the entire range from 70 GHz to 1000 GHz is still usable for all planned measurements to meet requirements for the transmission line in air and with corrugated transmission lines, it would be beneficial to use passive secondary windows at the building boundaries, instead of valves with safety control function. This would also avoid excessive loading of the primary window assemblies at the closure plate due to the absence of the rough vacuum on the glass material from the interspace side.
The test setup is shown in Fig. 9. The first results are presented in [1]. It is planned to complete these studies in 2018 and to make the final decision on the transmission line layout for the Preliminary Design of ECE ex-port plug part.
Fig. 9. Transmission line mock-up at ITER India [1].
7 Summary
Development of the ITER ECE is progressing well towards its Preliminary Design Review. The R&D and Peer Review of the Hot Calibration Source have been completed; however, important design work on shutter design remains open. Integration work related to port infrastructure is ongoing; integration in the tokamak buildings is also important in order to meet construction need-dates for ECE transmission line captive supports. R&D to characterize the transmission lines outside the port plug and to finalize its layout is ongoing to ensure the maximum diagnostic performance while complying with safety requirements. Finally, future work to improve the spatial resolution of the system at higher Te by applying numerical methods and support from ECE diagnostics in operating fusion devices to test the applicability of methods to enhance the spatial resolution at higher Te would be very helpful.
The views and opinions expressed herein do not necessarily reflect those of the ITER Organization.
References
1. R. Kumar et al., "Comparative studies of various types of transmission lines in the frequency range 70 GHz -1 THz for ITER ECE diagnostic", this Workshop.
2. V.S. Udintsev et al., Fusion Engineering and Design, Volume 88 (6) (2013)
3. V.S. Udintsev et al., "Exploring measurement capabilities of ITER ECE system." Proc. FEC (San Diego) IAEA-CN-197/ITR/P5-41 (2012)
4. G. Taylor et al., in Proc. of EC-19 Workshop, Ahmedabad, India (2016)
5. F. Felici et al., Integrated real-time control of MHD instabilities using multi-beam ECRH/ECCD systems on TCV, Nuclear Fusion, 52(7):074001 (2012) 6. ITER Technical Report ITR-18-003
7. J.F. Artaud et al., in Proc. of the 32nd EPS Conf. on Control. Fusion and Plasma Phys., ECA Vol. 29C, P1.035 (2005)
![Fig. 9. Transmission line mock-up at ITER India [1].](https://thumb-us.123doks.com/thumbv2/123dok_us/8018372.1333416/6.595.57.285.255.385/fig-transmission-line-mock-iter-india.webp)
