Jagani N. M.*, Prajapati V. D., Shah J. S., Patel P. B.
Department of Quality Assurance, S. J. Thakkar Pharmacy College, Rajkot-360005, Gujarat, India.
Accepted on: 29-05-2012; Finalized on: 31-07-2012. ABSTRACT
A reverse phase high performance liquid chromatography (RP-HPLC) method for the simultaneous estimation of Cinitapride Hydrogen Tartrate (CNT) and Omeprazole (OMP) in combined capsule dosage form was developed and validated. The determination was carried out on a Lichrospher® 100, RP-18e (5 µm), Merck Ltd., India, 250 mm L × 4.6 mm in size column using mobile phase in gradient mode as Methanol: Water (95: 05 v/v). The flow rate was 1.2 ml/min with detection wavelength at 276 nm. The retention time for OMP was 1.978 and for CNT was 3.325 min. CNT and OMP showed a linear response in the concentration range of 0.75-3.75 µg/ml and 5-25 µg/ml respectively. The correlation coefficient r2=0.9993 for CNT and r2=0.9990 for OMP. The results of analysis have been validated statistically and by recovery studies. The average percentage recoveries obtained for CNT and OMP was found to be 98.97% and 99.22% respectively.
Keywords: RP-HPLC, Cinitapride hydrogen tartrate, Omeprazole.
INTRODUCTION
Day to day numbers of newer drugs and their formulations either in single or in combined dosage forms were marketed. Combination of CNT and OMP was approved in 12th May - 2010 by CDSCO India & manufactured and marketed by Zydus Cadila Healthcare as Burpex capsule (20 mg OMP and 3 mg CNT). Combination is used in treatment of gastric ulcer, gastro esophageal reflux disease (GERD) & Dyspepsia not responding to OMP alone.
OMP is substituted Benzimidazole, (RS)-6-methoxy-2-((4-methoxy-3,5dimethylpyridin-2-yl) methylsulfinyl)-1H-benzoimidazole (Figure 1) that function as proton pump inhibitor. It is anti-secretory drug effective for rapid healing peptic ulcer and corrosive esophagitis.1-6 CNT is Benzamide class of drug, 4–Amino–N-[1-(3cyclohexen-1-ylmethyl)-4-piperidinyl]-2-ethoxy-5-nitrobenzamide Hydrogen L-(+)-tartrate (Figure 2) that function as pro-kinetic agent and antiemetic.7,8
Figure 1: Chemical Structure of OMP
Figure 2: Chemical Structure of CNT
OMP is official in Indian Pharmacopoeia, British Pharmacopoeia, U.S. Pharmacopoeia9-11 while CNT is not official in any pharmacopoeia. Deep literature survey reveals that numbers of analytical methods are reported for the estimation of OMP and CNT in single dosage forms. Reported methods for estimation of OMP are RP-HPLC12-17, LC-MS18-20, Spectrophotometry21-23, Spectrofluometry24 and similarly for estimation of Cinitapride are RP-HPLC25-27, LC-MS28, HPTLC29, Spectrophotometry30, Colorimetric assay31-33 and Area Under Curve method.34
We could not trace reverse phase high performance liquid chromatography method for the estimation of these two drugs in combined dosage forms. So, the rational of work is to develop and validate simple, sensitive, specific, accurate and precise RP-HPLC method for the estimation of these two drugs in combined capsule dosage form.
MATERIALS AND METHODS
Apparatus and Instruments
HPLC: Make & Model: Young - Linn Clarity 9100 HPLC System
Degasser: Vacuum Degasser YL – 9101 Pump: Quaternary Pump YL – 9110 Detector: PDA detector YL – 9160
Column: Lichrospher® 100, RP-18e (5 µm), Merck Ltd., India, 250 mm L × 4.6 mm in size
Temperature: Ambient Pressure: 1000 - 3000 psi
Double beam UV-visible spectrophotometer (Shimadzu, Model 1800) having two matched quartz cells with 1 cm light path
DEVELOPMENT AND VALIDATION OF REVERSE PHASE HIGH PERFORMANCE LIQUID CHROMATOGRAPHY METHOD FOR SIMULTANEOUS ESTIMATION OF CINITAPRIDE AND OMEPRAZOLE IN COMBINED CAPSULE DOSAGE FORM
International Journal of Pharmaceutical Sciences Review and Research Page 36 Electronic analytical balance, Shimadzu AUX-220
Ultrasonicator
Borosilicate Volumetric flask – 10, 25, 50, 100 ml Borosilicate Pipettes – 1, 2, 5, 10 ml
All instruments and glass wares were calibrated. Reagents and Standards
Omeprazole IP (Gift sample – Sunrise Remedies Pvt. Ltd, Ahmedabad)
Cinitapride Hydrogen Tartrate (Gift sample – Zydus Cadila Health Care, Ahmedabad)
Combined capsule formulations (BURPEX) were procured from Indian market.
Methanol for Chromatography Lichrosolv® (Merck Pvt. Ltd., Mumbai)
Water for Chromatography Lichrosolv® (Merck Pvt. Ltd., Mumbai)
Sartorius Filter Paper 0.2 micron (Sartorius, Germany) Method
Selection of Analytical Wavelength
The standard solutions of CNT (10 µg/ml) and OMP (10 µg/ml) in Methanol were scanned separately in the UV region of 200 to 400 nm and the overlain spectra were recorded. Isoabsorptive point at 276 nm which is selected as wavelength for measurement in HPLC, depicted in Figure 3.
Figure 3: Overlay UV spectra of CNT (10 µg/ml) and OMP (10 µg/ml) in Methanol
Preparation of Standard Solutions
Preparation of CNT standard solution
Accurately weighed quantity of CNT 50 mg was transferred into 50 ml volumetric flask, dissolved and
diluted up to the mark with methanol to give a stock solution having strength of 1000 µg/ml. Pipette out 5 ml of solution from 1000 µg/ml stock solution and transfer into 50 ml volumetric flask and diluted up to the mark with methanol to give a working standard solution having strength of 100 µg/ml.
Preparation of OMP standard solution
Accurately weighed quantity of OMP 50 mg was transferred into 50 ml volumetric flask, dissolved and diluted up to the mark with methanol to give a stock solution having strength of 1000 µg/ml. Pipette out 5 ml of solution from 1000 µg/ml stock solution and transfer into 50 ml volumetric flask and diluted up to the mark with methanol to give a working standard solution having strength of 100 µg/ml.
Chromatographic Conditions
HPLC Model : Young - Linn Clarity 9100 HPLC System
Stationary Phase : Lichrospher® 100, RP-18e (5 µm), Merck Ltd., India, 250 mm L × 4.6 mm in size
Mobile Phase : Methanol: Water (95:05 v/v) Flow rate : 1.2 ml/min
Detection Wavelength
: 276 nm Temperature : Ambient Run time : 8 minutes Injection volume : 20 µl Preparation of Calibration Curves
Pipette out 5 ml of the working standard solution of CNT (100 µg/ml) diluted up to 50 ml, from this 0.75, 1.5, 2.25, 3 and 3.75 ml was transferred into a series of 10 ml volumetric flasks, to this working standard solution of OMP 0.5, 1.0, 1.5, 2.0 and 2.5 ml was transferred and diluted up to the mark with mobile phase (methanol: water 95:5 v/v). Thus final solutions of mixture of CNT and OMP obtained contain 0.75 & 5 µg/ml, 1.5 & 10 µg/ml, 2.25 & 15 µg/ml, 3 & 20 µg/ml and 3.75 & 25 µg/ml respectively. The solutions were injected using Rhenodyne Injector (Fixed Capacity Loop of 20 µl) and chromatograms were recorded. Then, calibration curves were constructed by plotting peak area against concentration of the drug to construct two separate calibration curves for both the drugs.
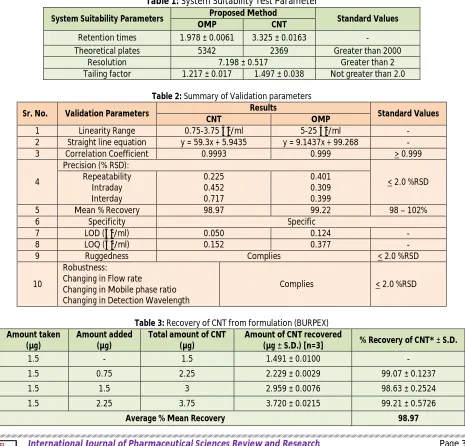
System Suitability Test
Observed values of Resolution, Column efficiency, Tailing factor were depicted in Table 1.
Analytical method validation
Validation of developed method was carried out as per ICH Q2 R1 guideline.35 Parameters such as Linearity,
Accuracy, Precision, Specificity, LOD, LOQ, Ruggedness and Robustness were taken up as tests for analytical method validation.
Linearity and Range
Precision
The intraday precision of the developed method was evaluated by analyzing combined samples of different concentrations of CNT and OMP three times on the same day and %RSD was calculated. The inter day precision was evaluated by analyzing combined samples of different concentrations of CNT and OMP on three different days and %RSD was calculated. Repeatability was evaluated by combined standard solutions of CNT (3 µg/ml) and OMP (20 µg/ml) were prepared and analyzed six time on the same day and %RSD was calculated. Results obtained are shown in Table 2.
Accuracy
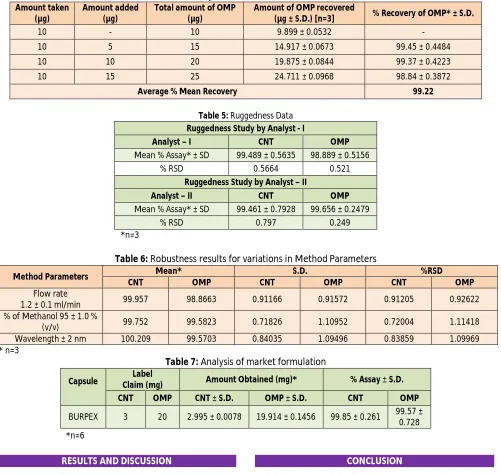
Accuracy of the method was confirmed by recovery study from marketed formulation at three level of standard addition from 50 % to 150 % of label claim. The results are shown in Table 3 and 4. Recovery greater than 98% with low SD justifies the accuracy of the method.
Figure 4: Calibration curve for CNT in Methanol: Water (95: 05 v/v)
Figure 5: Calibration curve for OMP in Methanol: Water (95: 05 v/v)
Figure 6: Chromatogram of calibration curve for CNT (0.75-3.75 µg/ml) and OMP (5-25 µg/ml)
Figure 7: 3D view of Chromatogram of calibration curve for CNT (0.75-3.75 µg/ml) and OMP (5-25 µg/ml)
Specificity
Specificity is the ability to assess unequivocally the analyte in the presence of components that may be expected to be present. Typically, these might include impurities, degrades etc. A solution of placebo in mobile phase was injected and the chromatogram showed no inferring peaks at retention time of the two drugs. The chromatogram of placebo were compared with those acquired from CNT and OMP standards, correlation was good (in terms of tR and area) indicates the specificity of
method. Chromatograms of specificity for CNT and OMP depicted in Figure 8 to 10.
Figure 8: Specificity Chromatogram of Blank Placebo in Methanol: Water (95: 05 v/v)
Figure 9: Specificity Chromatogram of standard CNT (3 µg/ml)
Figure 10: Specificity Chromatogram of standard OMP (20 µg/ml)
y = 59.3x + 5.9435 r² = 0.9993
0 50 100 150 200 250
0 1 2 3 4
P
e
ak
Ar
e
a
(m
V
.s
)
Conc. in µg/ml
y = 9.1437x + 99.268 r² = 0.9990
0 50 100 150 200 250 300 350
0 10 20 30
P
e
ak
a
re
a
(m
V
.s
)
International Journal of Pharmaceutical Sciences Review and Research Page 38
LOD and LOQ
Calibration curve of mixture was repeated for 5 times and the standard deviation (SD) of the intercepts was calculated. Then LOD and LOQ were calculated as follows. LOD=3.3 * SD/slope of calibration curve,
LOQ=10 * SD/slope of calibration curve. Where, SD = Standard deviation of intercepts Results obtained are shown in Table 2.
Ruggedness
Ruggedness of the proposed method was determined by analysis of aliquots of sample solution (3 µg/ml CNT and 20 µg/ml OMP) by two analyst using same operational and environmental conditions. Results obtained are shown in Table 5.
Robustness
The Robustness of the method was evaluated by
A) By changing the flow rate by 1.2 ± 0.1 ml/min (1.1 ml/min and 1.3 ml/min).
B) By changing mobile phase ratio by 95 ± 1.0 % (94 and 96 %) for methanol
C) By changing detection wavelength by ± 2 nm (274 nm and 278 nm).
Results obtained are shown in Table 6.
Analysis of marketed formulation by proposed method
Twenty capsules were weighed and average weight of content was determined & the content of capsules was powdered. The powder equivalent to 20 mg of OMP or 3 mg of CNT was transferred in to a 50 ml volumetric flask, dissolved and diluted up to the mark with methanol. The solution was filtered through Sartorius filter paper (0.2 µ). An aliquots of 0.5 ml of this solution was diluted to 10 ml with mobile phase six times.
Each solution was injected using Rhenodyne Injector (Fixed Capacity Loop of 20 µl) and chromatograms were recorded. The peak area of each chromatogram was determined. The concentration of each drug was calculated using calibration curve equation.
The results obtained are shown in Table 7. Table 1: System Suitability Test Parameter
System Suitability Parameters Proposed Method Standard Values
OMP CNT
Retention times 1.978 ± 0.0061 3.325 ± 0.0163 - Theoretical plates 5342 2369 Greater than 2000
Resolution 7.198 ± 0.517 Greater than 2
Tailing factor 1.217 ± 0.017 1.497 ± 0.038 Not greater than 2.0
Table 2: Summary of Validation parameters
Sr. No. Validation Parameters Results Standard Values
CNT OMP
1 Linearity Range 0.75-3.75 µg/ml 5-25 µg/ml -
2 Straight line equation y = 59.3x + 5.9435 y = 9.1437x + 99.268 -
3 Correlation Coefficient 0.9993 0.999 > 0.999
4
Precision (% RSD):
< 2.0 %RSD Repeatability
Intraday Interday
0.225 0.452 0.717
0.401 0.309 0.399
5 Mean % Recovery 98.97 99.22 98 – 102%
6 Specificity Specific
7 LOD (µg/ml) 0.050 0.124 -
8 LOQ (µg/ml) 0.152 0.377 -
9 Ruggedness Complies < 2.0 %RSD
10
Robustness:
Changing in Flow rate
Changing in Mobile phase ratio Changing in Detection Wavelength
Complies < 2.0 %RSD
Table 3: Recovery of CNT from formulation (BURPEX) Amount taken
(µg)
Amount added (µg)
Total amount of CNT (µg)
Amount of CNT recovered
(µg ± S.D.) [n=3] % Recovery of CNT* ± S.D.
1.5 - 1.5 1.491 ± 0.0100 -
1.5 0.75 2.25 2.229 ± 0.0029 99.07 ± 0.1237
1.5 1.5 3 2.959 ± 0.0076 98.63 ± 0.2524
1.5 2.25 3.75 3.720 ± 0.0215 99.21 ± 0.5726
Table 4: Recovery of OMP from formulation (BURPEX) Amount taken
(µg)
Amount added (µg)
Total amount of OMP (µg)
Amount of OMP recovered
(µg ± S.D.) [n=3] % Recovery of OMP* ± S.D.
10 - 10 9.899 ± 0.0532 -
10 5 15 14.917 ± 0.0673 99.45 ± 0.4484
10 10 20 19.875 ± 0.0844 99.37 ± 0.4223
10 15 25 24.711 ± 0.0968 98.84 ± 0.3872
Average % Mean Recovery 99.22
Table 5: Ruggedness Data Ruggedness Study by Analyst - I
Analyst – I CNT OMP
Mean % Assay* ± SD 99.489 ± 0.5635 98.889 ± 0.5156
% RSD 0.5664 0.521
Ruggedness Study by Analyst – II
Analyst – II CNT OMP
Mean % Assay* ± SD 99.461 ± 0.7928 99.656 ± 0.2479
% RSD 0.797 0.249
*n=3
Table 6: Robustness results for variations in Method Parameters
Method Parameters Mean* S.D. %RSD
CNT OMP CNT OMP CNT OMP
Flow rate
1.2 ± 0.1 ml/min 99.957 98.8663 0.91166 0.91572 0.91205 0.92622 % of Methanol 95 ± 1.0 %
(v/v) 99.752 99.5823 0.71826 1.10952 0.72004 1.11418
Wavelength ± 2 nm 100.209 99.5703 0.84035 1.09496 0.83859 1.09969 * n=3
Table 7: Analysis of market formulation
Capsule Claim (mg) Label Amount Obtained (mg)* % Assay ± S.D.
CNT OMP CNT ± S.D. OMP ± S.D. CNT OMP
BURPEX 3 20 2.995 ± 0.0078 19.914 ± 0.1456 99.85 ± 0.261 99.57 ± 0.728 *n=6
RESULTS AND DISCUSSION
A simple, specific, accurate and precise RP-HPLC method has been developed and validated for simultaneous estimation of both these drugs. The chromatographic separation was achieved on Lichrospher® 100, RP-18e (5 µm), Merck Ltd., India, 250 mm L × 4.6 mm in size column using Methanol: Water (95: 05 v/v) as mobile phase at 276 nm. RP-HPLC method shows linearity in the range of 0.75-3.75 µg/ml for CNT and 5-25 µg/ml for OMP. The correlation coefficient was 0.9993 and 0.9990 found for CNT and OMP respectively. The average percentage recoveries of CNT and OMP for RP-HPLC method are of 98.97% and 99.22% respectively. The average percentage assay results of CNT and OMP for RP-HPLC method are of 99.85% and 99.57% respectively. This is comparable to labeled claim. System suitability test reveal that all system suitability parameters complies with standard values.
CONCLUSION
We have successfully developed a new simple RP-HPLC method for the simultaneous estimation of CNT and OMP combination in mixture using simple mobile phase methanol and water. Rapidity and capability of qualifying very low concentration of respective drugs, made them useful for variety of analyses, including pure drug analysis, assay of formulations and stability studies analysis. The purposed method did not utilize any extraction step for recovering the drug from the formulation excipient matrixes and their by decreased the degree of error, time in estimation of the drugs and the overall cost of the analysis. The method was validated and found to be simple, sensitive, accurate, precise and economical. The proposed method could be applied for routine analysis in quality control laboratories.
International Journal of Pharmaceutical Sciences Review and Research Page 40 Zydus Cadila Health Care, Ahmedabad, Gujarat for
providing pure gift sample of Omeprazole and Cinitapride hydrogen tartrate.
REFERENCES
1. Rang HP, Dale NM, Ritter JM, Flower RT; Rang and Dale’s Pharmacology, 6th Edition, Elsevier Limited, 2007; 386-393.
2. Sachs G, Shin JM and Howden CW; Review article: the clinical pharmacology of proton pump, Alimentary Pharmacology & Therapeutics, 23: 2006; 2-8.
3. Cooper BT, Chapman W, Neumann CS, Gearty JC; Continuous treatment of Barrett’s oesophagus patients with proton pump inhibitors up to 13 years: observations on regression and cancer incidence, Alimentary Pharmacology & Therapeutics, 23: 2006; 727-733.
4. Tata S; Pharmacology, 1st Edition, Elsevier Publishing Reprint, 2011; 253, 266.
5. Tripathi KD; Essential of medicinal pharmacology, 6th Edition, Jaypee Brothers Medical Publishers Pvt. Ltd, New Delhi, 2009; 631-633.
6. Joel JJ, Timothy TN, Harrison RV; Gastroesophageal Reflux Disease- American family physician, Octomber 2003; http://www.aafp.org/grd-afp
7. Gershon MD, Tack J; The serotonin signaling system: from basic understanding to the drug development for functional GI disorders, Gastroenterology, 132(1): 2007; 397-414.
8. Hoffer JJ; Gastroprokinetic agent, March 2010; http://www.en.wikipedia.org / gastroprokinetic agent
9. Indian Pharmacopoeia; Volume III, The Indian Pharmacopoeia Commission, Ghaziabad, 2010; 1813-1815.
10. British Pharmacopoeia; Volume III, The Stationery Office on behalf of the Medicines and Healthcare products Regulatory Agency (MHRA), London, 2010; 2953-2956.
11. The United State Pharmacopeia-30: National Formulary-25; United State Pharmacopeial convection, Rockville, 2009; 2796.
12. Schubert A, Werle AL, Codevilla C, Bajerski L, Chiappa R, Cardoso SG; Determination of omeprazole in bulk and injectable preparations by liquid chromatography, Journal of AOAC International, 86: 2003; 501-504,.
13. Alegre MR, Romero JE, Broch SC; Analysis of omeprazole and its metabolites by liquid chromatography using hybrid micellar mobile phases, Analytica Chimica Acta, 633: 2009; 250–256.
14. Nahar K, Joti JJ, Ullah MA, Hasan A, Azad MK, Hasnat A; A simple RP-HPLC method for omeprazole in human serum and urine: validation and application in pharmacokinetic study, Journal of Pharmaceutical Science, 8(2): 2009; 123-130.
15. Yuen KH, Choy WP, Tan HY, Wong JW, Yap SP; Improved high performance liquid chromatographic analysis of omeprazole in human plasma, Journal of Pharmaceutical and Biomedical Analysis, 24(4): 2001; 715–719.
16. Ahmad L, Iqbal Z, Nazir S, Shah Y, Khan A, Khan MI, Nasir F; Optimization and validation of HPLC-UV method for simultaneous determination of omeprazole and its metabolites in human plasma: effects of various
experimental conditions and parameters, Journal of Liquid chromatography & Related technologies, 34(15): 2011; 1488-1501.
17. Sluggett WS, Stong JD, Adams JH, Zhao Z; Omeprazole determination using HPLC with coulometric detection, Journal of Pharmaceutical and Biomedical Analysis, 25: 2001; 357–361.
18. Vital S, Ganneboina R, Layek B, Trivedi RK, Hotha KK, Bharathi DV, Mullangi R; Highly sensitive method for the determination of omeprazole in human plasma by liquid chromatography-electronspray ionization tandem mass spectrometry: application to a clinical pharmacokinetic study, Biomedical Chromatography BMC, 23(4): 2009; 390-396.
19. Macek J, Klima J, Ptacek P; Rapid determination of omeprazole in human plasma by protein precipitation and liquid chromatography-tandem mass spectrometry, Journal of Chromatography B, 852: 2007; 282–287.
20. Kanazava H, Okada A, Matisushima Y, Yokota H, Okubo S, Mashige F, Nakahara K; Determination of omeprazole and its metabolites in human plasma by liquid chromatography-mass spectrometry, Journal of Chromatography A, 949: 2002; 1-9.
21. Bhandage A, Bhosale A, Kasture A, Godse VP; Extractive spectrophotometric determination of omeprazole in pharmaceutical preparations, Tropical journal of pharmaceutical research, 8(5): 2009; 449-454.
22. Sastry CS, Naidu PY, Murty SS; Spectrophotometric methods for the determination of omeprazole in bulk form and pharmaceutical formulations, Talanta, 44: 1997; 1211- 1217.
23. Ozaltin N, Kocer A; Determination of omeprazole in pharmaceuticals by derivative spectroscopy, Journal of Pharmaceutical and Biomedical Analysis, 16: 1997; 337–342.
24. Shaghaghi M, Manzoori JL, Jouyban A; Indirect spectroflourimetric determination of omeprazole by its quenching effect on the fluorescence of terbium, 1-10- Phenanthroline complex in presence of bis (2-ethylhexyl) sulphosuccinate sodium in capsule formulations, Tabriz University of Medical Science, 16(4): 2008; 256-262.
25. Syeda H, Akalanka D, Appala R, Syed S; Development and Validation of a Rapid RP HPLC Method for the Determination of Cinitapride Hydrogen Tartarate in Solid Oral Dosage Forms, E-J Chem, 8(3): 2011; 1424-1429.
26. Thangabalan B, Prabahar AE, Kumar PV; Development and validaton of a RP-HPLC method for the determination of Cinitapride in pharmaceutical dosage form, Journal of pharmaceutical research, 4(3): 2011; 587-588.
27. Roy SM, Mangaonkar KV, Desai AY, Yetal SM; RP-HPLC method for the determination of Cinitapride in presence of its degradation products in bulk drug, E-J Chem, 7(1): 2010; 311-319.
28. Roy MN, Yetal SM, Chavan SV, Pradhan VR, Joshi SS; Determination of free levels of Cinitapride in human plasma by Liquid Chromatography-Tandem Mass Spectrometry, E-J Chem, 5: 2008; 453-460.
bulk drug and pharmaceutical formulation, IPC Abstract, 530 section: 2009; 41.
30. Thangabalan B, Prabahar AE, Kalaichelvi R, Kumar PV; UV Spectrophotometric method for determination of Cinitapride in pure and its solid dosage form, E-J Chem, 6: 2009; 21-24.
31. Thangabalan B, Prabahar AE, Kumar PV; Validated extractive spectrophotometric estimation of Cinitapride in pure and its solid dosage form, International journal of pharmacy and pharmaceutical science, 2(3): 2010; 153-155.
32. Homaira S, Dey A, Appala RS, Sanaullah S; Applications of colorimetric methods for the determination of Cinitapride Hydrogen Tartarate in drug formulations, International journal of pharmacy and pharmaceutical Science, 2(1): 2010; 134-136.
33. Balaji K, Devadasu CH, Naga SG; Spectrophotometric Analysis of Cinitapride Tartrate by Diazocoupling and Molecular Salt Formation Methods, Inventi Impact: Pharm. Ana. & Qual. Assur., 1: 2011; 18-21.
34. Jagani NM, Prajapati VD, Shah JS, Patel PB; Quantitative Estimation of Cinitapride in Tablet Formulation by Zero & First Order Derivative Spectrophotometry Using Area under Curve Method, Inventi Rapid: Pharm. Ana. & Qual. Assur., 2: 2012; 1-3.
35. ICH Harmonised Tripartite Guideline, Validation of Analytical Procedures: Text and Methodology Q2 (R1), 2005;
http://www.ich.org/file admin/Public_Web_Site/ ICH_Products/ Guidelines/ Quality/Q2_R1/ Step4/ Q2_R1_Guideline.pdf
About Corresponding Author: Mr. Nayan M. Jagani