Xp?a XIIBS samwad
paumq Bufxds awl pua py.u s.xaa~s uo
su$ ~aq%~
%;ru.mq %yds d~zxza pm
8uynq ou Japun
wzal pm ihynq hpds
awl pm p~xu lapun ~saw&?’
axaM sraaw uo SU~IZ~ *patIdde SI?M
%ufumq Supds ale1
uayM paurnqun
SE sum aql
pauyuar mq &,y.mq ihyds
p’ux pm dl.wa dq pampax aJaM spIa$ a%qlaH
*sassa
uos??as-umm alqe+sap
ayl 03 m~rur~s BoIouayd
py qq~
sa!Bads dpaaM atuos paloat?
OSIE aqa *paxoaq
axaM sa!mds
UO~WS-WIII?M aIqt+sap
ayl pm %~u.mq
S+ds dq pampal
alaM sapads uosaas-loo3
l
sa!sads pmpfA!pui30 uopxax aye
II! ma)Jodtuf SBM
t.p~ox.8 30 poyad 03 uorv?Iax
II! %rumq
30 au.u;L weaX uaaluaaas
raao pa,eSysaauf
aJaM suoye~a~
amwfour lfos pua ‘ pla$ a%eqxay
6uorlfsodwoB 1wpwoq
‘ sraaw 30 su$ ~q8~aM uo
sition, now called reductions in range condition. It was eventually found that time of burning af- fected both rate and degree of such change. The rancher can time burning for minimal change. This study emphasizes the utmost importance of such timing.
Experiments reported here followed exhaustive tests on ungrazed plots begun by Hensel (1923) and continued by Aldous (1934). Results are from a study designed to evaluate the combintion of burning and grazing bluestem range. A single bluestem pasture was fenced into three equal portions, each containing approximately equal amounts of ordinary upland (OU), limestone breaks (LB), and claypan (Cp) range sites. They have been burned annually, each at a different spring date, in an attempt to relate burning time to plant and animal performance.
Experimental Area and Methods
The study area, known as the Donaldson Pastures, is in the Flint Hills region of the True Prairie 5 miles northwest of Manhattan, Kansas, and described by Herbel and Anderson (1959). Vegetation is largely warm-season grasses. Big bluestem and little bluestem make up 50 to 60% of the botanical composition. Three other warm-season grasses, Indiangrass, switchgrass and sideoats grama, com- prise another 10 to 20%. Numerous forbs and grass species constitute the remainder. Under good management shrubs are mainly confined to rocky ridges and lowland areas.
Range sites of the experimental area were described by Anderson and Fly (1955). The three major range sites were OU, LB, and Cp. Grass vegetation of the area as a whole also was described. OU at that time contained 85% grasses, 58% decreasers, and 27% increasers. LB contained 87% grasses, 63% decreasers, and 24% increasers, while Cp had only 75% grass, 20% decreasers, and 55% increasers.
Three 44-acre pastures containing approximately the same percentages of OU, LB, and Cp were burned annually from 1950 to 1966 at three different spring dates: early spring (March 20), mid spring (April lo), and late spring (May 1). A similar, unburned 60-acre pasture served as a control. All were grazed season long by steers at approxi- mately 5 acres per animal unit.
Time of burning as a Flint Hills range management practice has steadily become later over the past 25-30 years. The major burning season, once in January-Febru- ary, now is late March and early April.
To be satisfactory, any range management practice must permit maximum sustained livestock production without degrading (reducing) the range resource, a resource annu- ally replaced if maintained but irreplaceable when too severely depleted. Various elements that indicate the value of any range management practice can be measured. The condition of the range resource may be estimated on the basis of botanical composition and herbage yields, both of which are closely related to soil moisture. They, in turn, may be related to livestock performance, measured in this study as steer gains. These basic components-botanical composition, herbage yields, soil moisture, and steer gains- were sampled.
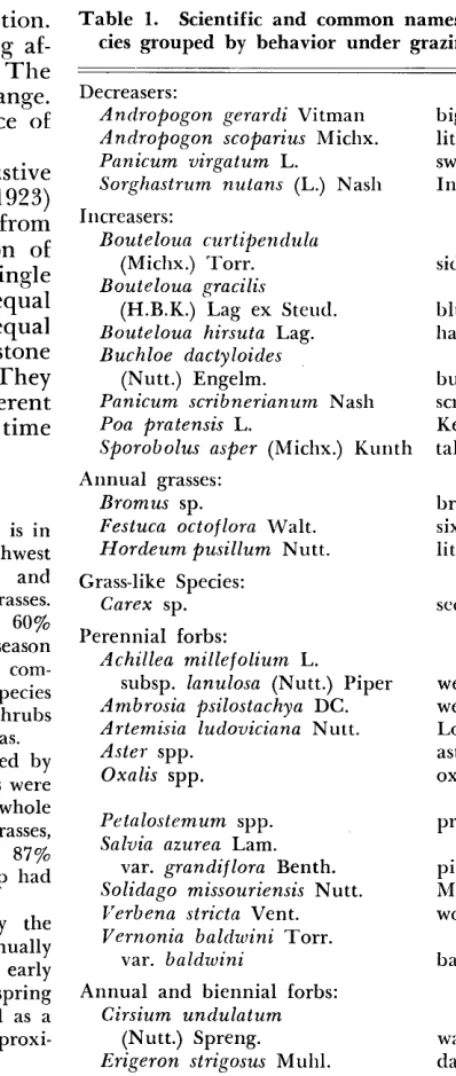
2 Scientific names in Table 1.
Table 1. Scientific and common names of principal spe- cies grouped by behavior under grazing pressure.
Decreasers:
Andropogon gerardi Vitman
Andropogon scoparius Michx.
Panicum virgatum L.
Sorghastrum nutans (L.) Nash
Increasers:
Bouteloua curtipendula
(Michx.) Torr.
Bouteloua gracilis
(H.B.K.) Lag ex Steud.
Bouteloua hirsuta Lag.
Buchloe dactyloides
(Nutt.) Engelm.
Panicum scribnerianum Nash
Poa pratensis L.
Sporobolus asper (Michx.) Kunth
Annual grasses:
Bromus sp.
Festuca octoflora Walt.
Hordeum pusillum Nutt.
Grass-like Species:
Carex sp.
Perennial forbs:
‘4chillea millefolium L.
subsp. lanulosa (Nutt.) Piper
Ambrosia psilostachya DC.
Artemisia ludoviciana Nutt.
Aster spp.
Oxalis spp.
Petalostemum spp.
Salvia azurea Lam.
var. grandiflora Benth.
Solidago missouriensis Nutt.
Verbena stricta Vent.
Vernonia baldwini Torr.
var. baldwini
Annual and biennial forbs:
Cirsium undulatum
(Nutt.) Spreng.
Erigeron strigosus Muhl.
Woody plants:
Amorpha canescens Pursh
Ceanothus ovatus Desf.
Rhus glabra L.
Symphoricarpos orbiculatus
Moench
big bluestem little bluestem switchgrass Indiangrass
sideoats grama blue grama hairy grama buffalograss scribner panicum Kentucky bluegrass tall dropseed
brome
sixweeks fescue little barley
sedge
western yarrow western ragweed Louisiana sagewort aster
oxalis prairieclover pitcher sage Missouri goldenrod wooly verbena baldwin ironweed
wavyleaf thistle daisy fleabane
leadplant inland ceanothus smooth sumac buckbrush
Botanical composition for each pasture was estimated by measuring basal intercept of each plant occurring along 20 to 30 randomly placed 5-meter line transects in each of the principal range sites. Species composition was calcu- lated as percentage of total plant basal cover. These data were taken on individual range sites from 1956 through
knowledge of the behavior of original vegetation of an area and the pattern of regression, one can estimate the percentage of present vegetation that is original in that area. That percentage value is an index of range condition: O-25% = poor, 26-50s = fair, 51-75s = good, and 76- 100% = excellent. Using the method, as described by Dyk- sterhuis (1949), range condition for each range site in each treatment was estimated annually.
Each year ten wire cages 1 yard square and 30 inches high were randomly placed in each of the principal range sites in each pasture to exclude grazing. At the close of the growing season, herbage from a 4.36 ft2 plot was clipped to ground level in each cage area. A like plot was clipped on an adjacent ‘grazed area.
Herbage from the plots was separated into forage, weeds, and mulch; forage consisting of those species original for the site, weeds, those not original, and mulch or residue that had accumulated from growth of the previous seasons (no mulch remained in burned pastures). Yields are re- ported as pounds of air-dry herbage per acre. Differences in herbage yield between caged and uncaged plots were termed disappearances and were considered an index of grazing use.
Soil moisture was determined twice monthly during the growing season and once monthly the remainder of the year. Three aluminum access tubes were installed in each of the OU and Cp sites in each of the pastures. Foot-by- foot readings to 5 feet in OU and to 3 feet in Cp were taken by means of a neutron-scattering moisture probe and scaler. The foot-by-foot readings were accumulated to give total moisture in inches per 3- or 5foot profile. The device measured total soil moisture in all forms, only a portion of which is available for plant growth.
The grazing season began in late April or early May each year and extended to October for an average of 151 days. Hereford steers (average U.S.D.A. feeder grade of low choice) were used to stock the pastures. Steers about 14 months old with an average initial weight of 510 lbs. were used in 10 of the trials and steers about 26 months old with an average initial weight of 733 lbs. were used in other trials. The average initial weight of all steers used was 621 lbs. The steers were purchased as calves, all from the same area any one year. They were fed roughage rations or were on pasture before the grazing trials began.
All four pastures were stocked at the same rate, 5.0 acres per animal unit. The steers were identified and were weighed individually the first day of each month. They were brought in from the pastures between 3:00 and 6:00 p.m. the day before weighing and held in pens without feed or water until the next morning when they were weighed between 6:00 and 9:00 a.m. For the starting and final weight of each trial all steers were mixed and weighed at random. Salt was supplied in each pasture. The steers were graded as feeders at the close of the season.
Results and Discussion Soil Moisture
Soil moisture, a major factor in range forage production, is closely associated with range man- agement. The aluminum access tubes installed in the four pastures in late May, 1961, have permitted soil moisture to be determined throughout each year 5 feet deep in OU soils and to 3 feet in Cp.
Changes in soil moisture are smaller during the nongrowing season because both moisture utiliza- tion and precipitation are less then than in summer.
Reserves of soil moisture in Flint Hills range ordinarily decline rapidly from April to August and are then slowly replenished to a peak in early spring. Fastest depletion occurs during what nor- mally is the wettest part of the year, also the time warm-season grasses grow fastest and use the most moisture. Moisture is replenished in relatively dry months when there is no growth of the bluestems and consequently very little moisture use.
The 5 years during which soil moisture was measured in the Donaldson Pastures included two extremely dry and one unusually wet season. Less than 19 inches of precipitation came in 1963 and only about 15 in 1966, but more than 41 inches in 1965. The other 2 years were near average (32 inches per year).
There is evidence that in OU, grasses use mois- ture from about 6 feet of soil in dry years under stress (Anderson, 1965). Very little moisture ap- pears to be extracted from the seventh foot even in dry years.
In favorable seasons, like 1965, the reserve of soil moisture is built up and the deeper layers become wetted. Use of moisture in such years is largely in the upper 2 or 3 feet of soil where with- drawal occurs when moisture is present. When rains are frequent, any moisture lost by use is re- plenished before more from deeper soil is needed. Conversely, in dry years such as 1963 and 1966, moisture lost from the upper soil layers by use is not promptly replaced, and the deeper soil layers yield moisture to plants as the supply in upper layers is depleted. Thus, the reserve dwindles. In the late summer of 1963, moisture in the upper 5 feet of OU soil fell to about 14 inches, while it fell only to 20 or 22 inches in 1965; 1966 was also dry, but it began with a high reserve of near 25 inches of soil moisture in 5 feet of OU soil stored during wet 1965.
Despite the dry, hot summer of 1966, the pas- tures had about 4 inches more soil moisture in late August than they did in late August, 1963, but moisture levels did not rise the fall of 1966 as no appreciable moisture was received; 1962 and 1964 had about average rainfall. Soil moisture dropped to around 18 inches in late August and rose to 2 1 or 22 inches by fall both years.
ORDINARY UPLAND
Sampling Date
FIG. 1. Year-long fluctuations in total moisture in upper 5 ft of OU range soils, 1962-1966 average. Moisture expressed as inches of water in soil column.
Among burned pastures, the one burned earliest has been lowest in moisture in OU (Fig. 1). Those burned in mid and late spring have had consid- erably more moisture, which agrees with results from ungrazed plots (McMurphy and Anderson,
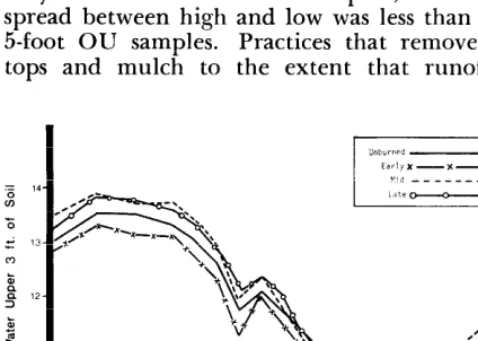
1963). The unburned pasture has also been low in soil moisture even though its mulch reduced losses by runoff and evaporation. It is assumed that greater growth on
L
this pasture used more soilmoisture and hence lessened soil moisture reserves. Trends in Cp were essentially the same as those in OU. Pastures in highest range condition had the most soil moisture. Least soil moisture was in a pasture burned in early spring (Fig. 2). Since only 3 feet of soil could be sampled, however, the spread between high and low was less than in the 5-foot OU samples. Practices that remove plant tops and mulch to the extent that runoff and
9
J F M Al A2 MI f42 JI J2 JI JP AI A2 SI S2 0 N D Sampling Date
FIG. 2. Year-long fluctuations in total moisture in upper 3 ft of Cp range soil, 1962-1966 average. Moisture expressed as inches of water in soil column.
evaporation are accelerated result in reduced soil moisture (Rauzi, et al., 1968). That, in turn, reduces forage yield. Unpublished work at Man- hattan, Kansas, shows that even in wettest years, Flint Hills range seldom contains as much mois- ture as could be effectively and efficiently utilized for maximum forage yields. Furthermore, grazing practices severe enough to allow accelerated runoff and evaporation, in themselves deplete plant vigor and forage yield. Such practices reduce depth of rooting, number of forage species roots, and extent which plant roots explore the soil. That reduces the ability of such species to extract water from a supply of soil moisture already reduced by accel- erated runoff and evaporation. A relatively higher soil moisture content may result from heavy use which reduces root exploration. That results in lower moisture use. Thus the circle is completed and each effect accentuates the other. But the trends are reversible. Restoration of forage plant vigor by carefully regulated grazing management leads to restoration of the mulch and to reduced runoff and evaporation. Yields of forage then in- crease because of increased plant vigor, increased root development, and increased soil moisture.
In addition to loss of water and plant vigor as a result of over-grazing, there are other sources of range depletion. Accelerated runoff accelerates erosion (Hanks and Anderson, 1957). Erosion even- tually reduces productive capacity, and that trend is only slowly reversible. The loss may, of course, be minimized by changes in management, but soil lost by erosion cannot be replaced. Still another source of depletion is invasion by weeds, permitted by low vigor and reduced competitive ability of desirable forage species. Such a change is clearly seen in the early burned pasture as well as on over-grazed range. As weeds increase, their relative ability to compete for water, light, and plant nutri- ents increases, because they are grazed only lightly if at all. Therefore, their vigor is reduced less than the vigor of grazed forage species. Weeds remain fully able to compete and thus they accelerate depletion of the range as a whole. That need not happen, even on burned range. Management prac- tices geared to growth needs of the forage species will assure maintaining their vigor and competitive ability, which will prevent invasion by weeds and keep runoff and erosion at a minimum.
Herbage Yield
Yield of bluestem range vegetation is directly related to soil moisture and has been shown to be affected by burning. Herbage yields and disap- pearance reported here are for 1958-65. The data were presented in detail by Owensby and Ander- son (1967), so they are only summarized here.
Table 2. Forage and weed yields (lb/acre, air dry) for indicated times of burning (&year average).
ing treatments. Species actively growing when burning occurs are more likely to be injured than
Time of Forage Weed
dormant species or those just starting growth. Ac- tively growing species may be killed outright by
hurning OU LB- OU LB the fire or their above ground parts damaged to
Early-spring 2612 a1 2114 a 335 b 430 c the extent that they draw on food reserves already Mid-spring 3238 b 2440 ab 289 b 269 b reduced by early growth. The drawdown could Late-spring 3529 bc 2681 b 161 a 106 a cause death or reduce the competitive ability of Check 3919 c 2562 ab 300 b 337 bc the plant. to benefit the warm-season perennial So spring burning is purposely timed grasses that IYields in each range site followed by the same letter do not dominate True Prairie range.
differ significantly (P < 0.05).
Decreasers
on unburned OU range, but early- and mid-spring burning reduced yields (Table 2). Forage yields on LB were not reduced by early spring burning. However, significantly more forage was produced with late than with early spring burning. OU yielded more forage than LB over all treatments.
Forage disappearance during the grazing season did not differ among the various treatments but was greater on OU than on LB (Table 3), how- ever percent removal was greater on early- and mid-spring burned pastures.
Botanical Composition
Botanical composition is the major criterion in judging range condition, and change in botanical composition furnishes valuable information con- cerning long-time effects of management systems on vegetation. Annual plant-census estimates made by the line-transect method not only illustrate the remarkable ability of bluestem prairie vegetation to resist depletion but also show that treatments vary in composition changes they cause.
Changes in botanical composition in these trials could have resulted from pasture overuse as forage yields were reduced by early- and mid-spring burn- ing. Damage by fire also could partially reduce yields.
The date of burning in relation to growth cycle of a given species largely determines the extent the species increases or decreases under the burn-
Table 3. Disappearance in yields of forage and weed species (lb/acre, air dry) for indicated times of burning (&year average).
Time of Forage p- Weed species
burning OU LB OU LB
First in importance are big and little bluestem followed by Indiangrass, switchgrass, and a few lesser species. Big and little bluestem collectively make up 45 to 55% of the total basal cover of the vegetation of OU and LB ranges in the study area but only slightly more than 10% in Cp. Big blue- stem makes up 25 to 35% of the total basal cover of the vegetation in OU and LB and little blue- stem less than 20. That represents a reversal, since Anderson and Fly (1955) reported around 20yo big and 30yo little bluestem when trials started in this area. Their reports are for work during a drought period and more xeric little bluestem would be more prevalent. However, together, those two species still make up nearly half the total vegetation.
The percentage of decreasers has remained es- sentially the same during the 10 years on OU in the unburned pasture, decreased slightly in the early-burned pasture, and increased under mid- and late-spring burning.
The major True Prairie species and their indi- vidual ecology have been described well, (Weaver,
1954), so their responses to time of burning under the impact of range site and grazing use is pre- sented here. As a result of the treatments decreas- ers averaged 40 to 50% of the vegetation in OU and LB of unburned and early-spring burned pas- tures and about 10% in Cp. Under mid- and late- spring burning they made up 60 to 70yo in OU and LB but varied widely in Cp.
The decreasers have tended to increase slowly in basal cover throughout the 10 years, starting on Cp at 0.8 to 1.0% basal cover and reaching 2.2 to 2.4”/,, and rose to about 3.47& on the late-burned pasture. On LB basal cover remained fairly con- stant between 2.0-4.0%. In OU neither the check nor the early-burned pastures changed, but in the mid- and late-burned pastures decreasers rose from
Early-spring 1304 a1 870 a 121 ab 156 b near 4% to 67, basallcover during 1956-65. Nei-
Mid-spring 1278 a 993 a 143 b 101 b ther grazing pressure nor annual burning was
Late-spring 1628 a 1009 a 53 a 18 a severe enough to deplete the range; burning in
Check 1670 a 863 a 125 ab 106 b
Table 4. Basal cover (96) of the principal decreaser spe- cies under different burning treatments (lo-year average over all range sites) on different range sites (lo-year average over all treatments).
Spring burning Range site
Species
Un-
burned Early Mid Late OU LB Cp
Decreasers 3.20,l 3.36, 4.041, 4.62, 5.06, 4.2& 1.82, Big bluestem 1.50, 2.01b 2.2% 2.52, 2.62, 2.4lb 0.99,
Little bluestem 1.21b 0.78, 1.09b l.l7b 1.6% 1.19b 0.28, Indiangrass 0.34, 0.35, 0.64b 0.71b 0.70, 0.62, 0.141, Switchgrass 0.08, 0.08, 0.08, 0.16b 0.08, o.@!?b O.lfi
lpercentages followed by the same letter within a given species or within a given range site do not differ significantly (P < 0.05).
spring burned pastures was greater, however, with the latter greater than the former (Table 4).
On a range site basis, regardless of treatment, basal cover of decreasers on all sites differed sig- nificantly; Cp was lowest, LB moderate, and OU highest (Table 4).
To understand decreasers as a group, it is neces- sary to examine a few major species.
Big Bluestem
This major decreaser, sharing first place among the dominants with little bluestem, responded to treatment in the manner of the group. Table 4 shows basal cover in each of the four treatments. It ranged from 1.50% with no burning to 2.52y0 in the late-burned pasture. Burning, especially late spring burning, favored big bluestem. OU and LB had the greatest basal cover of big blue- stem 2.627$ and 2.49%) and Cp the least (0.99%).
Big bluestem has made up 20 to 30% of the vegetation in OU and LB under no burning and early-spring burning and 32-43% under late-spring burning. Date of burning caused no difference in big bluestem percentage on Cp. Average percent- ages for the 10 years are shown in Table 5.
Big bluestem increased in OU under mid- and late-spring burning but increased only slightly under early or no burning. In LB it has changed little, although the difference between later and
Table 5. Composition (o/O) of principal decreaser grasses under different burning treatments (IO-year average over all sites) and on different range sites (IO-year average over all treatments).
Species
Spring burning * Range site Un-
burned Early Mid Late OU LB Cp
Decreasers 33.4 38.4 42.1 45.5 54.2 60.5 11.0
Big bluestem 16.0 23.0 23.6 28.4 28.1 34.4 6.0
Little bluestem 13.0 9.4 11.5 13.9 22.4 20.1 2.5
Indiangrass 3.7 4.0 5.8 4.5 7.6 6.0 0.7
Switchgrass 0.7 0.8 0.6 1.5 0.9 0.8 0.9
earlier burnings has widened. In Cp, big blue- stem has increased under all treatments.
Little Bluestem
Little bluestem basal cover decreased with early- and mid-spring burning, more with early-spring burning. Basal cover under mid-spring and late- spring burning did not change in relation to the unburned pasture (Table 4). It was often dry during March when burning occurred, and little bluestem, a bunchgrass, was more susceptible to injury under such conditions. OU had the great- est basal cover of little bluestem, and claypan the least.
Early- and mid-spring burning caused slight reductions in the percentage of little bluestem in OU and LB. There was no change in little blue- stem percentage in Cp (Table 5). OU and LB had approximately the same percentages of little bluestem; Cp contained considerably less.
0 ther Decreasers
Other decreasers occur in a less uniform pattern and were absent from many of the samples. The major one, indiangrass, made up 5-9% of the vege- tation in OU and LB but only 1% or less in Cp. It increased under all treatments in OU and LB and remained fairly constant in Cp. Switchgrass, even less abundant and less uniformly distributed than Indiangrass, declined slightly in all treat- ments in OU and showed no change in LB and Cp. The other decreasers were too sparse and scattered to influence range condition.
Basal cover of Indiangrass over the 10 years was highest under mid- and late-spring burning and lowest under early-spring or no burning (Table 4). Switchgrass was higher under late- spring burning than under early-spring, mid- spring, or no burning.
Decreasers appeared in this trial, under mod- erate grazing pressure, to have been favored by mid- and late-spring burning and big bluestem was the one most favored. It has long been appar- ent from plot trials that early-spring burnings are undesirable, but late-spring burning did not re- duce forage yields. Early- and mid-spring burning still are considered detrimental.
Increasers
Table 6. Composition (%) of the principal increaser grasses under different burning treatments (IO-year aver- age over all sites) on different range sites (IO-year av- erage over all treatments).
Spring burning Range site
Un-
Species burned Early Mid Late OU LB CP
Increasers 38.6 37.9 42.6 35.1 24.6 24.1 68.5
Sideoats grama 8.4 11.5 8.6 9.5 8.9 18.6 1.6
Blue and hairy
grama 3.1 19.3 15.7 12.6 3.7 3.4 30.9
Buffalograss 11.6 8.3 13.1 11.7 3.2 1.6 26.0
Kentucky
bluegrass 10.8 0.4 0.5 0.4 5.3 1.5 5.2
tucky bluegrass, in all sites, but in this study they are listed among the increasers.
In these trials increaser grasses made up about 25% of the vegetation in OU and LB and a little over 6670 in Cp (Table 6). The latter range site, being fairly level and therefore easy for grazing animals to negotiate, may often have been quite heavily grazed even when the pasture as a whole was stocked lightly. Cp normally contains 60-7070 increasers at climax.
the late-spring burned pasture basal cover re- mained at approximately 1 .S%. Overall increas- ers in OU tended to continue to increase in basal cover under all treatments except late-spring burning.
In LB basal cover of increasers remained fairly stable from 1956 thru 1965. At the beginning of the period it was between 1.8 and 2.070 for all treatments. By 1965 it was 2.3oi’, in the unburned pasture, 1.670 in early-spring burned, 1.670 in mid- spring burned and 1.474 in late-spring burned pas- ture. Again as in OU, the late-spring burned pasture had the least basal cover of increasers; the unburned check, the most basal cover.
sideoats ~~~~~
In Cp there were differences when the study began. Early- and mid-spring burned pastures had 3.470 increaser basal cover and late-spring burned and unburned range had 11% basal cover. By the end of the period, however, Cp in the unburned check had 9.070; in late-spring burned, 8.070; in mid-spring burned, 20.070; and in early-spring burned pastures, 16.070. Those data indicate that on Cp basal cover response to late-spring burning is similar to that on other like treated sites, but in the unburned check it behaves differently from its action in OU and LB, decreasing instead of increasing.
all treatments except late-spring burning, where In OU increasers became more abundant under
they remained about the same. There was essen- tially no change in increasers on LB or Cp.
Sideoats grama made up an average of 8.9% of the vegetation in OU, 18.670 in LB, but only 1.60/;, in Cp. It was remarkably stable, remaining near average on all sites throughout the 10 years. Sideoats grama increased more in the early-spring burned pasture than in the unburned check or the late-spring burned one. Herbel and Anderson (1959) reported in a study on a nearby area that sideoats grama increased markedly under heavy crazing on all range sites studied. With the re- zuced yields accompanying early-spring burning, heavy grazing occurred. The response of sideoats under those conditions was similar to that reported by Herbel and Anderson under heavy grazing. During the 10 years, increasers as a group rose
in basal cover. Average basal cover of major spe- cies are shown in Table 7 for the period. The
1956 basal cover of increasers in OU was 1 .6-270 and essentially the same for all treatments, but by
1965 increasers in the unburned check had a basal cover of 3.870, in the early-spring burned pasture,
3.27,,
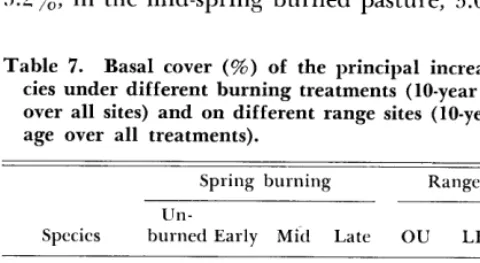
in the mid-spring burned pasture, 3.Opi’,. InTable 7. Basal cover (%) of the principal increaser spe- cies under different burning treatments (lo-year average over all sites) and on different range sites (IO-year aver- age over all treatments).
Species
Spring burning Range site
Un-
burned Early Mid Late OU LB Cp
Basal cover of sideoats grama has remained fairly constant at less than 1.0% under all treatments throughout the 10 years in OU. It declined slightly in LB from approximately 1.6% to 1.0% and re- mained at a low O.Zp” level in Cp. Basal cover of sideoats has remained essentiallv the same in all
Increasers 5.01,l 4.54, 6.41r, 4.37, 2.26,, 1.70, 10.71, treatments throughout the 10 years except that it
Sideoats .grama 0.751, 0.971, 0.76, 0.79:, 0.27, 0.82,) 1.31, increased under early-spring burning.
Blue and Kentucky Bluegrass
hairy grama 0.50, 2.19r, 2.89, 1.81,, 0.35, 0.24, 4.30,,
Buffalograss 2.21, 1.081, 2.65, 1.37, 0.12, 0.29:, 4.53r, Kentucky bluegrass is a cool-season perennial
Kentucky
that tends to increase under heavy stocking. How-
bluegrass 1.25, O.O5r, 0.06,, 0.04,, 0.50, 0.1 l,, 0.88,
ever, it was all but lost from the population under all burning treatments. In the unburned pasture
IPercentages followed by the same letter within a given species or it had increased from approximately 5.0% in 1956
approximately 0.3% in 1956 and 0.4y0 in 1965. LB had approximately l.5y0 in the unburned pas- ture compared with nearly 10% in the OU and Cp (T,able 6).
Table 8. Composition (96) of total perennial grasses on OU, LB, and Cp under different burning treatments (lo- year average).
Basal cover of Kentucky bluegrass ranged from 1.20/, overall in the unburned pasture to less than 0.1% in the three burned pastures. Over all treat- ments Kentucky bluegrass had the greatest basal cover in Cp at 0.8%, intermediate at 0.5y0 in OU, and least in LB at 0.1% (Table
7).
Burning on dates chosen for these trials was extremely detrimental to Kentucky bluegrass.Burning treatment
Unburned Early-spring Mid-spring Late-spring Mean
OU
77.6 71.3 82.1 85.6 79.1
Range site
LB CP x
81.5 67.5 75.5 77.2 83.9 77.5 87.1 88.4 85.9 92.7 81.3 86.5 84.6 80.2 -
Buffalogl-ass
Buffalograss has steadily declined in the un- burned and late-spring burned pastures, the prin- cipal decline occurring in Cp, the only range site which contained significant amounts of buf- falograss during the 10 years reported here. Buf- falograss has remained relatively stable in the early- and mid-spring burned pastures (Table 6).
2.8% in mid-spring burned pastures. From 1956 to 1965 basal cover of blue and hairy grama was steady under all treatments except late-spring burning, where it declined slightly.
Buffalograss was lowest in basal cover at the end of 10 years in early- and late-spring burned pastures (near 1.2%) (Table 7). The unburned check and mid-spring burned pastures had 2.5% of the species. Over the 16 years early- and late-spring burning reduced basal cover because no differ- ences in the basal cover of buffalograss were found when the experiment began. Average basal cover of buffalograss during the 10 years reported here was greatest in Cp (4.53%); @U had 0.12%, and LB 0.29%.
These two increaser grasses have been favored by early- and mid-spring burning. Blue and hairy grama along with buffalograss make up the bulk of the increaser species.
Total Perennial Grasses
Blue and Hairy Grama
These two grasses, though they occupy different niches in the ecosystem, behave similarly under grazing pressure and were analyzed together. During the 10 years reported here blue and hairy grama in OU and LB made up approximately 3.5 y0 of the vegetation, while in Cp they averaged 30%. In unburned pasture over all range sites they averaged about 3.0y0, considerably less than the 15-19% found in early- and mid-spring burned pastures. The late-spring burned pastures aver- aged 12% blue and hairy grama. Since original percentages of blue and hairy grama were not different among treatments, the data indicate that fire favors blue and hairy grama, particularly in Cp. The composition percentage of blue and hairy grama, in all pastures has been relatively stable the past 10 years.
The percentage of perennial grasses in these pastures is exceptionally high. Average percentage over all range sites was lowest in the unburned pasture (74.5%) and progressively higher the later burning occurred: early-77.2%, mid-85.5%, and late-86.2%. In Cp, the perennial grasses percent- age was essentially the same for all burning treat- ments but the unburned pasture had 20% lower basal cover of perennial grasses (Table 8). Among range sites OU and Cp contained approximately the same percentage perennial grasses, but LB contained 5% more.
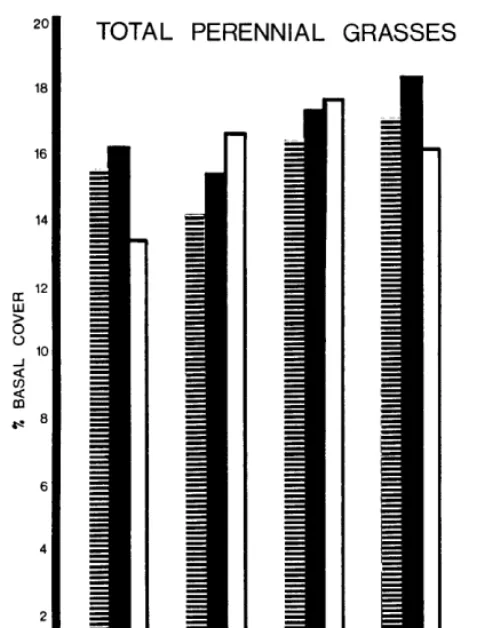
T,otal perennial grass basal cover increased slightly in both OU and Cp and remained stable in LB, during 1956-65. The mid-spring burned pasture had the highest basal cover (12%) by 1965, with the others essentially equal at 8.5%. Basal cover was greatest in Cp and least in LB, with OU intermediate. Dense mat-forming buffalograss in Cp explains much of the high basal cover. Basal cover for the total perennial grasses was highest with mid-spring burning, due largely to high in- creaser basal density shown previously. Average basal cover of perennial grasses for the 10 years is shown in Figure 3.
Annual Grasses
In the unburned pasture basal cover of blue
TOTAL PERENNIAL GRASSES
llke plants
BURN EARLY MID LATE
FIG. 3. Basal cover (%) of perennial indicated burning treatments.
grasses (IO-year average)
TIME OF BURNING
F1c. 4. Basal cover (%) of annual grasses and grasslike plants (lo- year average over all sites) for indicated burning treatments.
nant genus, Carex, begins in late March. That makes it highly susceptible to mid- and late-spring burning. Late-spring burning reduced its per- centage more than mid-spring burning. Grass-like plants had their greatest percentages in OU; low- est, in Cp, and were particularly low in LB with late-spring burning.
for
unburned check, but remained fairly stable in the burned pastures. Cp contained the highest per- centage of annual grasses; LB the least; OU was intermediate.
Over the 10 years basal cover of annual grasses decreased in mid- and late-spring burned pastures, particularly in Cp. It varied widely in the un- burned pasture, which is typical of annuals in a perennial grassland. Figure 4 shows average basal cover on the different treatments for the 10 years. Basal cover was highest in Cp (1.4x), lowest in LB (0.05%) and intermediate in OU (0.16%). Cp is typically a droughty site; in wetter years annuals are opportunists there.
The basal cover of grass-like plants did not change over the 10 years in mid- -and late-spring burned or unburned pastures, but increased stead- ily in the early-spring burned pasture. During 1956-65 average basal cover (Fig. 4) of the grass- like plants was greatest in the early-spring burned pasture (0.8%) and progressively lower in the unburned (0.7%), mid-spring burned (0.6%), and the late-spring burned pastures (0.4%). LB had a lower basal cover (0.3y0) during 1956-65 than did OU and Cp (0.7%).
Grass-like Plants
During the 10 years percentage of grass-like species was highest in the early-spring burned pasture. OU and LB in that pasture contained nearly 10% grass-like plants. The grass-like plants percentage increased in the early-spring burned pasture throughout the study. Mid-spring and late-spring burned pastures and the unburned pasture had relatively stable percentages of grass- like plants. Over the entire study grass-like plants seemed to flourish under the unburned and early- burning treatments. Growing season of the domi-
Perennial Forbs
Perennial forb percentages in the early-spring (lO.OCr,) and in the unburned (8.3%) were higher than in the mid-spring burned pasture (6.0%) or in the late-spring burned pasture (4.7%).
The early-spring burned pasture had a particu- larly high percentage of perennial forbs in OU (13.7%). Early-spring burning has increased peren- nial forbs, many of which are weedy in nature. Their increase indicates deterioration due to over- use of forage in that pasture. However, mid- and late-spring burning reduced the percentage of perennial forbs. Many prairie forbs grow in the early spring and thus escape intense summer com- petition by native perennial grasses. The forbs would be damaged by mid- and late-spring burn- ing, when they are actively growing.
TIME OF BURNING
FIG. 5. Basal cover (%) of perennial, annual and biennial forbs, and shrubs (IO-year average over all sites) for indicated burn- ing treatments.
The unburned check had 0.9% basal cover, mid- spring burned pasture, 0.7yo; and late-spring burned pasture, 0.5% basal cover of perennial forbs (Fig. 5).
Annual and Biennial For-lx
Different treatments did not change the per- centages of annual and biennial forbs in the pastures. The average was about 2.0yo of total vegetation over all treatments. Differences may have occurred in individual species under differ- ent treatments, but individual species were not analyzed. Percentages of annual and biennial forbs were highest in OU and LB and lowest in Cp.
The basal cover of annual and biennial forbs was highest in Cp (0.03yo) and lowest in OU and LB (O.OZyo) and did not significantly differ among the treatments (Fig. 5).
Shrubs
Shrubs during the 10 years averaged 1.20~o of total vegetation in the early-spring burned pasture. Mid- and late-spring burning had 0.85% shrubs, but the unburned check had considerably less, (0.547,). It was evident during the period that smooth sumac and leadplant increased in all the burned pastures. The principal increase in shrubby species came in LB as smooth sumac, however, leadplant in OU increased somewhat, particularly with late-spring burning. Cp was notably lacking in shrubby species.
Basal cover of shrubs during the 10 years in- creased in the mid- and late-spring burned pas- tures, but was relatively stable in unburned and early-burned pastures. Shrubs already had in- creased considerably in the early-burned pasture before the study period. Shrub basal cover was
b
May
a Unburned
JWle July
MONTHS
August sept
FIG. G. Effects of burning on average monthly steer gains (lb/ day), April 1 to October 1 (16-year summary, 1950-65). Weight gains for treatments with the same letter above the bar do not differ significantly (P < 0.10).
E-h;;$T OU and LB (0.8%) and lowest in
. 0 *
Cattle
The most desirable treatment from the stand- point of weight gain was late-spring burning. Mid- and late-spring burning significantly in- creased gains compared with nonburning (Fig. S), the primary increase in gains coming early in the growing season. Late-spring burning significantly increased gains 10 of the 14 summer seasons, only in 1953, ‘61, ‘62, and ‘64 were unburned pastures equal or superior. Late-spring burning also in- creased steer gains over early-spring burning. Weight gain obtained with early-spring burning was essentially equal to that obtained with non- burning overall, but early-spring burning resulted in higher gains than unburned early and lower gains late in the growing season.
Increased weight gain obtained by late- and mid-spring burning may be due to increasing nutritive value of plants. Smith and Young (1959) found that mid-spring burning increased the pro- tein and ash content of little bluestem, and Hall et al. (1952) reported that on a coastal plain forest site some species increased protein and phosphorus content under early-spring burning. Comparing digestibility of forage on an unburned and mid- spring burned (April 1-15) pasture, Smith et al. (1960) found dry matter and crude fiber digesti- bility was higher in forage consumed from the burned area.
Increase in palatability of forage on burned areas has been so well established that Duvall and Whitaker (1964) have used it as a basis for rotation burning. Instead of using fences to divide the area, a portion was burned. The remainder was lightly used or naturally deferred by grazing animals.
of forage on burned areas helps explain why ani- mals gained more with mid- and late-spring burn- ing. Forage production being much lower under early-spring burning and range condition declin- ing with each year’s burning likely explains why early-spring burning was of no benefit judged by animal performance.
Summary
Time of spring burning on bluestem range under uniform, moderate grazing was studied from the standpoint of effects on soil moisture, yield of herbage, range condition in terms of botanical composition, and cattle gains. Early burning, which leaves the soil surface unprotected from loss by runoff, evaporation, and surface ero- sion for a long period before new growth begins, lowered soil moisture. The rate of water intake is reduced by burning bluestem range and the reduction continues throughout the season (Hanks and Anderson, 1957). Aldous (1934) showed that early-spring burning permitted a quicker warming of the soil, hence growth was faster early in the season with consequent heavier use of soil mois- ture. All those sources of moisture loss, observed earlier in ungrazed plot trials on OU, were found to result only under early-spring burning in OI_J and Cp soils.
Herbage yields on grazed OU, LB, and Cp were adversely affected by early burning. That resulted in relatively heavier grazing as stocking rates were maintained. Thus depletion resulted both from moisture losses that occurred and from overutilization.
Late-spring burning, on the other hand, did not reduce forage yields and retrogression did not occur in any of the range sites sampled. Mid-spring burning caused intermediate forage yields with no retrogression.
Disappearance of herbage, which may be taken as an index of the amount used in grazing, was not different from one treatment to another, indi- cating approximately equal use, even where yields varied. Disappearance was greater, however, from OU than from the steeper, rockier LB, most likely because OU provided easier travel.
Botanical composition, the major criterion in judging range condition, showed definite response . .
rn bluestem range to time of burning. Early-spring burning resulted in a typical depletion response (retrogression-decline of the climax dominants, the decreasers; increase of certain lesser species, the increasers; and invasion by weedy species). Late- spring burning, on the other hand, favored the most desirable species, the decreasers, (especially big bluestem) and discouraged both the less valu- able increasers and weeds. Late-spring burning resulted in improved range condition. Since there
was no significant reduction of herbage produc- tion by late-spring burning, it seems compatible with the growth pattern of the species preferred for livestock grazing.
Mid- and late-spring burning produced more weight gain on steers than nonburning. Late- spring burning also increased steer gains over early-spring burning. The weight gain obtained with early-sprin g burning was essentially equal to that obtained with nonburning.
The effects of late-spring burning of moderately stocked bluestem range on soil moisture, herbage yield, range condition, and animal performance indicate burning to be desirable at that time.
Literature Cited
ALDOUS, A. E. 1934. Effect of burning on Kansas blue- stem pastures. Kansas Agr. Exp. Sta. Bull. 38: 6.5 p. ANDERSON, KLING L. 1965. Time of burning as it affects
soil moisture in an ordinary upland bluestem prairie in the Flint Hills. J. Range Manage. 18:3 11-316.
ANDERSON, KLING L., AND C. L. FLY. 1955. Vegetation- soil relationships in Flint Hills bluestem pastures. J. Range Manage. 8: 163-169.
DUVALL, V. L., AND L. B. WHITAKER. 1964. Rotation burning: a forage management system for longleaf pine- bluestem ranges. J. Range Manage. 17:322-326.
DYKSTERHUIS, E. J. 1949. Condition and management of rangeland based on quantitative ecology. J. Range Man- age. 2: 104-l 15.
EHRENREICH, J. H. 1959. Effect of burning and clipping on growth of native prairie in Iowa. J. Range Manage. 12:113-137.
HADLEY, E. B., AND B. J. KIECK~IEFER. 1963. Productivity of two prairie grasses in relation to fire frequency. Ecology 44: 389-395.
HALL, L. K., B. L. SOUTH~ELL, AND F. E. KNOX. 1952. Burning and grazing in coastal plain forests. Georgia Agr. Exp. Sta. Bull. 51: 33 p.
HANKS, R. J., AND KLING L. ANDERSON. 1957. Pasture burning and moisture conservation. J. Soil and Water Conserv. 12:228-229.
HENSEL, R. L. 1923. Effect of burning on vegetation in Kansas pastures. J. Agr. Res. 23:631-647.
HERBEL, C. H., AND KLINC L. ANDERSON. 1959. Response of True Prairie vegetation on major Flint Hills range sites to grazing treatment. Ecol. Monog. 29: 171-186. KOMAREK, E. V., SR. 1966. The meteorological basis for
fire ecology. Proc. 5th Tall Timbers Fire Ecol. Conf. 5:85-126.
MCMURPHY, W. E., AND KLING L. ANDERSON. 1963. Burn- ing bluestem-forage yields. Trans. Kansas Acad. Sci. 66:49-51.
MCMURPHY, W. E., AND KLING L. ANDERSON. 1965. Burn- ing Flint Hills range. J. Range Manage. 18:265-269. OWENSBY, CLENTON E., AND KLING L. ANDERSON. 1967.
Yield responses to time of burning in the Kansas Flint Hills. J. Range Manage. 20: 12-16.
RAUZI, FRANK, C. L. FLY, AND E. J. DYKSTERHUIS. 1968. Water intake on mid-continental rangelands as influ- enced by soil and plant cover. U.S. Dep. Agr. Tech. Bull. 1390. 58 p.
ing on the chemical composition of little bluestem. J. Range Manage. 12: 139-140.
SMITH, E. F., V. A. YOUNG, K. L. ANDERSON, W. S. RULIFI;- SON, AND S. N. ROGERS. 1960. The digestibility of forage on burned and nonburned bluestem pasture as deter- mined with grazing animals. J. Anim. Sci. 19:388-391.
WEAVER, J. E. 1954. North American Prairie. Johnsen Publishing Co. Lincoln, Nebraska. 347 p.
WEAVER, J. E., AND G. W. TOMANEK. 195 1. Ecological studies in a midwestern range: the vegetation and effects of cattle on its composition and distribution. Nebr. Cons. Bull. 31. 82 p.
Some Effects of Grazing Intensity
on Bitterbrush Dispersion1
BURT R. MCCONNELL AND JUSTIN G. SMITH
Pacific Northwest Forest and Range Experiment Station
Forest Service, U.S. Department
of
AgriculturePortland, Oregon.
Highlight
Three fence-line comparisons were made to determine the effect of grazing intensity on the density and dispersion of bitterbrush (Purshiu trident&a (Pursh) DC.) in a uni- form habitat. Bitterbrush density was reduced by heavy grazing but was not affected by moderate use. The large increases in mean area per plant that occurred under heavy grazing did not alter the overall form of random popula- tion dispersion. In a comparison of heavy versus moderate use, inclusion of l-year-old plants on the moderately grazed area (10% of population) caused aggregation of the popu- lation. Even though a larger number of l-year-old plants (22% of population) occurred in the heavily grazed com- parison, the population remained random. The contrast- ing reaction probably resulted from a differential pattern of seedling mortality due to different amounts of herba- ceous understory in the two shrub populations.
Measurement of the randomness of major spe- cies is one of the most important determinations to be made in the detailed analysis of a plant community (Curtis and McIntosh, 1950). If these species are randomly dispersed, certain conclusions are immediately in order. First, a chance distribu- tion such as this would indicate that the most important factors in the plant’s environment are at, or near, their optimum level. In some in- stances, no further investigation would be neces- sary beyond a description of prominent environ- mental features. Second, only a limited number of phytosociological characteristics would need study to provide an adequate picture of the com- munity, since most others could be deduced through the use of interrelations. Third, random dispersion could also mean that the abundant species have reached peak performance in the community and, subsequently, that they have been present for a considerable length of time (Whitford, 1949). By contrast, in successional
lReceived March 22, 1969; accepted for publication August 3, 1969.
communities random dispersion of a species may indicate that it will decline in the future (Greig- Smith, 1964).
Random distributions are exceptional in nature, however; and there is a general tendency for indi- viduals to occur in groups or aggregations. Con- sequently, most considerations of population dis- persion require more elaborate explanations than indicated above, and these may range from things such as the length of time a species has occupied a site to the presence of nonuniform habitat. Once established, however, nonrandomness dem- onstrates the existence of orderly, natural laws that should help us predict observed ecological patterns even though we may not, for the moment, know how to formulate them (Slobodkin, 1961). Thus, as has been pointed out by many other workers, the detection and analysis of nonrandom- ness is a starting place for further investigation of causal factors and not an end point in itself.
The present work was a part of a larger study of the effects of grazing on the structure and pro- ductivity of bitterbrush (Purshia tridentata (Pursh) DC.) communities. It was conducted on two areas (A and B in Table 1) in north-central Washington and another (C) in south-central Oregon. Each area was about 4 acres in size and had a distinct fence-line contrast in cattle use on bitterbrush.
Field sampling consisted of locating 100 or more random points in adjacent Z-acre study areas on each side of the fence in each of the three paired comparisons. At each random point the distance to the nearest established bitterbrush plant was measured to determine the spatial distribution of the shrub population, after Pielou (1959) as cor- rected by Mountford (1961).
The density of established shrubs was deter- mined by counting shrubs rooted within forty 100 ft2 circular sample plots located at a random subsample of the 100 random points. Differences between paired densities were subjected to a t test.